


Transatlantic Subnational Innovation Competitiveness Index 2.0
For policymakers to bolster the global competitiveness of their nations and regions, they first must know where they stand. This report benchmarks the 121 regions of Austria, Germany, Hungary, Italy, Poland, Sweden, and the United States using 13 commonly available indicators of strength in the knowledge economy, globalization, and innovation capacity.
KEY TAKEAWAYS
Key Takeaways
Contents
Appendix A: Composite and Category Scores Methodology. 50
Appendix B: Indicator Methodologies and Weights. 51
Appendix C: Estimation Methodologies. 52
Introduction
In this report, member think tanks of the Global Trade and Innovation Policy Alliance (GTIPA) analyze the subnational innovation competitiveness of the states and regions of seven nations: Austria, Germany, Hungary, Italy, Poland, Sweden, and the United States.[1] Most of these countries exhibit growth in innovation, yet it is imperative to understand the subnational aspect of competitiveness as well as to recommend targeted policies for further development.[2]
Competitiveness and innovation play a pivotal role in determining a nation’s—or state’s—ability to thrive in the fiercely competitive global marketplace. Competitiveness encompasses not only the capacity to produce high-quality goods and services at competitive costs but also the ability to create an environment that fosters productivity, attracts investments, and nurtures a skilled workforce. In an era marked by rapid globalization and digitalization, nations and states alike must consistently seek avenues to enhance their competitive edge to secure their position in the global economic hierarchy.[3]
Innovation ecosystems encompass intricate networks of stakeholders, including research institutions, universities, startups, corporations, investors, and government bodies, collaborating to foster the creation, diffusion, and application of novel knowledge and technologies.[4] Regional hubs such as Silicon Valley in the United States and Stockholm in Sweden stand as exemplars of this paradigm, showcasing remarkable success in cultivating vibrant innovation ecosystems. The availability of state-of-the-art infrastructure, coupled with a talent-rich environment, attracts and retains skilled individuals crucial to advance these ecosystems’ vitality. By offering fertile ground for multidisciplinary collaboration, resource sharing, and risk mitigation, these regional hubs epitomize the success of innovation ecosystems.[5]
Understanding the components of innovation ecosystems at both national and subnational levels is vital for fostering a holistic and tailored approach to innovation-driven development. At the national level, such understanding allows governments to formulate comprehensive policies that leverage synergies among various actors such as research institutions, regulatory policies, funding mechanisms, and education systems.[6] This facilitates the creation of an enabling environment conducive to research, entrepreneurship, and technology diffusion. On the subnational level, recognizing the unique strengths and assets of specific regions enables targeted interventions that capitalize on local expertise, resources, and industries. This localized approach fosters the emergence of vibrant innovation clusters, encourages collaboration among local stakeholders, and bolsters regional economic growth.[7]
Overall, a dual understanding of the innovation ecosystem ensures that strategies align with both national priorities and local dynamics, thereby maximizing the potential for sustainable innovation and economic advancement at regional and national levels alike.
The Global Innovation Index (GII) and the European Innovation Scorecard (EIS) are prominent tools that provide comprehensive assessments of innovation performance on a global and regional scale. The GII offers a multidimensional perspective on innovation, evaluating factors such as R&D investments, human capital, and business sophistication, which collectively contribute to a country’s innovation capacity.[8] Similarly, the EIS provides a detailed analysis of innovation trends and capabilities within European Union member states, facilitating benchmarking and policy evaluation.[9]
In line with GII and EIS, the Information Technology and Innovation Foundation (ITIF) has contributed significantly to the discourse on innovation competitiveness through its series of insightful subnational innovation competitiveness reports, which provide nuanced insights into the intricate relationships between innovation, economic development, and regional competitiveness, offering valuable perspectives for policymakers, businesses, and researchers alike. ITIF’s “State New Economy Index” report series delves into the role of innovation in driving U.S. state-level economic growth and highlights the transformation of industries through technological advancements.[10] The “North American Subnational Innovation Competitiveness” report delves into innovation dynamics within the North American region, emphasizing the significance of local ecosystems in enhancing competitiveness. Furthermore, the GTIPA’s 2022 “Transatlantic Subnational Innovation Competitiveness” report examines innovation landscapes across Europe (Germany and Italy) and North America (Canada and the United States), shedding light on the interplay between subnational entities and cross-border collaboration.[11] This new report, the Transatlantic Subnational Innovation Competitiveness Index 2.0 (“TASICI 2.0”), examines the innovation competitiveness of the 121 regions of Austria, Germany, Hungary, Italy, Poland, Sweden, and the United States.
The following section of this report first introduces the index’s indicators and then assesses each country’s regions’ performance thereon. The report concludes by providing policy recommendations to the seven countries on how to boost their subnational innovation competitiveness based on their unique strengths and weaknesses.
The Index
The TASICI 2.0 captures the innovation performance of 121 regions across 7 countries and 2 continents: Austria (8 regions), Germany (13 regions), Hungary (7 regions), Italy (20 regions), Poland (16 regions), Sweden (7 regions), and the United States (50 states). In this report, we refer to the U.S. states as regions to simplify the comparative analysis.
This report considers 13 indicators (which were found to be commonly available across the 121 regions of these seven countries) representing the relevant determinants of a successful innovation ecosystem, grouped into three categories:
▪ Knowledge-Based Workforce: Indicators measure the educational attainment of the workforce; immigration of knowledge workers; employment in professional, technical, and scientific (PTS) activities; and manufacturing sector productivity.
▪ Globalization: Indicators measure high-tech exports and inward foreign direct investment (FDI).
▪ Innovation Capacity: Indicators measure a state’s share of households subscribing to broadband Internet, expenditures on R&D, the number of R&D personnel, the creation of new businesses, patent output, the extent of progress toward decarbonization, and venture capital (VC) investment.
The most important category of the TASICI 2.0 is innovation capacity, which accounts for 56 percent of the index’s weight, while the knowledge economy indicators account for 31 percent of the index’s weight, and the globalization indicators account for the remaining 13 percent.
Rankings
Table 1: Overall and component performance of regions in TASICI 2.0
|
Overall Rank |
Overall Score |
Knowledge |
Globalization |
Innovation |
|||||
|
Country |
Region |
Score |
Rank |
Score |
Rank |
Score |
Rank |
||
|
1 |
USA |
Massachusetts |
95.3 |
94.9 |
1 |
31.9 |
38 |
95.4 |
1 |
|
2 |
USA |
California |
88.8 |
89.1 |
4 |
21.3 |
69 |
92.0 |
2 |
|
3 |
Germany |
Baden-Württemberg |
85.3 |
64.4 |
19 |
49.6 |
8 |
90.9 |
3 |
|
4 |
USA |
Washington |
80.3 |
71.6 |
11 |
15.6 |
87 |
90.1 |
4 |
|
5 |
Sweden |
Greater Metropolitan Region |
79.2 |
91.6 |
3 |
28.1 |
45 |
75.2 |
5 |
|
6 |
Sweden |
West Sweden |
69.8 |
71.4 |
12 |
32.8 |
31 |
70.5 |
8 |
|
7 |
Germany |
Bavaria |
69.5 |
63.6 |
20 |
44.6 |
11 |
70.5 |
7 |
|
8 |
Sweden |
South Sweden |
65.7 |
67.5 |
16 |
33.9 |
25 |
66.3 |
9 |
|
9 |
Germany |
Hesse |
64.5 |
71.6 |
10 |
38.4 |
17 |
61.4 |
11 |
|
10 |
USA |
Maryland |
62.9 |
86.3 |
5 |
15.7 |
86 |
58.4 |
13 |
|
11 |
Germany |
Berlin/Brandenburg |
61.9 |
82.4 |
7 |
17.7 |
80 |
58.3 |
14 |
|
12 |
USA |
New Jersey |
58.2 |
91.9 |
2 |
13.1 |
100 |
49.9 |
23 |
|
13 |
USA |
Oregon |
57.0 |
55.3 |
30 |
25.9 |
55 |
62.2 |
10 |
|
14 |
Austria |
Lower Austria/Vienna |
55.6 |
66.4 |
18 |
4.2 |
121 |
61.1 |
12 |
|
15 |
USA |
Connecticut |
53.1 |
74.2 |
8 |
25.9 |
54 |
47.6 |
28 |
|
16 |
Austria |
Styria |
52.7 |
34.1 |
78 |
10.2 |
106 |
70.9 |
6 |
|
17 |
USA |
Delaware |
52.1 |
62.2 |
22 |
22.8 |
63 |
53.0 |
20 |
|
18 |
USA |
Colorado |
51.1 |
68.9 |
15 |
27.2 |
49 |
47.0 |
29 |
|
19 |
Germany |
Hamburg/Schleswig-Holstein |
50.9 |
69.5 |
13 |
28.4 |
44 |
46.1 |
31 |
|
20 |
USA |
Michigan |
48.8 |
50.6 |
38 |
17.8 |
79 |
55.4 |
18 |
|
21 |
Italy |
Emilia-Romagna |
48.2 |
45.8 |
48 |
36.9 |
21 |
51.3 |
21 |
|
22 |
Germany |
North Rhine-Westphalia |
47.8 |
57.6 |
26 |
32.0 |
37 |
46.4 |
30 |
|
23 |
USA |
New Hampshire |
47.5 |
48.3 |
42 |
30.9 |
41 |
50.9 |
22 |
|
24 |
USA |
New Mexico |
47.3 |
44.1 |
50 |
15.2 |
90 |
57.1 |
15 |
|
25 |
USA |
New York |
47.3 |
69.4 |
14 |
22.5 |
64 |
42.7 |
36 |
|
26 |
USA |
Minnesota |
47.0 |
58.7 |
25 |
21.5 |
68 |
47.8 |
26 |
|
27 |
USA |
Utah |
46.9 |
54.5 |
31 |
22.4 |
65 |
49.5 |
24 |
|
28 |
Germany |
Bremen/Lower Saxony |
46.2 |
55.5 |
28 |
23.5 |
59 |
47.7 |
27 |
|
29 |
USA |
Virginia |
44.3 |
83.2 |
6 |
23.0 |
62 |
31.7 |
62 |
|
30 |
Germany |
Rhineland-Palatinate |
44.0 |
50.7 |
37 |
26.8 |
50 |
46.0 |
32 |
|
31 |
USA |
Illinois |
43.8 |
67.2 |
17 |
27.4 |
46 |
37.5 |
49 |
|
32 |
USA |
Texas |
43.7 |
73.4 |
9 |
32.4 |
34 |
32.9 |
61 |
|
33 |
Hungary |
Central Hungary |
43.4 |
31.0 |
84 |
49.0 |
9 |
48.1 |
25 |
|
34 |
Germany |
Saxony |
42.5 |
49.3 |
41 |
30.2 |
42 |
43.5 |
34 |
|
35 |
Austria |
Upper Austria |
42.1 |
33.0 |
81 |
11.1 |
105 |
56.3 |
17 |
|
36 |
Italy |
Lombardy |
41.8 |
52.3 |
33 |
43.7 |
12 |
37.2 |
50 |
|
37 |
Germany |
Saarland |
41.1 |
46.4 |
44 |
36.5 |
22 |
41.2 |
38 |
|
38 |
Austria |
Tyrol |
41.1 |
31.3 |
83 |
6.7 |
119 |
57.0 |
16 |
|
39 |
Austria |
Vorarlberg |
40.6 |
30.5 |
87 |
11.6 |
103 |
55.2 |
19 |
|
40 |
USA |
North Carolina |
40.3 |
60.3 |
23 |
12.1 |
102 |
40.2 |
40 |
|
41 |
Sweden |
Upper Norrland |
39.8 |
49.4 |
40 |
23.0 |
61 |
41.7 |
37 |
|
42 |
Italy |
Lazio |
38.8 |
55.4 |
29 |
21.5 |
67 |
37.8 |
47 |
|
43 |
USA |
Pennsylvania |
38.5 |
56.1 |
27 |
18.6 |
74 |
37.9 |
46 |
|
44 |
Italy |
Piedmont |
38.2 |
40.4 |
58 |
38.2 |
18 |
39.5 |
42 |
|
45 |
USA |
Arizona |
37.4 |
51.5 |
36 |
20.2 |
71 |
38.0 |
45 |
|
46 |
Germany |
Thuringia |
37.2 |
43.6 |
51 |
27.4 |
47 |
39.6 |
41 |
|
47 |
Italy |
Friuli-Venezia Giulia |
36.8 |
38.2 |
66 |
35.6 |
24 |
39.3 |
43 |
|
48 |
USA |
Idaho |
35.9 |
34.2 |
74 |
18.9 |
73 |
44.7 |
33 |
|
49 |
Poland |
Dolnośląskie |
35.8 |
31.0 |
85 |
56.5 |
7 |
35.4 |
53 |
|
50 |
Austria |
Salzburg |
35.0 |
46.0 |
47 |
8.1 |
114 |
40.9 |
39 |
|
51 |
Sweden |
Småland and the Islands |
34.9 |
39.4 |
61 |
42.8 |
13 |
34.0 |
57 |
|
52 |
USA |
Wisconsin |
33.7 |
38.3 |
65 |
26.6 |
52 |
37.5 |
48 |
|
53 |
USA |
Rhode Island |
33.5 |
46.3 |
45 |
22.2 |
66 |
34.5 |
54 |
|
54 |
Hungary |
Central Transdanubia |
33.5 |
19.2 |
103 |
95.8 |
2 |
26.5 |
73 |
|
55 |
Italy |
Veneto |
33.4 |
35.9 |
72 |
31.5 |
39 |
36.8 |
52 |
|
56 |
Poland |
Małopolskie |
33.1 |
21.2 |
100 |
31.5 |
40 |
43.5 |
35 |
|
57 |
USA |
Missouri |
32.4 |
44.6 |
49 |
32.4 |
32 |
30.9 |
63 |
|
58 |
USA |
Ohio |
32.3 |
47.2 |
43 |
18.3 |
76 |
33.6 |
58 |
|
59 |
Italy |
Tuscany |
32.0 |
37.5 |
70 |
21.2 |
70 |
37.0 |
51 |
|
60 |
Hungary |
Western Transdanubia |
30.6 |
19.9 |
102 |
95.8 |
2 |
22.2 |
88 |
|
61 |
Germany |
Mecklenburg-Vorpommern |
30.6 |
41.5 |
54 |
17.5 |
81 |
34.2 |
56 |
|
62 |
Austria |
Carinthia |
30.5 |
38.7 |
63 |
8.0 |
115 |
38.2 |
44 |
|
63 |
USA |
Indiana |
30.3 |
42.6 |
53 |
14.0 |
93 |
34.3 |
55 |
|
64 |
Italy |
Liguria |
29.2 |
41.2 |
55 |
24.5 |
57 |
30.2 |
64 |
|
65 |
Poland |
Pomorskie |
29.1 |
26.6 |
93 |
37.9 |
20 |
33.4 |
60 |
|
66 |
Sweden |
North Middle Sweden |
28.5 |
40.5 |
57 |
33.0 |
28 |
27.2 |
69 |
|
67 |
USA |
Kansas |
28.4 |
50.3 |
39 |
15.9 |
84 |
27.3 |
68 |
|
68 |
USA |
Georgia |
28.4 |
51.6 |
34 |
13.2 |
99 |
27.3 |
67 |
|
69 |
USA |
Florida |
27.9 |
54.4 |
32 |
13.3 |
98 |
25.3 |
79 |
|
70 |
Hungary |
Southern Great Plain |
27.3 |
21.7 |
99 |
62.9 |
4 |
26.1 |
77 |
|
71 |
Poland |
Mazowieckie |
26.6 |
51.6 |
35 |
36.0 |
23 |
18.3 |
103 |
|
72 |
Italy |
Marche |
26.2 |
29.7 |
90 |
18.1 |
78 |
33.5 |
59 |
|
73 |
Hungary |
Northern Hungary |
26.0 |
18.7 |
105 |
95.8 |
2 |
16.2 |
109 |
|
74 |
USA |
Wyoming |
25.6 |
58.8 |
24 |
9.6 |
110 |
21.0 |
94 |
|
75 |
Italy |
Trentino |
24.6 |
32.2 |
82 |
18.6 |
75 |
29.8 |
65 |
|
76 |
Italy |
Abruzzo |
24.5 |
34.2 |
76 |
26.8 |
51 |
26.4 |
74 |
|
77 |
Poland |
Śląskie |
24.5 |
23.4 |
97 |
45.8 |
10 |
26.1 |
76 |
|
78 |
Sweden |
Middle Norrland |
24.5 |
40.3 |
59 |
26.4 |
53 |
23.5 |
84 |
|
79 |
Germany |
Saxony-Anhalt |
24.1 |
40.3 |
60 |
14.5 |
91 |
26.4 |
75 |
|
80 |
Italy |
Umbria |
23.8 |
34.2 |
75 |
16.9 |
83 |
28.3 |
66 |
|
81 |
Hungary |
Northern Great Plain |
23.6 |
18.4 |
106 |
62.8 |
5 |
22.5 |
87 |
|
82 |
USA |
Iowa |
22.9 |
37.0 |
71 |
12.2 |
101 |
27.0 |
71 |
|
83 |
USA |
Vermont |
22.7 |
37.7 |
69 |
32.8 |
29 |
20.4 |
95 |
|
84 |
USA |
Tennessee |
22.6 |
42.6 |
52 |
15.3 |
89 |
22.9 |
85 |
|
85 |
USA |
Maine |
22.4 |
37.8 |
68 |
32.8 |
30 |
20.0 |
97 |
|
86 |
Hungary |
Southern Transdanubia |
21.9 |
11.4 |
117 |
58.1 |
6 |
24.8 |
80 |
|
87 |
USA |
Nevada |
21.4 |
39.1 |
62 |
15.9 |
85 |
22.8 |
86 |
|
88 |
USA |
Nebraska |
21.3 |
46.1 |
46 |
13.8 |
94 |
19.8 |
99 |
|
89 |
Poland |
Lubuskie |
20.1 |
12.8 |
113 |
39.6 |
16 |
26.9 |
72 |
|
90 |
Poland |
Wielkopolskie |
19.7 |
17.2 |
108 |
39.6 |
15 |
24.3 |
81 |
|
91 |
USA |
Kentucky |
19.0 |
34.0 |
79 |
32.1 |
36 |
17.3 |
104 |
|
92 |
USA |
South Carolina |
18.3 |
37.9 |
67 |
13.6 |
96 |
19.7 |
102 |
|
93 |
Italy |
Campania |
18.3 |
23.9 |
96 |
11.2 |
104 |
27.1 |
70 |
|
94 |
USA |
North Dakota |
18.0 |
35.8 |
73 |
15.6 |
88 |
19.7 |
101 |
|
95 |
USA |
Louisiana |
17.5 |
62.8 |
21 |
9.5 |
111 |
7.7 |
120 |
|
96 |
Poland |
Podkarpackie |
17.2 |
11.1 |
119 |
38.0 |
19 |
24.1 |
82 |
|
97 |
USA |
Alabama |
17.2 |
34.1 |
77 |
8.8 |
113 |
21.3 |
93 |
|
98 |
Poland |
Lubelskie |
17.0 |
11.8 |
115 |
29.2 |
43 |
26.1 |
78 |
|
99 |
Italy |
Aosta Valley |
15.9 |
30.5 |
88 |
13.7 |
95 |
19.9 |
98 |
|
100 |
Poland |
Zachodniopomorskie |
15.8 |
15.2 |
112 |
32.2 |
35 |
21.9 |
89 |
|
101 |
Poland |
Kujawsko-Pomorskie |
15.8 |
11.2 |
118 |
32.4 |
33 |
23.7 |
83 |
|
102 |
USA |
Montana |
15.2 |
40.6 |
56 |
7.1 |
116 |
15.9 |
112 |
|
103 |
Italy |
Basilicata |
14.9 |
27.7 |
92 |
23.8 |
58 |
16.9 |
106 |
|
104 |
USA |
Hawaii |
14.7 |
38.6 |
64 |
6.7 |
118 |
16.2 |
110 |
|
105 |
USA |
Oklahoma |
14.2 |
33.5 |
80 |
17.5 |
82 |
15.0 |
113 |
|
106 |
Poland |
Podlaskie |
13.8 |
12.7 |
114 |
27.3 |
48 |
21.6 |
92 |
|
107 |
Italy |
Molise |
13.7 |
23.2 |
98 |
9.0 |
112 |
21.7 |
91 |
|
108 |
Italy |
Sardinia |
13.0 |
24.0 |
95 |
9.7 |
109 |
20.1 |
96 |
|
109 |
Poland |
Łódzkie |
12.7 |
20.2 |
101 |
33.4 |
26 |
14.8 |
114 |
|
110 |
Poland |
Opolskie |
12.6 |
11.6 |
116 |
42.2 |
14 |
16.2 |
111 |
|
111 |
USA |
Alaska |
11.2 |
30.1 |
89 |
13.5 |
97 |
13.5 |
116 |
|
112 |
Poland |
Warmińsko-Mazurskie |
11.1 |
5.1 |
121 |
33.3 |
27 |
19.8 |
100 |
|
113 |
Austria |
Burgenland |
10.6 |
15.3 |
111 |
6.7 |
117 |
21.7 |
90 |
|
114 |
USA |
South Dakota |
10.3 |
24.8 |
94 |
19.4 |
72 |
13.1 |
117 |
|
115 |
USA |
Arkansas |
9.2 |
27.9 |
91 |
14.2 |
92 |
11.6 |
118 |
|
116 |
Italy |
Apulia |
9.2 |
19.2 |
104 |
9.8 |
108 |
17.0 |
105 |
|
117 |
Italy |
Sicily |
8.1 |
16.8 |
109 |
9.9 |
107 |
16.5 |
107 |
|
118 |
Poland |
Świętokrzyskie |
7.7 |
11.0 |
120 |
25.6 |
56 |
14.3 |
115 |
|
119 |
USA |
West Virginia |
7.2 |
30.8 |
86 |
23.5 |
60 |
4.6 |
121 |
|
120 |
Italy |
Calabria |
7.0 |
16.6 |
110 |
5.4 |
120 |
16.4 |
108 |
|
121 |
USA |
Mississippi |
4.7 |
17.4 |
107 |
18.2 |
77 |
9.0 |
119 |
Index Scores
Overall
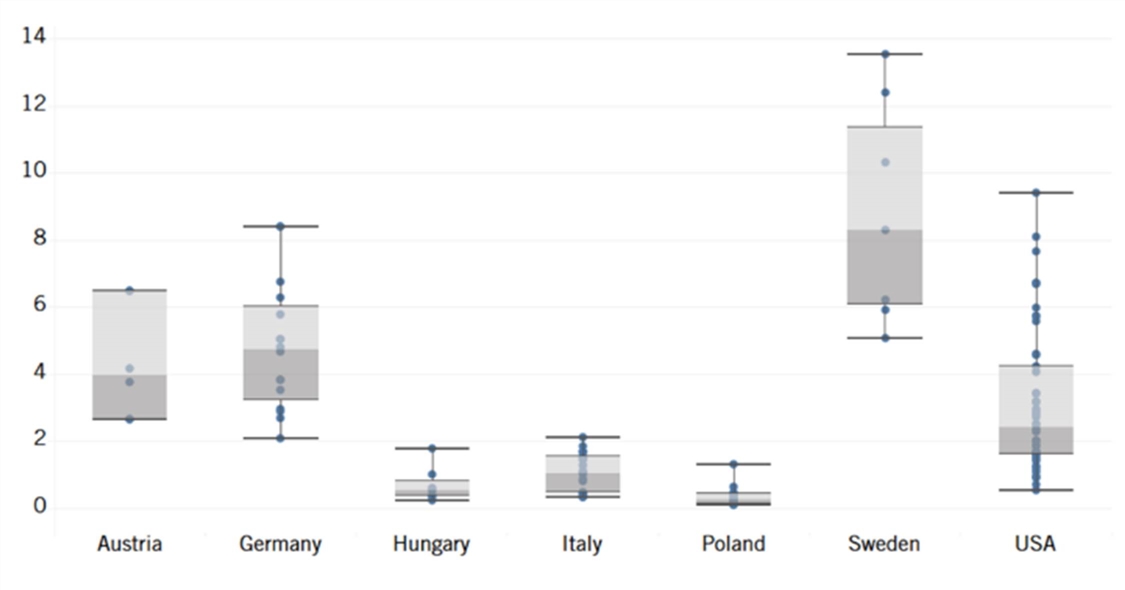
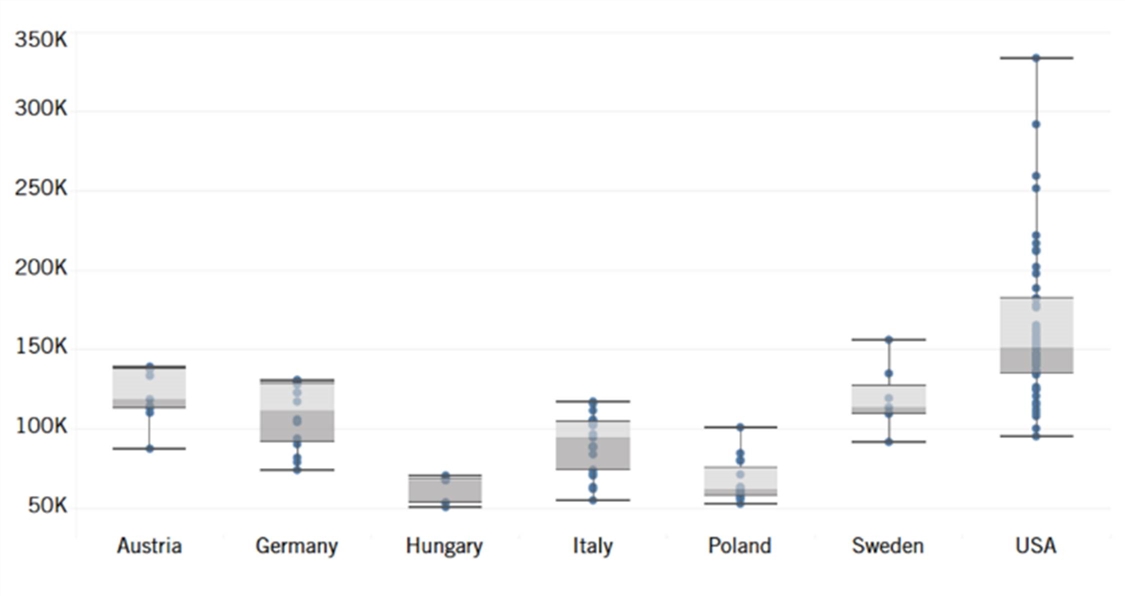
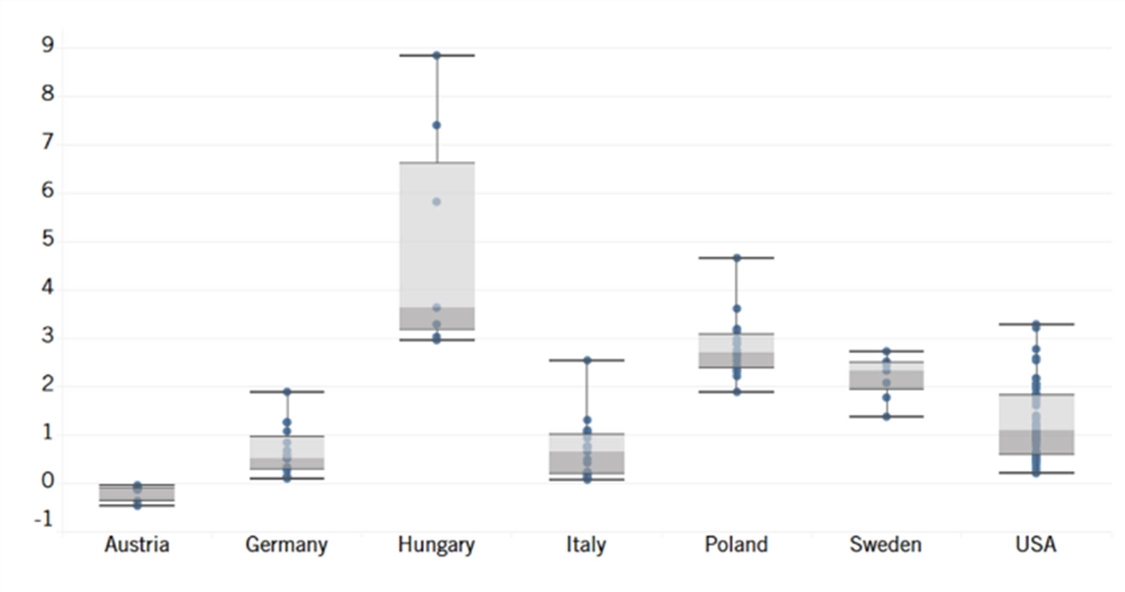
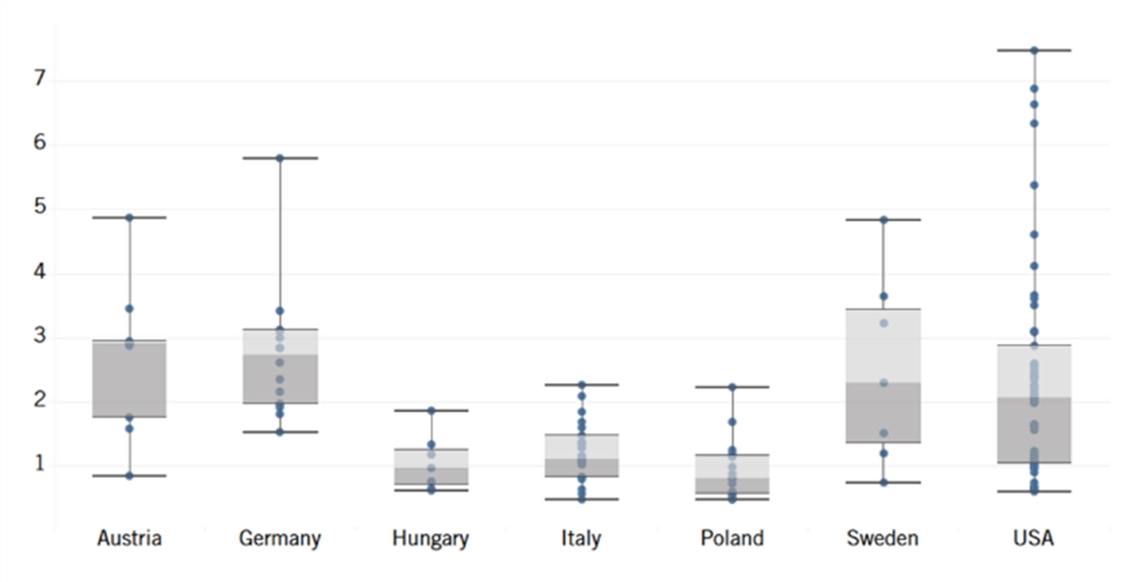
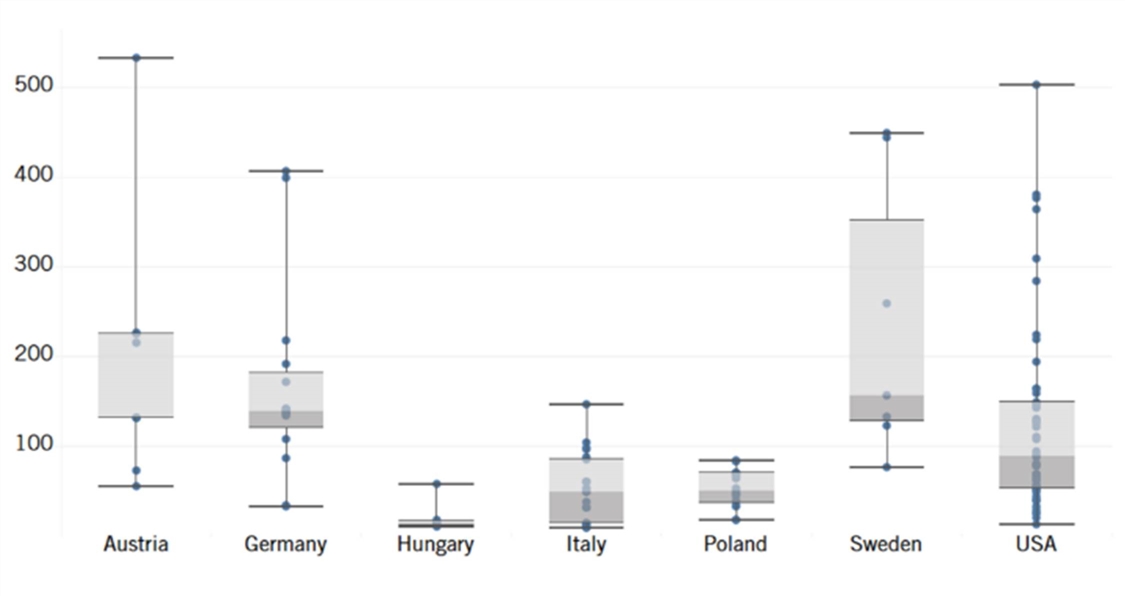
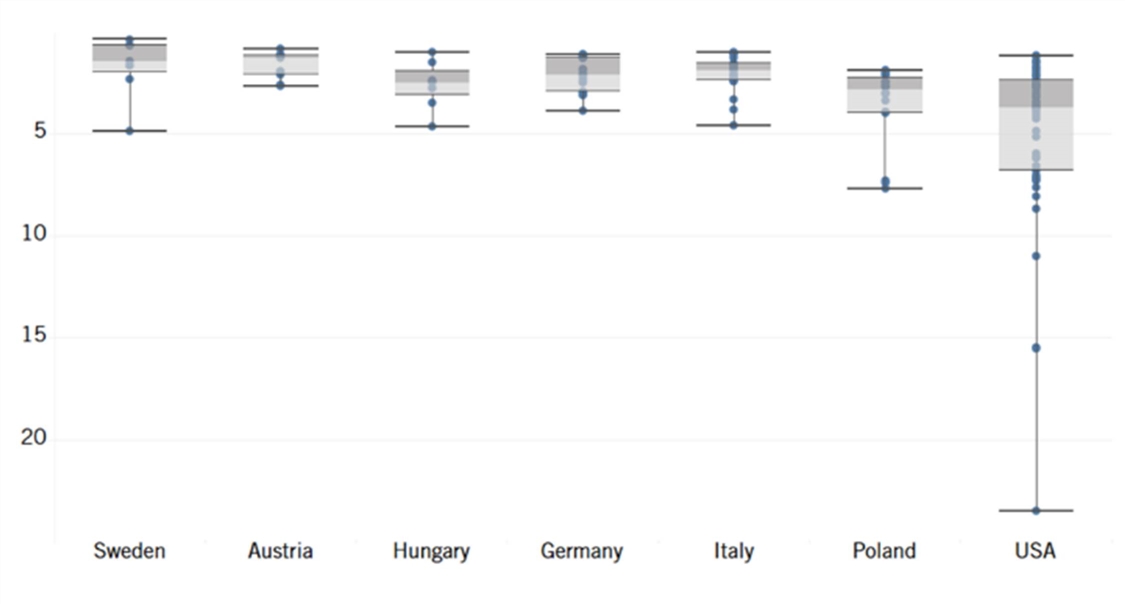
The United States leads in subnational innovation competitiveness, claiming the top two regions, Massachusetts and California (although it is also home to the lowest-performing region in the index, Mississippi, as well) (see figure 1 and figure 2). Germany and Sweden each place three regions in the top 10, and overall display less variability than does the United States in regional performance. The difference between the maximum and the minimum subnational innovation competitiveness score is the smallest in Hungary and Poland, although the best-performing regions in Hungary and Poland rank lower than those of Italy. Austrian regions also showcase varied performance with two regions in the top 20 and one region in the bottom 10.
Figure 1: Maximum, minimum, quartiles, and median of overall subnational innovation competitiveness scores by country (dots denote the regions)[12] 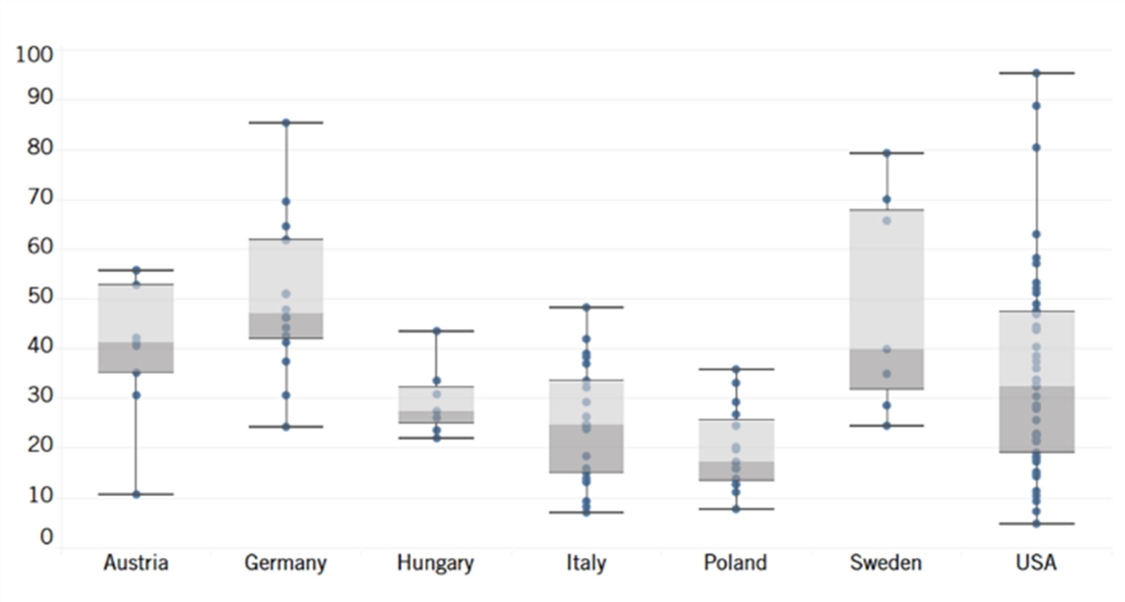
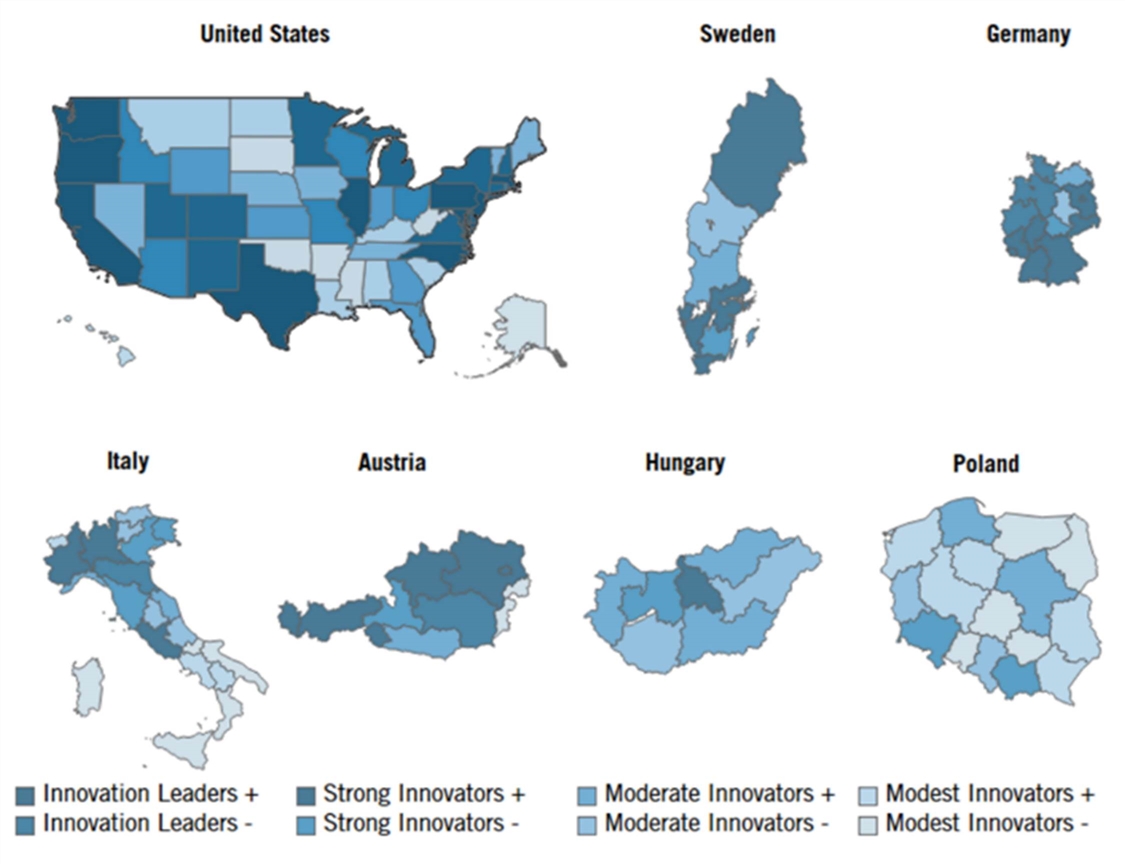
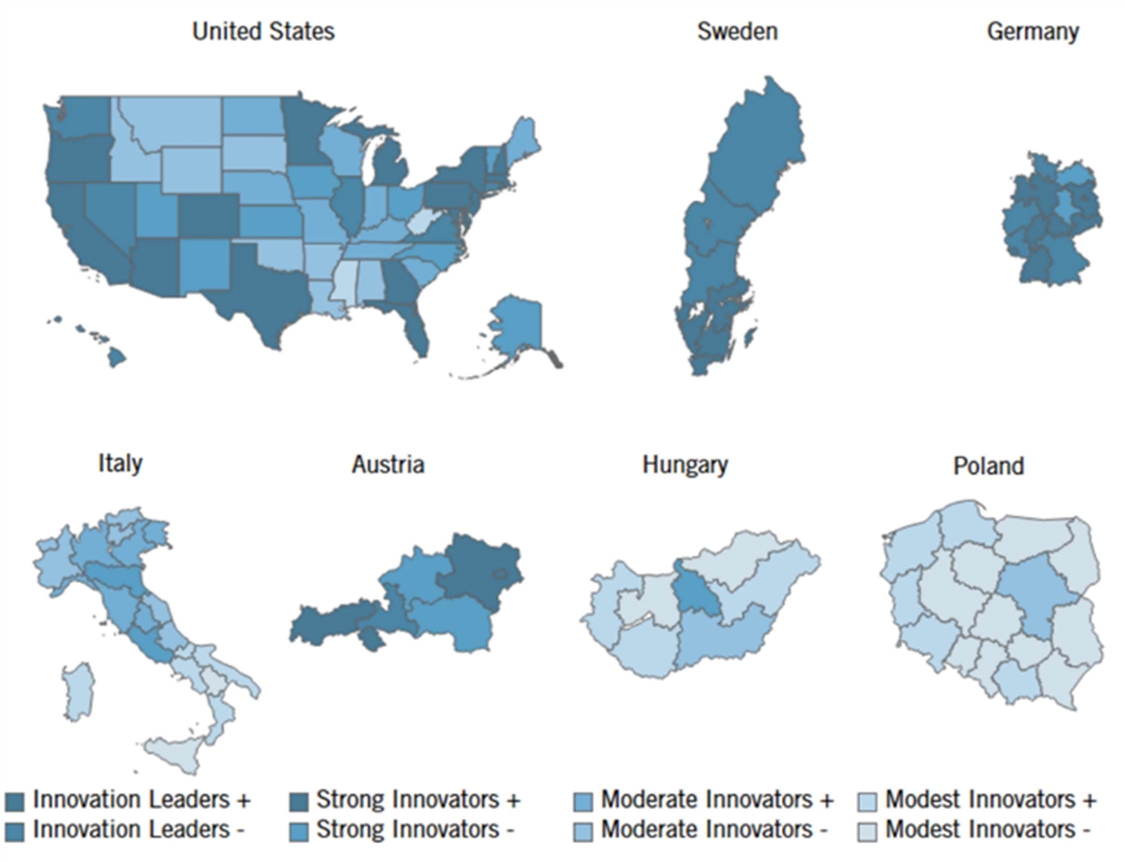
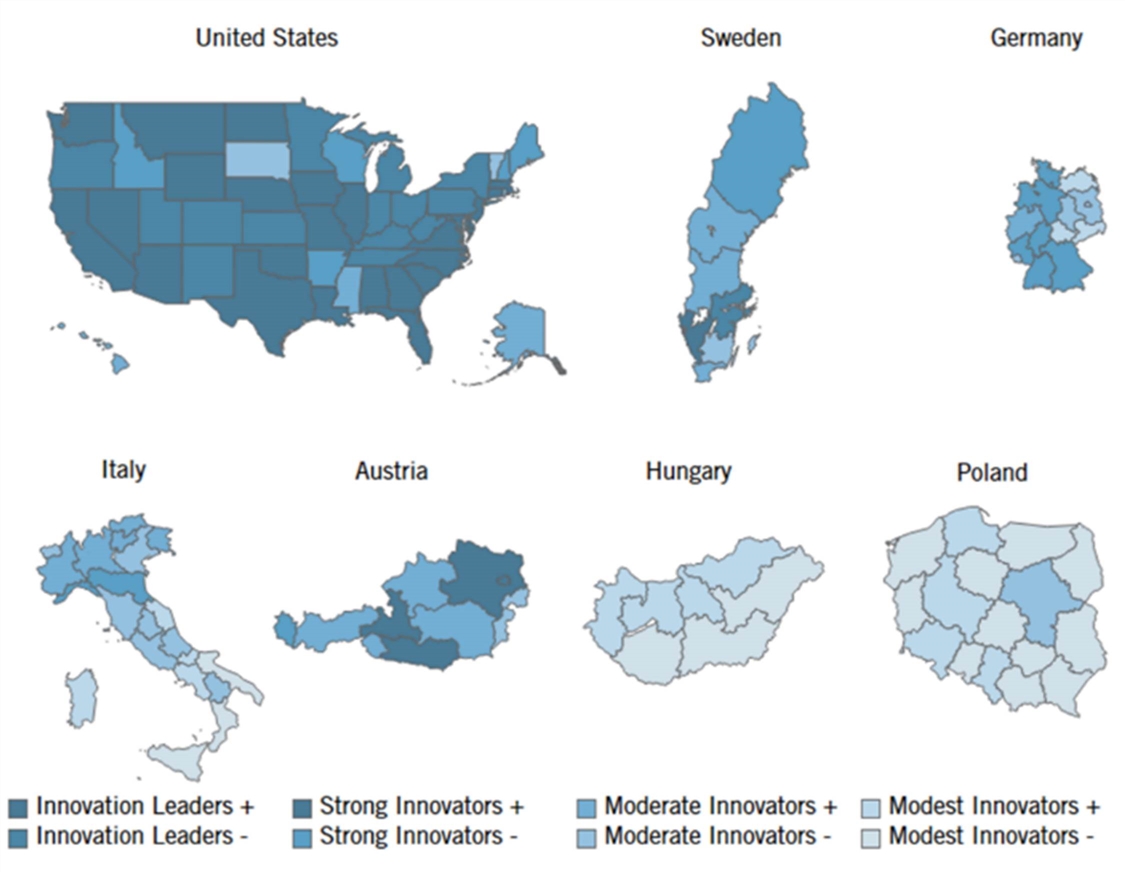
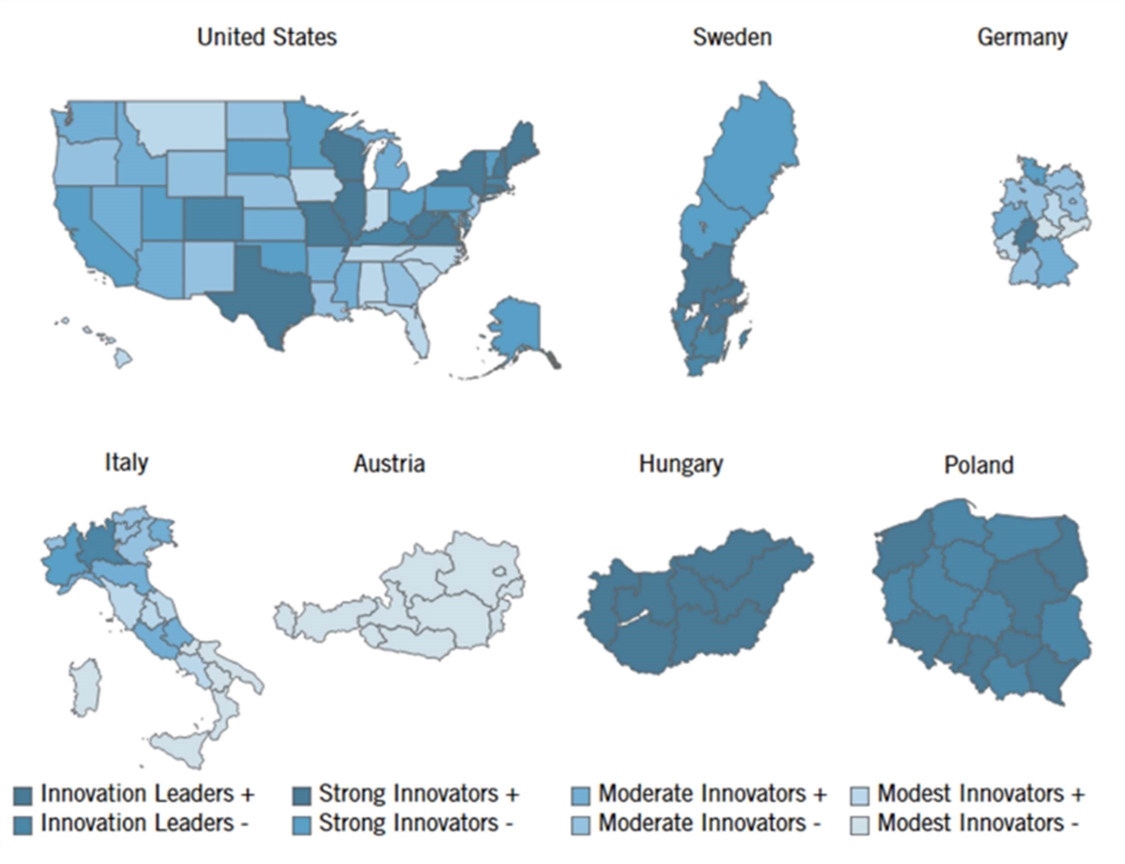
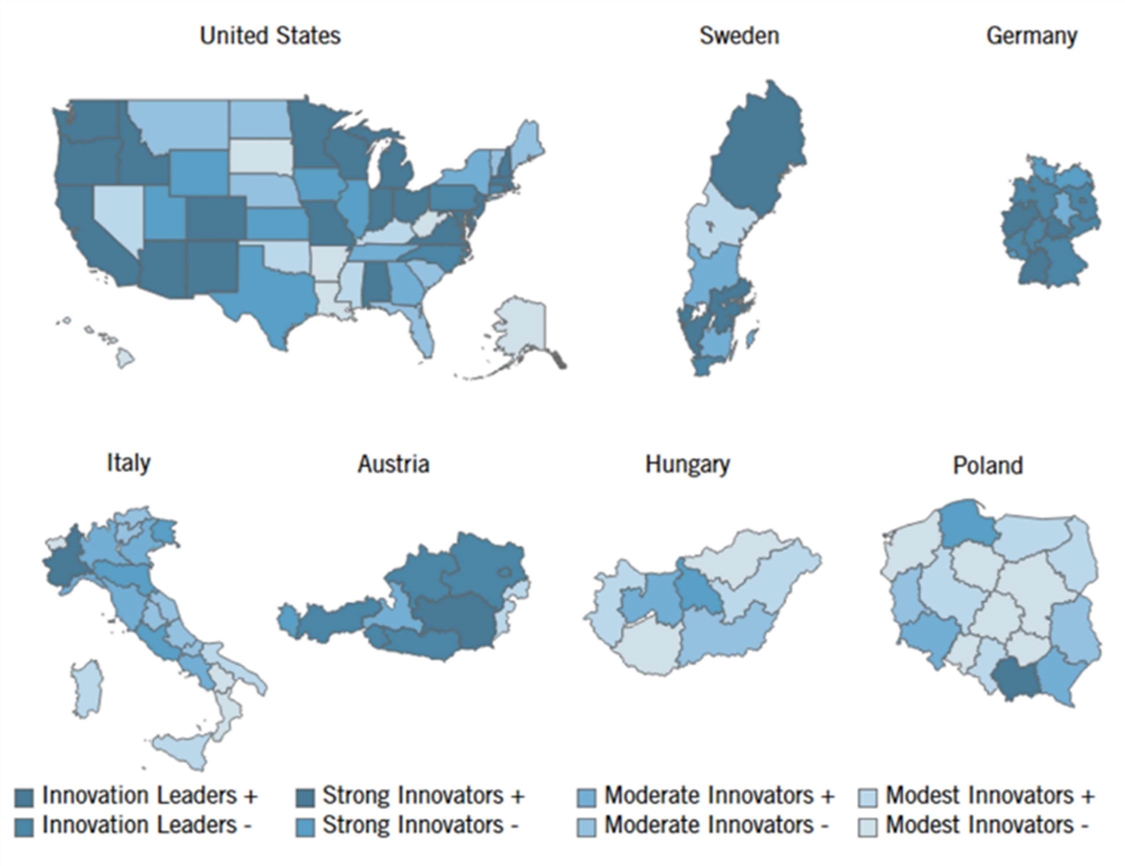
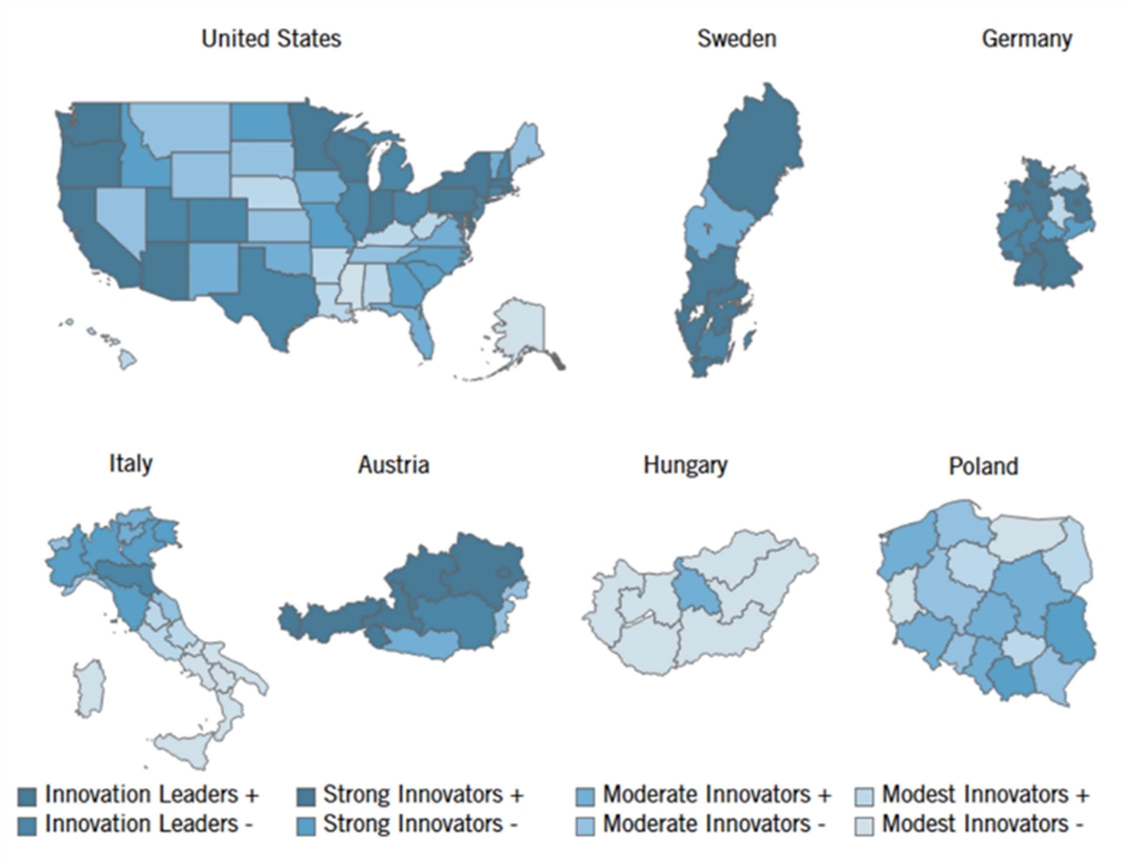
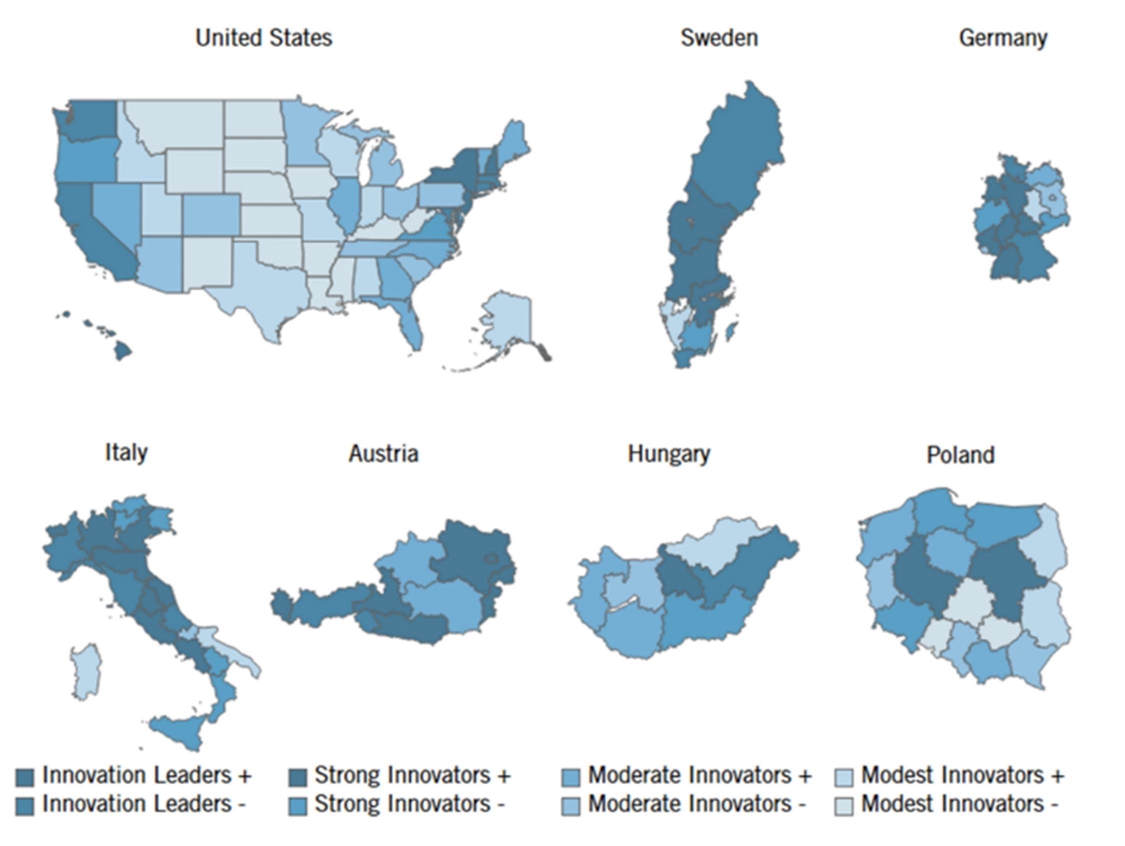
Regions were sorted into eight innovation competitiveness categories: modest innovator -, modest innovator +, moderate innovator -, moderate innovator +, strong innovator -, strong innovator +, innovation leader -, and innovation leader +, based on the regions’ positions in the ranking. The number of regions in each category was selected to be 15 to place an equal number of regions in each category given that there are 121 regions in total. The minus sign in the name of the category indicates that its regions fall into a lower category than those regions that are in the respective category with a positive sign. As the colors of the charts indicate, the categories’ ascending order is modest innovator, moderate innovator, strong innovator, and innovation leader, in line with the ranking methodology of the European Innovation Scorecard.
The east and west coasts of the United States exhibit strong innovation performance, while states in the middle and Southeast of the country are lagging modest innovators such as Oklahoma, Arkansas, and South Dakota. The United States scores diversely as it has states in all eight innovation categories. In Sweden, the leading regions are the Greater Metropolitan Region, West Sweden, and South Sweden, which all score in the top ten and are close to the capital of Sweden, Stockholm. Upper Norrland is a strong innovator region despite being furthest from the capital, while Middle Norrland comes in as being a moderate innovator. Germany has several regions that are innovation leaders, but the best-performing thereof are Baden-Württemberg, Bavaria, and Hesse. The moderate innovator regions in Germany are Saxony-Anhalt and Mecklenburg-Vorpommern, which were both part of the Eastern Bloc during the Cold War. In Italy, the north-south disparity is apparent, as most regions in the south are modest innovators such as Sicily or Calabria, while in the north there are many strong innovator regions as well as an innovation leader, Emilia-Romagna. Most Hungarian regions fall in the moderate innovators category; however, Central Hungary and Central Transdanubia are strong innovators due to their globalized economy and strong innovation capacity. The Polish strong innovator regions are Małopolskie and Dolnośląskie, while the region around the capital, Mazowieckie, is only a moderate innovator. Most Austrian regions rank in the top half, but performance diversity is significant. While Styria and Lower Austria are innovation leaders, Burgenland ranks in the lowest innovation competitiveness category.
Figure 2: Overall TASICI 2.0 subnational innovation competitiveness scores[13]
Knowledge Economy
Highly Educated Population
Why is this important? This indicator measures the share of a region’s 25–64-year-old (“prime age”) population with a bachelor’s degree (or equivalent) or higher. Education provides citizens with the skills and knowledge necessary to compete and innovate in the modern economy. While more time spent in school does not necessarily guarantee sufficient applied skills to compete in the modern global innovation economy—for example, the Council for Aid to Education found that 44 percent of current U.S. university graduates are not proficient in essential career skills—the proportion of highly educated residents remains a strong indicator of human capital.[14] Moreover, evidence suggests that more educated individuals are more likely and willing to adopt new technological innovations.[15]
Figure 3: Share of the 25–64-year-old population with a bachelor’s degree (or equivalent) or higher, 2019 (%)[16]
The rankings: The data illuminate distinct patterns and trends that underscore the varying approaches countries—and states therein—take to cultivate highly educated populations and drive innovation (see figure 3 and figure 4). Across the United States, states such as Massachusetts, California, and Washington stand as beacons of high educational achievement, boasting percentages of highly educated populations exceeding 35 percent. These regions have harnessed their strong education systems and innovation ecosystems to fuel technological progress. Conversely, states such as Mississippi (23 percent) face educational challenges rooted in socioeconomic disparities and limited resources.
Interestingly, the data exposes regions grappling with educational challenges. Italy’s southern regions, such as Sicily and Calabria, demonstrate lower percentages of highly educated populations, indicating potential disparities in access to quality education, which inhibits their full participation in the global knowledge economy. In Italy, an intriguing pattern emerges between the northern and southern regions. Regions like Lazio (26 percent) and Emilia-Romagna (23 percent) in the north exhibit higher percentages of highly educated populations compared to regions in the south, such as Calabria (16 percent) and Sicily (14 percent). This disparity mirrors the broader socioeconomic gaps between northern and southern Italy, potentially influencing educational access and attainment.
Sweden’s innovative prowess shines through the Greater Metropolitan Region, with a highly educated population percentage exceeding 36 percent. Sweden’s focus on a robust education system and forward-thinking policies has positioned it as a leader in fostering human capital for innovation. In contrast to the Greater Metropolitan Region’s beacon of educational excellence in Sweden, other regions present varying levels of educational attainment. South Sweden (34 percent) and West Sweden (31 percent) demonstrate substantial education levels, reflective of the nation’s emphasis on accessible and quality education. Meanwhile, North Middle Sweden (25 percent) and Middle Norrland (25 percent) exhibit lower percentages, potentially indicating unique challenges or disparities that impact educational access in these areas.
Germany’s Berlin and Brandenburg combined region (37 percent) highlights the impact of targeted policies and collaboration between academia and industry, driving technological advancements and propelling the region to the forefront of innovation. Germany’s regional trends highlight the impact of historical divisions. The Berlin and Brandenburg combined region (37 percent) showcases the successful fusion of education and technology, emblematic of the region’s historical role as a hub of innovation. In contrast, regions such as Saxony-Anhalt (23 percent) grapple with the legacy of economic restructuring and transition.
Similarly, Austria displays regional variations, with Lower Austria and Vienna (23 percent) standing out as a hub of educational achievement compared to Burgenland (11 percent). This suggests a divide in educational resources and opportunities, reflecting the impact of regional economic disparities and access to quality education.
In the context of less-developed countries, regions in Hungary and Poland showcase diverse educational trajectories. While certain regions struggle to exceed a highly educated population percentage of 25 percent (such as Southern Transdanubia in Hungary or Lubuskie in Poland), Poland’s Mazowieckie region (41 percent) serves as an example of how strategic investment and educational reforms can uplift national performance and foster innovation.
In Poland, the data showcases a divergence between regions such as Mazowieckie (41 percent) and Lubuskie (24 percent). This reveals a regional contrast in educational attainment and innovation potential, possibly influenced by varying economic conditions, educational infrastructure, and policy priorities. While Mazowieckie demonstrates a strong emphasis on education and research, Lubuskie faces hurdles in fostering a highly educated populace.
Figure 4: Performance map in highly skilled workforce indicator[17]
Skilled Immigration
Why is this important? Skilled immigration brings together workers with unique educational experiences and backgrounds as a driver of innovative ideas. Level of skill can be difficult to quantify, so this indicator is instead measured via educational attainment, calculated as a region’s share of foreign-born workers with at least some tertiary education relative to the total regional population. A 2016 ITIF study found that foreign-born workers living in the United States are highly represented in the number of scientists and engineers producing meaningful innovations, compared with the overall levels of immigration in the United States.[18] Similarly, half of Silicon Valley’s artificial intelligence (AI) start-ups have foreign-born founders.[19] A separate study found that 52 percent of all Silicon Valley start-ups have at least one foreign-born founder.[20] In addition to contributing to a state’s stock of skilled human capital, highly educated immigrant populations raise wages for both domestic- and foreign-born workers.[21]
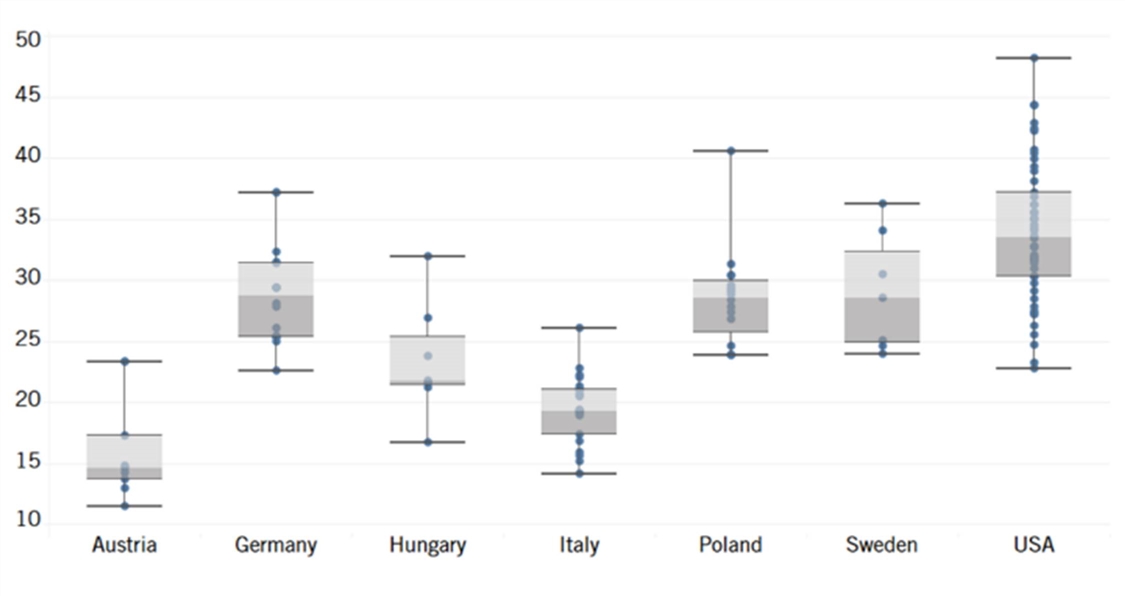
Figure 5: Share of population that is foreign-born and has some tertiary education, 2019[22]
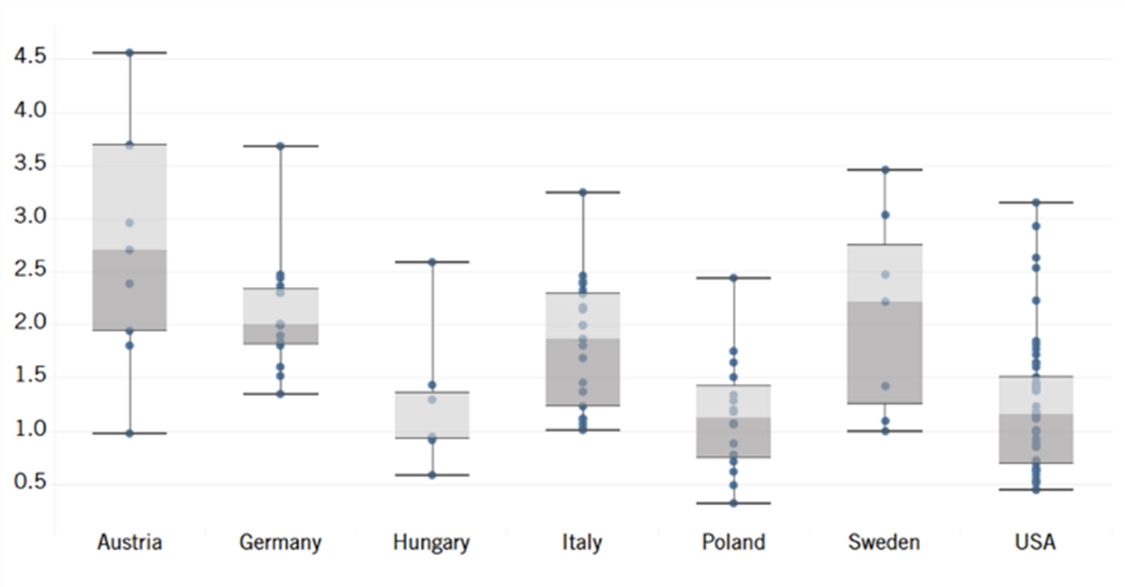
The rankings: Austria, Sweden, and the United States tend to have higher levels of skilled immigrants (see figure 5 and figure 6). On the other hand, countries such as Hungary, Italy, and Poland generally exhibit lower levels.
While the Mazowieckie and Dolnośląskie regions lead the way in Poland with higher skilled immigration indicators (1.3 percent and 0.6 percent respectively), other areas like Świętokrzyskie and Podkarpackie display relatively lower levels (0.1 percent and 0.1 percent). This diverse trend underscores Poland’s mixed appeal to skilled migrants, with certain regions standing out as magnets for skilled professionals.
Austria’s skilled immigration landscape portrays more consistent patterns. Lower Austria and Vienna (6.5 percent) stand out with higher skilled immigration indicators, while others indicate less of their allure to skilled migrants, such as Styria and Upper Austria (2.7 percent and 2.6 percent). Overall, most regions in Austria offer promising opportunities, drawing skilled individuals seeking to enhance their careers and quality of life.
The data highlights Sweden’s compelling ability to attract skilled migrants. Regions like the Greater Metropolitan Region (13.5 percent), South Sweden (12.4 percent), and West Sweden (10.3 percent) emerge as strong magnets for skilled immigrants. These regions offer a combination of robust job markets and high living standards, which is appealing to skilled professionals seeking better employment prospects.
Hungary’s skilled immigration trend showcases regional disparities. Central Hungary (1.8 percent) and Southern Great Plain (1 percent) demonstrate relatively high skilled immigration, potentially due to economic opportunities in urban centers. Meanwhile, Northern Hungary (0.2 percent) and Central Transdanubia (0.3 percent) reflect comparatively lower levels of skilled immigration.
Italy’s skilled immigration landscape exhibits a mix of patterns. Regions like Emilia-Romagna (2.1 percent), Lazio (1.8 percent), and Tuscany (1.7 percent) stand out in skilled immigration, possibly driven by economic activity and cultural attractions. Conversely, regions like Basilicata (0.34 percent) and Sicily (0.34 percent) showcase underperformance in skilled immigration.
Germany’s skilled immigration trend reflects consistent patterns. Regions like Berlin and Brandenburg (8.4 percent), Hesse (6.7 percent), and Baden-Württemberg (6.3 percent) present good skilled immigration levels, indicating their status as major hubs for skilled migrants. Other regions, like Saxony-Anhalt (2.1 percent) and Mecklenburg-Vorpommern (2.7 percent), exhibit relatively lower levels of skilled immigration.
In the United States, the skilled immigration landscape is marked by diversity. States like California (9.4 percent), New Jersey (8.1 percent), and New York (7.7 percent) score well in skilled immigration, reflecting their thriving economies and opportunities. Contrastingly, states like Mississippi (0.5 percent) and West Virginia (0.7 percent) exhibit lower scores, signifying a lesser appeal to skilled migrants.
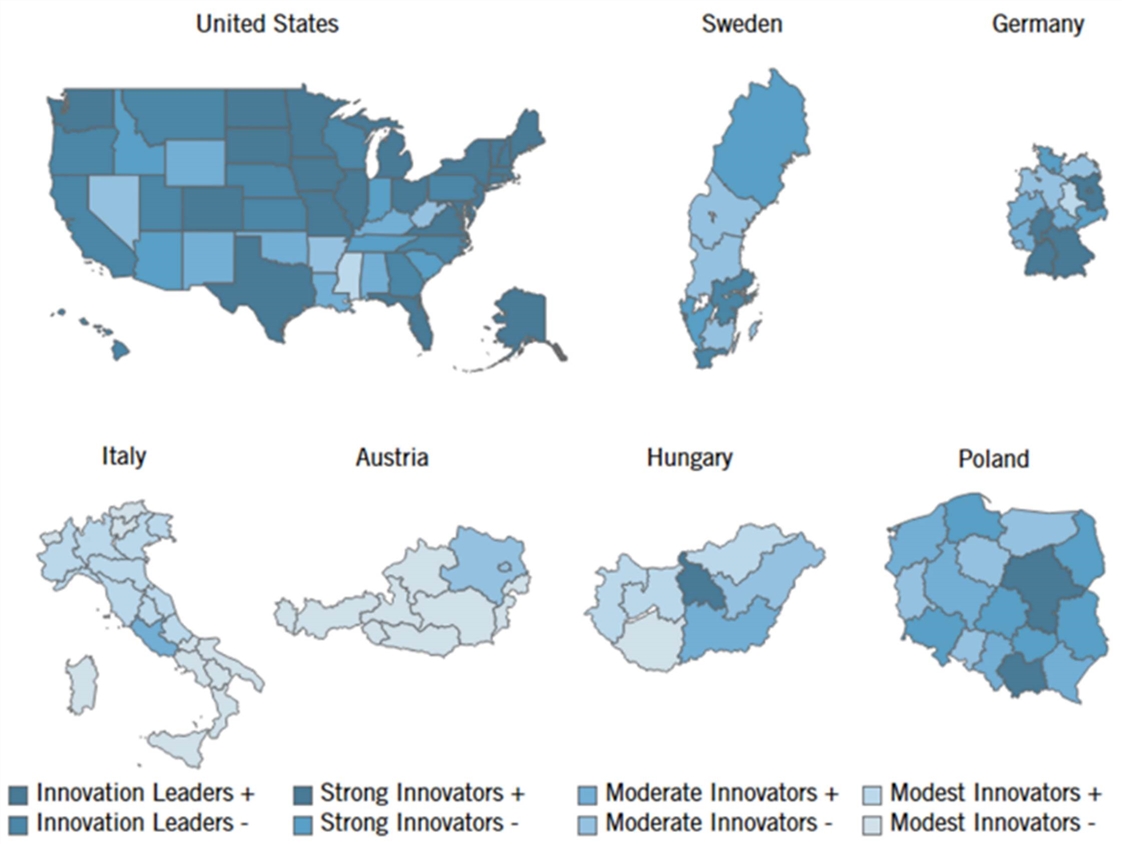
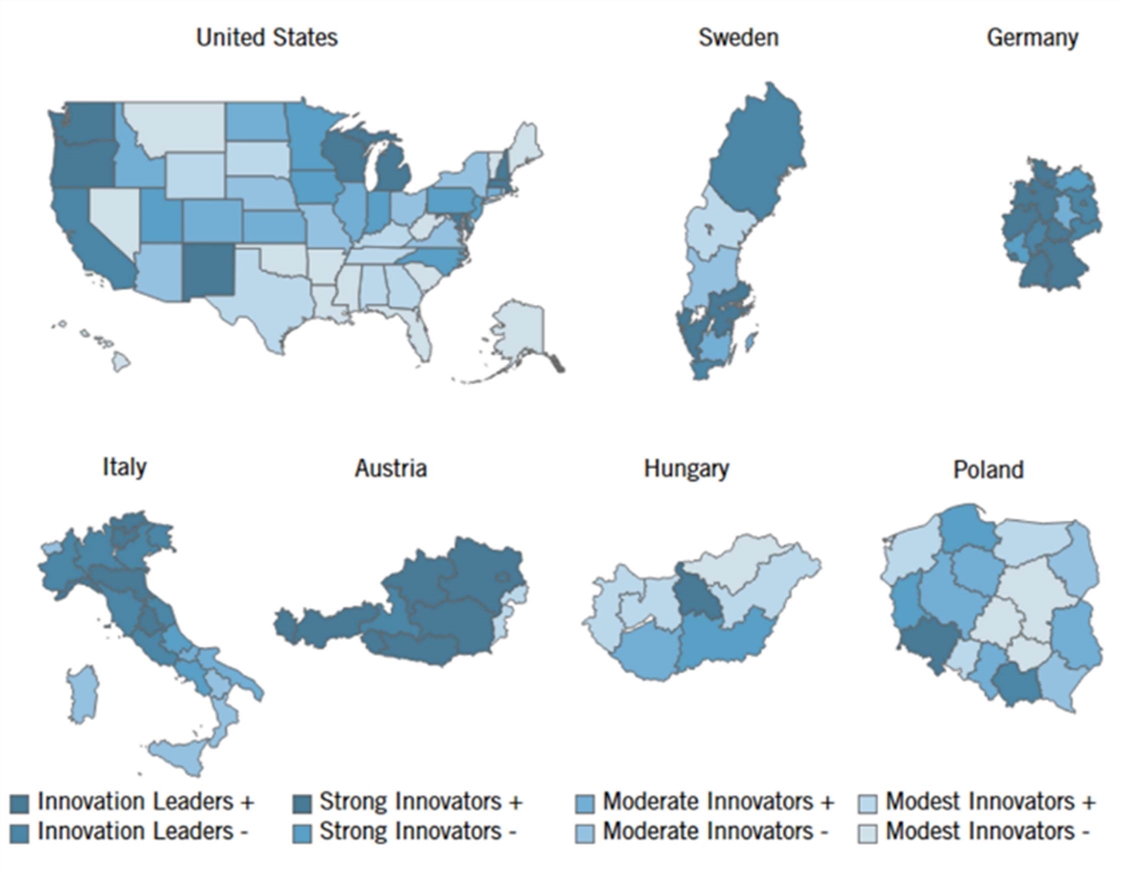
Figure 6: Performance map in skilled immigration indicator[23]
Professional, Scientific, and Technical Employment
Why is this important? This indicator measures the share of employees working in PTS activities in each region. This includes, for example, engineers, researchers, and lawyers. PTS services include those needed to facilitate the development, implementation, and commercialization of innovations. Automation and globalization also make high-value-added professional services increasingly important in the modern economy. These occupations are highly knowledge-intensive and therefore harder to offshore. States with greater concentrations in these occupations are thus somewhat-less threatened by increased levels of globalization.
Figure 7: Share of employees in professional, technical, and scientific services fields, 2019[24]
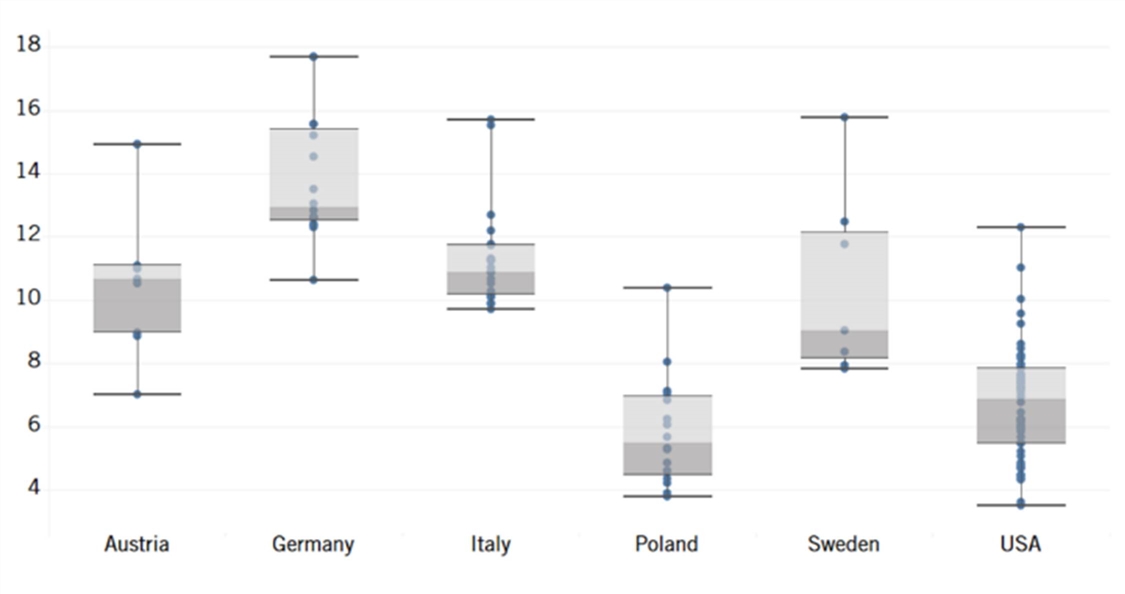
The rankings: The data reveals a range of professional, technical, and scientific employment levels across Poland’s regions (see figure 7 and figure 8). Regions like Mazowieckie (10.4 percent), Dolnośląskie (8 percent), and Pomorskie (7.1 percent) showcase higher levels of skilled employment. These regions demonstrate Poland’s growing capacity to attract and accommodate skilled professionals in diverse fields.
Austria exhibits a similar trend with certain regions leading in PTS employment. Notably, Lower Austria and Vienna (14.9 percent), Styria (11.1 percent), and Upper Austria (10.7 percent) stand out as hubs for skilled labor. These regions’ higher percentages signal Austria’s allure as a destination for professionals seeking advanced career opportunities.
Sweden displays a consistent pattern, with regions like the Greater Metropolitan Region (15.8 percent), West Sweden (12.5 percent), and South Sweden (11.8 percent) prominently featuring PTS employment. These regions emphasize Sweden’s reputation for high-quality education and innovation, attracting professionals from diverse fields.
Italy’s employment landscape reflects varying degrees of PTS employment. Regions like Lazio (15.7 percent) and Lombardy (15.5 percent) lead in this aspect, indicating their role as economic and cultural centers. The data underscores Italy’s capacity to provide skilled opportunities in sectors ranging from technology to the arts.
Germany presents a dynamic picture, with regions such as Berlin and Brandenburg (17.7 percent), Hamburg and Schleswig-Holstein (15.6 percent), and Hesse (15.2 percent) featuring prominently in PTS employment. These regions highlight Germany’s renowned research and innovation ecosystem, contributing to a robust employment landscape.
The United States’ PTS employment trends vary across its states. Virginia (12.3 percent), Massachusetts (11 percent), and Maryland (10 percent) stand out with high PTS employment indicators, signifying the country’s technological and economic prowess. The data underscores the United States’ appeal to professionals seeking diverse career opportunities.
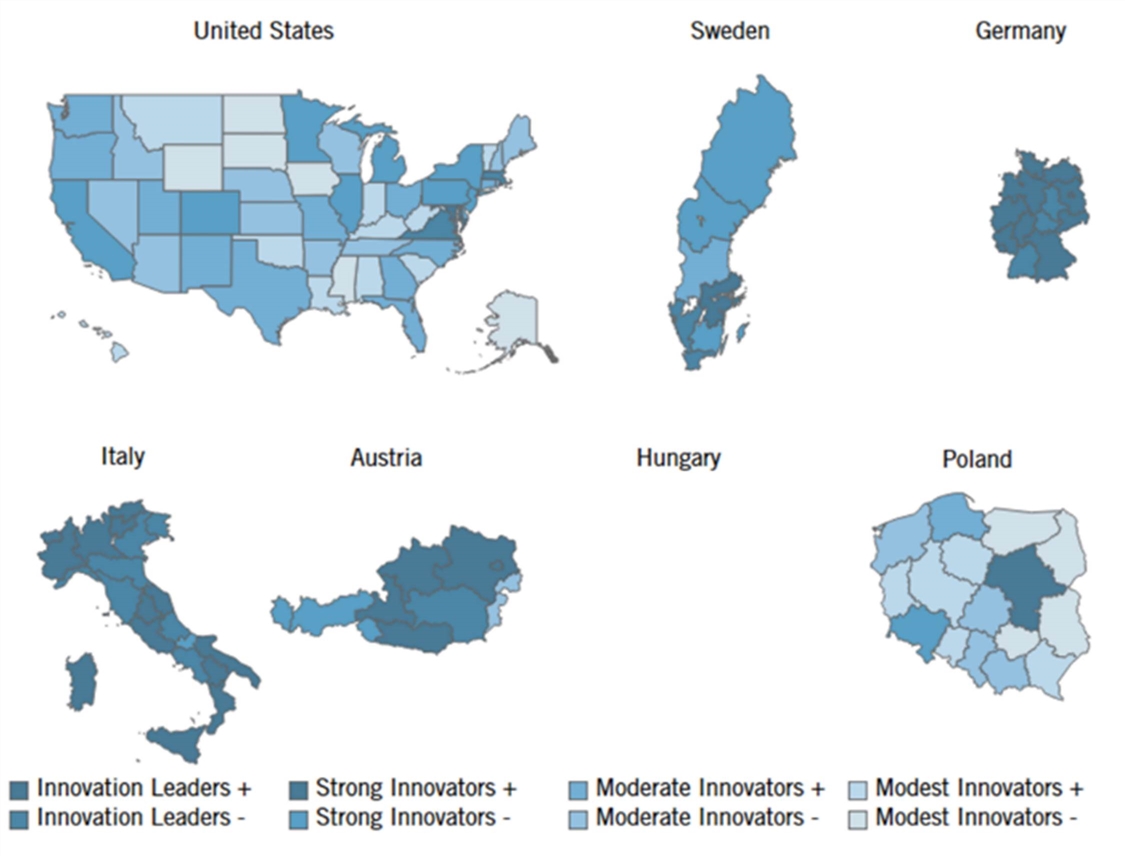
Figure 8: Performance map in professional, technical, and scientific employment indicator[25]
Manufacturing Labor Productivity
Why is this important? Gross value added (GVA) measures the contribution to gross domestic product (GDP) made by an individual producer, industry, or sector. This indicator measures the average GVA per manufacturing worker on a purchasing power parity (PPP) basis. Within manufacturing, high-value-added firms are most often capital-intensive, producing more technologically complex products and organizing their workers to take better advantage of their skills. They typically pay higher wages because their workers are more productive, generating greater value for each hour worked. All else being equal, firms with higher value-added levels are more likely to be able to meet global competitiveness challenges. Unfortunately, U.S. manufacturing labor productivity has been in decline for some time, falling by 1.34 percent between 2012 and 2019.[26]
Figure 9: PPP-adjusted gross value added per worker in the manufacturing sector, 2019[27]
The rankings: Manufacturing labor productivity in Poland showcases regional differences (see figure 9 and figure 10). Mazowieckie stands out with an impressive value of $101,035, indicating its robust industrial performance compared to other Polish regions. Dolnośląskie ($84,779) and Śląskie ($80,115) also demonstrate strong productivity, underlining Poland’s industrial prowess.
Austria exhibits notable regional differences in manufacturing labor productivity. Salzburg ($137,394), Lower Austria and Vienna ($137,394), and Carinthia ($133,671) lead, reflecting their advanced manufacturing sectors. On the other hand, Burgenland ($87,192) lags behind in manufacturing productivity.
Sweden’s manufacturing labor productivity is characterized by consistency. Greater Metropolitan Region ($155,934) and West Sweden ($134,998) shine as productive hubs, underlining Sweden’s high-tech manufacturing strength. This trend echoes Sweden’s reputation as an innovative manufacturing leader.
Hungary’s regions display mixed productivity figures. Central Hungary ($69,068) is one of the leading regions in Hungary, possibly due to Budapest’s economic influence. Although some regions like the Northern Great Plain ($53,575) lag, these variations could reflect different industrial profiles.
Italy’s manufacturing productivity varies widely across regions. Liguria ($116,913) and Emilia-Romagna ($115,841) excel, aligning with their reputation for high-quality manufacturing. Regions like Sicily ($63,129) and Calabria ($54,669) exhibit lower productivity, potentially indicating challenges in their manufacturing sectors.
Germany also showcases robust manufacturing productivity across its states. Hamburg and Schleswig-Holstein ($129,721) and Bremen and Lower Saxony ($130,497) lead, reflecting the strength of these regions. Southern states like Baden-Württemberg ($127,622) and Bavaria ($123,028) also stand out, mirroring Germany’s overall industrial prowess.
U.S. states exhibit significant diversity in their levels of manufacturing productivity. The data reports that states such as Louisiana ($333,712) and Wyoming ($291,511) have the highest levels of manufacturing productivity, although this data is significantly skewed by the prevalence of the oil and gas sectors (such as refining) in these states’ economies. (Unfortunately, to maintain the international comparisons needed for this study, it was not possible to back out the distortive effects of these states’ large energy sectors.) That said, Indiana, Ohio, and Michigan—which are more indicative of the actual performance of the more manufacturing-oriented U.S. states—perform much more in line ($176,518; $152,458; and $147,100, respectively) with top regions in Austria, Germany, or Sweden, and still outperform regions in Italy, Hungary, and Poland. States such as Hawaii ($108,148) and Vermont ($100,084) display comparatively lower manufacturing output, possibly due to their smaller industrial bases.
Figure 10: Performance map in manufacturing labor productivity indicator[28]
Globalization
High-Tech Exports
Why is this important? This indicator measures a region’s exports in the machinery manufacturing; computer and electronic products manufacturing; and electrical equipment, appliances, and components manufacturing industries (North American Industry Classification System “NAICS” 333–335 or equivalent) as a share of GDP. These represent high-value-added goods that are crucial in the modern global economy. Considering a region’s exports of these goods as a share of its GDP shows to what extent a region has a comparative advantage in high-tech production and export. Moreover, this indicator represents a region’s position in global value chains for the production of these goods.
Figure 11: Exports in NAICS 333–335 (or equivalent) as a share of GDP, 2017[29]
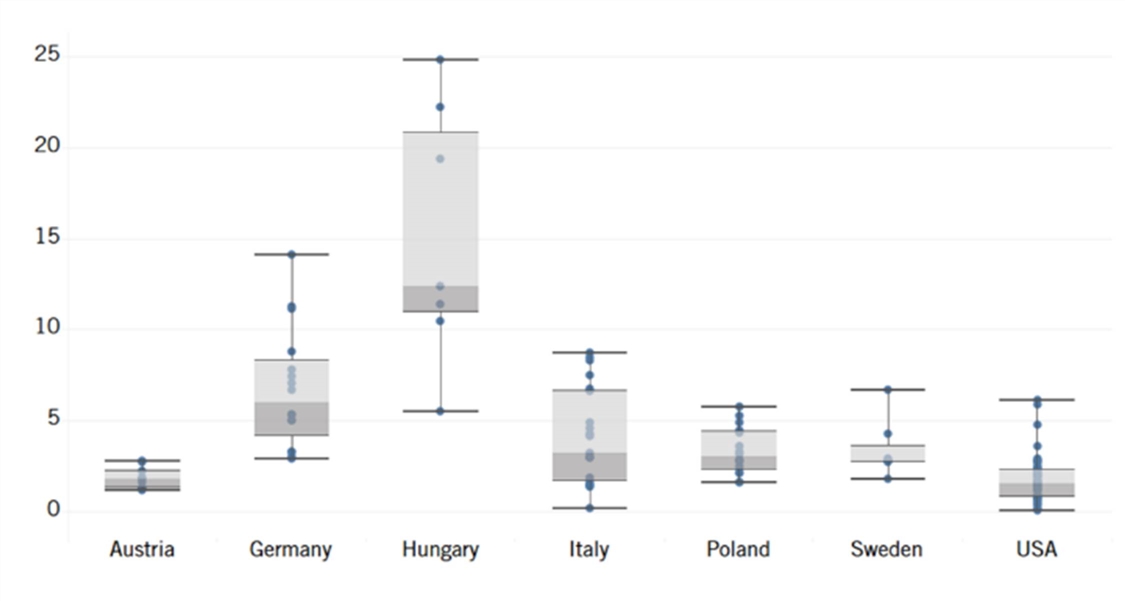
The rankings: High-tech exports in Poland showcase interesting regional disparities (see figure 11 and figure 12). Śląskie (5.7 percent) and Dolnośląskie (5.3 percent) stand out with significant percentages, indicating robust technological advancement in these regions. Other regions like Pomorskie (4.4 percent) and Wielkopolskie (4.3 percent) also demonstrate noteworthy high-tech export contributions.
Austria exhibits diverse high-tech export distribution. Central regions like Carinthia (1.6 percent) show robust potential in technology exports, while Vorarlberg (2.8 percent) and Upper Austria (2.7 percent) lead the way. Lower Austria and Vienna (1.3 percent) and Burgenland (1.2 percent) slightly lag behind in high-tech exports.
Sweden’s high-tech exports are notable for regional variations. Småland and the Islands (6.7 percent) shine as a technology-driven hub, while other regions like North Middle Sweden (4.3 percent) and West Sweden (2.9 percent) also contribute significantly, reinforcing Sweden’s reputation for innovation.
Hungary displays a diverse landscape in high-tech exports. Regions like Central Transdanubia (24.8 percent) and Western Transdanubia (22.2 percent) excel, suggesting a remarkable presence in technology-driven supply chains. Northern Hungary (19.3 percent) also contributes substantially to Hungary’s technological exports.
Italy’s high-tech exports vary across regions. Emilia-Romagna (8.7 percent) and Piedmont (8.3 percent) stand out, demonstrating advanced technological capabilities. On the other hand, Calabria (0.2 percent) and Molise (1.3 percent) exhibit lower percentages, indicating the need for technological development in these regions.
Germany showcases solid high-tech exports, with regions like Baden-Württemberg (14.1 percent) and Bavaria (11.2 percent) leading the way. Eastern regions like Berlin and Brandenburg (3.3 percent) contribute slightly less, reflecting Germany’s imbalanced trade levels.
The United States demonstrates a wide range of high-tech export levels among its states. States such as Oregon (5.8 percent) excel due to their technology-driven sectors. However, there are variations, with states like Alaska (0.1 percent) and Wyoming (0.3 percent) indicating room for technological expansion. Wyoming’s very weak performance on this indicator reinforces the point that its high performance on the prior manufacturing labor productivity indicator is highly distorted by its energy sector.
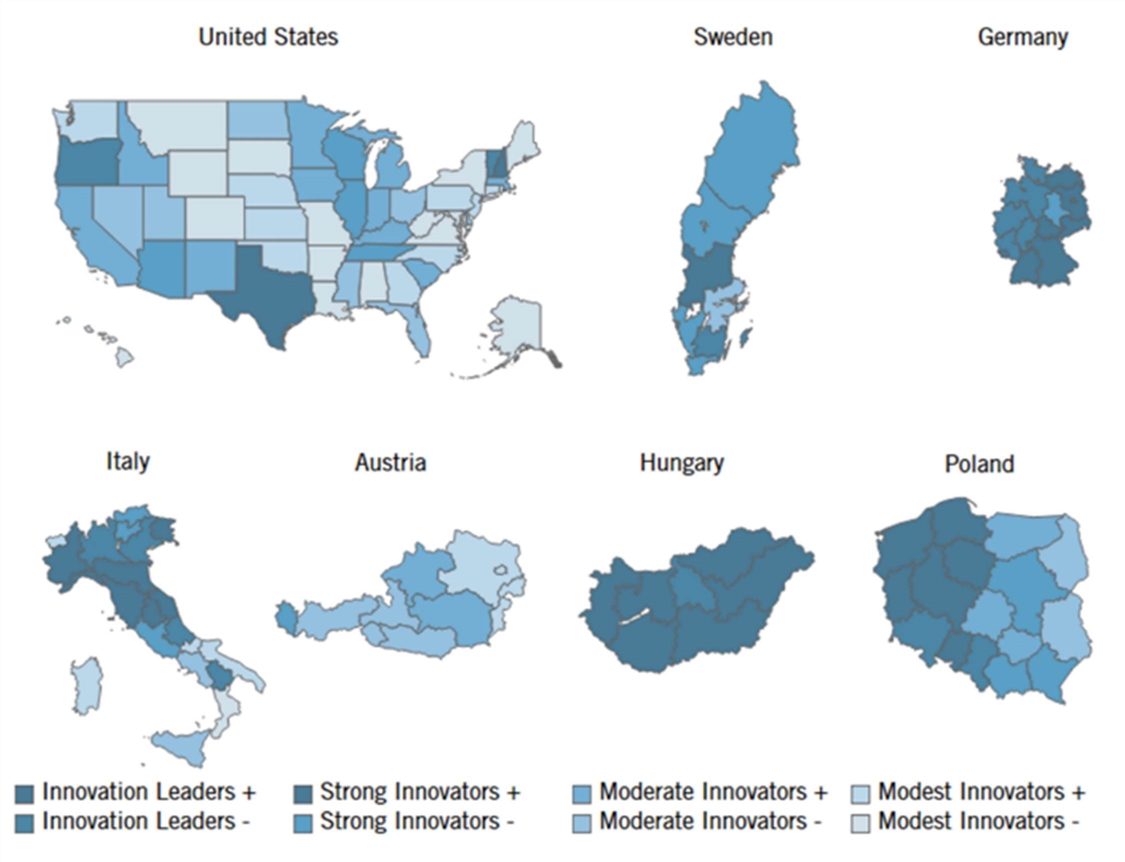
Figure 12: Performance map in high-tech exports indicator[30]
Inward FDI
Why is this important? This indicator measures the inward FDI a region receives relative to its GDP measured as the funds an entity in the region receives from a foreign-based entity to purchase, establish, or expand enterprises. Inward FDI not only spurs domestic economic activity but also facilitates technology transfer between foreign-owned enterprises and local establishments. Foreign owners can also introduce domestic firms to new international markets and help regions carve out positions in global supply chains. Inward FDI has also been associated with greater economic growth in market economies and tends to be more productive and induce greater levels of investment by domestic firms.[31]
Because FDI can be very volatile from year to year, regions’ averages over the period of three years are considered. Measures for each country required varying degrees of estimation, with the methods described in the appendix.
Figure 13: Inward foreign direct investment as a percentage of GDP, 2017–2018 (average)[32]
The rankings: Poland’s regions exhibit varying degrees of FDI attractiveness (see figure 13 and figure 14). Opolskie (3.6 percent) and Śląskie (3.2 percent) lead the way in terms of FDI inflow, showcasing their appeal to foreign investors. Other regions, such as Małopolskie (2.4 percent) and Warmińsko-Mazurskie (2.7 percent), also demonstrate positive FDI trends.
Austria’s FDI trends show exhibit more limited outcomes, with several regions experiencing negative FDI inflow percentages. Notably, Lower Austria and Vienna (minus 0.5 percent) and Tyrol (minus 0.4 percent) indicate potential challenges in attracting foreign investment.
Sweden’s regions generally exhibit positive FDI inflow trends. Småland and the Islands (2.5 percent) and South Sweden (2.7 percent) showcase their attractiveness to foreign investors. The Greater Metropolitan Region (2.3 percent) and West Sweden (2.5 percent) also contribute to Sweden’s positive FDI landscape.
Hungary showcases a diverse FDI picture across its regions. Central Transdanubia (8.8 percent) and Northern Hungary (7.4 percent) stand out as highly attractive regions for foreign investors because of their highly educated workforce, well-established infrastructure, and open economy. Automotive, electronics, and food industries are dominant in FDI, but plentiful jobs could be linked to high-value-added service sector investments.[33] However, Southern Transdanubia (3 percent) and Southern Great Plain (3 percent) exhibit more modest FDI inflows.
Italy’s FDI landscape presents a range of performances across its regions. Lombardy (2.5 percent) leads the way, reflecting its economic significance. Emilia-Romagna (1 percent) and Lazio (1.1 percent) also demonstrate positive FDI inflow, while regions like Calabria (0.1 percent) and Basilicata (0.1 percent) indicate relatively lower foreign investment.
Germany showcases a diverse FDI landscape as well. Hesse (1.9 percent) along with Hamburg and Schleswig-Holstein (1.3 percent) demonstrate higher FDI inflows, reflecting their economic strength. North Rhine-Westphalia (0.8 percent) and Berlin and Brandenburg (0.5 percent) also contribute to Germany’s positive FDI environment.
The United States, being a major global player, exhibits diverse FDI trends across its states. States like Maine (3.3 percent) and Missouri (3.2 percent) indicate their attractiveness to foreign investors. However, some states like Montana (0.2 percent) and Iowa (0.2 percent) show significantly less FDI inflow.
Figure 14: Performance map in inward FDI indicator[34]
Innovation Capacity
Broadband Adoption
Why is this important? This indicator measures broadband adoption—that is, the share of households within each region that subscribe to a broadband Internet connection, either mobile or fixed.[35] (All measures of broadband adoption used include satellite adoption as well). The Internet is now essential to full participation in today’s increasingly digitalized global economy. The COVID-19 pandemic vividly demonstrated how crucial widespread Internet adoption is for societies, enabling telework, tele-education, telehealth, etc. Increased access to the Internet has also been associated with greater productivity and economic growth.[36]
Figure 15: Share of households that have adopted broadband Internet, 2019[37]
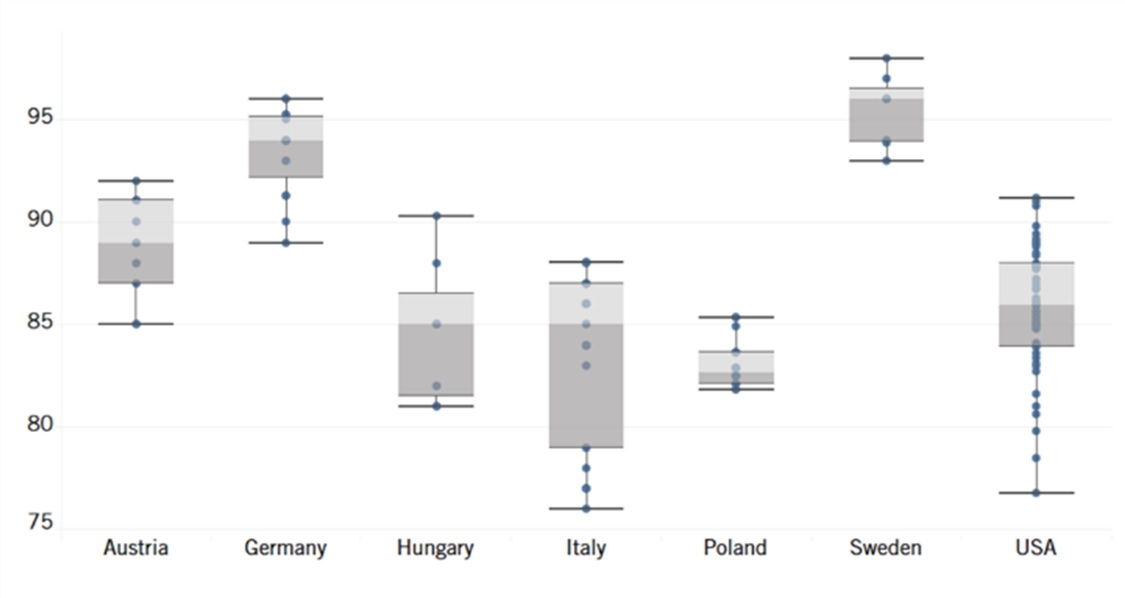
The rankings: Poland showcases a relatively high level of broadband adoption across its regions (see figure 15 and figure 16). The Greater Poland region (85.3 percent) leads the way, closely followed by Lower Silesia (85.3 percent) and Mazovia (84.9 percent). These numbers highlight Poland’s commitment to digital connectivity and the accessibility of broadband services.
Austria’s regions demonstrate a strong commitment to digital infrastructure. Vorarlberg (92 percent) and Lower Austria and Vienna (91.1 percent) stand out as leaders in broadband adoption, indicating their advanced digital connectivity and technological integration.
Sweden’s commitment to technological advancement is evident through its high broadband adoption rates. Småland and the Islands (98 percent) and Middle Norrland (97 percent) showcase the country’s emphasis on providing widespread broadband access.
Hungary’s broadband adoption varies across its regions. Central Hungary (90.3 percent) leads the way, highlighting its focus on digital connectivity. However, regions like Southern Great Plain (81 percent) and Northern Hungary (81 percent) suggest a need for enhanced efforts to improve broadband access.
Italy’s regions exhibit mixed broadband adoption rates. Regions like Trentino (88 percent) and Emilia-Romagna (88 percent) lead the way, while others like Sicily (76 percent) and Apulia (77 percent) show room for improvement in digital infrastructure.
Germany demonstrates a commitment to digital connectivity, with most regions showcasing high broadband adoption rates. Hamburg and Schleswig-Holstein (96 percent) and Bremen and Lower Saxony (95.2 percent) stand out as leaders in digital integration.
The United States evinces a diverse range of broadband adoption rates across its states. Washington (91.2 percent) and California (89.8 percent) lead the way, indicating their strong digital infrastructure. States like Mississippi (76.8 percent) and Louisiana (80.6 percent) show room for considerable improvement in broadband adoption.
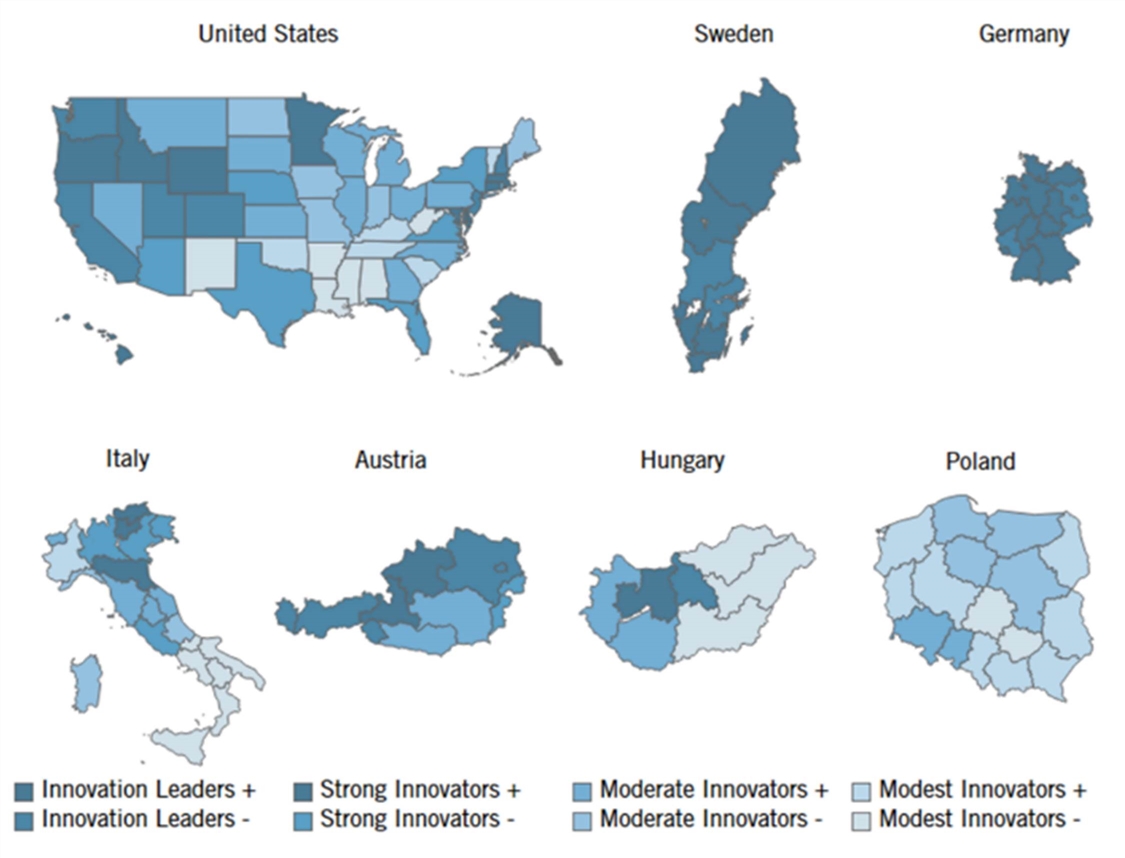
Figure 16: Performance map in broadband adoption indicator[38]
R&D Intensity
Why is this important? This indicator measures R&D expenditures in a region relative to its GDP considering R&D expenditures by all sectors: business, government, and higher education. R&D lies at the heart of innovation, as it represents the source of the new knowledge needed to discover, design, and implement innovative technologies and products. R&D results in slightly higher private returns and much larger social returns than other types of investment as new knowledge and technology spill over to the rest of an economy.[39]
Figure 17: R&D expenditures as a share of GDP, 2019[40]
The rankings: Poland’s regions display varying levels of R&D intensity (see figure 17 and figure 18). Małopolskie (2.2 percent) and Pomorskie (1.7 percent) lead in prioritizing research and innovation, while Łódzkie (0.5 percent) and Świętokrzyskie (0.5 percent) have lower R&D intensity, suggesting potential areas for increased focus on research-driven growth.
Austria showcases a commitment to R&D across most regions. Styria (4.9 percent) and Upper Austria (3.5 percent) lead the way, indicating a strong innovation culture and investments in technological advancements.
Sweden’s regions emphasize R&D activities, with West Sweden (4.8 percent) and Greater Metropolitan Region (3.6 percent) standing out. However, regions like Middle Norrland (0.8 percent) and North Middle Sweden (1.2 percent) exhibit areas for improvement.
Hungary’s regions demonstrate varying degrees of R&D intensity. Central Hungary (1.87 percent) and Central Transdanubia (1.34 percent) lead in research focus, while regions like Southern Transdanubia (0.7 percent) and Northern Hungary (0.6 percent) exhibit lower emphasis on research activities.
Italy’s regions reflect a diverse approach to R&D. Piedmont (2.3 percent) and Emilia-Romagna (2.1 percent) lead Italian states in R&D intensity, while regions like Aosta Valley (0.5 percent) and Calabria (0.6 percent) have room for improvement in boosting their research activities.
Germany emphasizes R&D across its regions. Baden-Württemberg (5.8 percent) and Bavaria (3.4 percent), in particular, lead in R&D Intensity, underscoring their innovative economies.
The United States exhibits varied R&D intensity across its states. New Mexico (7.5 percent) and Massachusetts (6.6 percent) lead in R&D intensity, reflecting the strong presence of national laboratories and leading research universities in their states, while states like Louisiana (0.6 percent) and South Dakota (0.6 percent) have a comparatively lower focus on research activities.
Figure 18: Performance map in R&D intensity indicator[41]
R&D Personnel
Why is this important? This indicator measures the number of R&D personnel as a share of all employees in each region. R&D personnel are indispensable to conducting R&D activities and turning investments into new productivity-enhancing knowledge and technologies.
Figure 19: R&D personnel as a share of total employees, 2017–2018 (%)[42]
The rankings: Poland’s regions exhibit differing levels of R&D personnel (see figure 19 and figure 20). Małopolskie (2.4 percent) and Dolnośląskie (1.8 percent) lead in terms of human resources dedicated to R&D, while Łódzkie (0.5 percent) and Mazowieckie (0.3 percent) have lower levels, suggesting potential areas for increased investment in skilled researchers.
Austria demonstrates a commitment to R&D with high levels of personnel dedicated to this field. Styria (4.6 percent) and Lower Austria and Vienna (3.7 percent) excel in human resources for R&D, indicating a strong workforce dedicated to innovation and scientific advancements.
Sweden’s regions emphasize R&D personnel, with West Sweden (3.5 percent) and Greater Metropolitan Region (3 percent) leading the way. However, regions like Middle Norrland (1 percent) and North Middle Sweden (1.1 percent) exhibit room for improvement in human resources allocated to research activities.
Hungary’s regions display differing levels of R&D personnel. Central Hungary (2.6 percent) and Southern Great Plain (1.4 percent) allocate significant human resources to research, while regions like Northern Hungary (0.6 percent) and Western Transdanubia (0.9 percent) have comparatively fewer personnel dedicated to R&D.
Italy’s regions showcase diverse approaches to R&D personnel. Emilia-Romagna (3.3 percent) and Friuli-Venezia Giulia (2.5 percent) stand out with high levels of human resources allocated to research, while regions like Aosta Valley (1.1 percent) and Calabria (1 percent) demonstrate a lesser emphasis on R&D employment.
German regions exhibit a commitment to research with substantial human resource allocation. Baden-Württemberg (3.7 percent) and Bavaria (2.5 percent) stand at the forefront of R&D personnel, highlighting their dedication to innovation and technological advancement.
The United States showcases varying levels of R&D personnel across its states. Washington (3.2 percent) and Massachusetts (2.6 percent) lead in human resources dedicated to research, while states such as Arkansas (0.5 percent) and Louisiana (0.5 percent) have relatively fewer personnel engaged in R&D activities.
Figure 20: Performance map in R&D personnel indicator[43]
Patent Applications
Why is this important? This indicator measures international Patent Cooperation Treaty (PCT) patent applications filed by residents or entities within a region per one million residents. Patent output measures the “inventiveness” of a population. Patents also secure private returns on investment in R&D activities, which are necessary to incentivize these activities and their socially desirable spillover effects. By considering PCT patents, this indicator focuses on internationally filed patents to mitigate differences in patent qualifications between countries’ patent offices.
Figure 21: PCT patent applications per million residents, 2015[44]
The rankings: Patent applications per capita vary across Poland’s regions, with Małopolskie (84.1) and Lubelskie (82.3) leading in terms of innovation efforts through patent filings (see figure 21 and figure 22). Lubuskie (17.1) and Warmińsko-Mazurskie (18) show lower levels of patent applications, suggesting potential areas for increased focus on innovation.
Austria’s commitment to innovation is evident in the Austrian regions’ high levels of patent applications. Vorarlberg (532.7) and Upper Austria (225.1) are standout regions in terms of patent filings, showcasing strong efforts in intellectual property (IP) creation and technological advancement.
Sweden places a significant emphasis on innovation, with Greater Metropolitan Region (449.2) and South Sweden (443.8) leading in patent applications. Middle Norrland (75.9) and Upper Norrland (122.6) have relatively lower levels, indicating opportunities for growth in IP creation.
Hungary demonstrates varying levels of innovation across its regions. Central Hungary (57.1) and Southern Great Plain (17.3) lead in patent filings, while regions like Northern Hungary (10.7) and Northern Great Plain (9.6) exhibit room for potential improvement in innovation efforts.
Italy’s regions exhibit diverse approaches to innovation. Emilia-Romagna (146.7) and Friuli-Venezia Giulia (103.7) excel in patent applications, while Molise (8.5) and Sicily (8.1) show lower levels, suggesting opportunities for an increased focus on IP creation.
Germany showcases a strong commitment to innovation across its regions. Baden-Württemberg (406.1) and Bavaria (398.3) lead in patent applications, underscoring their dedication to technological advancement and IP creation.
The United States demonstrates varying levels of patenting per capita across its states. Massachusetts (502.4) and California (379.9) perform outstandingly in patent applications, while states such as Mississippi (20) and Alaska (12.2) have comparatively fewer patent filings, highlighting areas with potential for growth in IP development.
Figure 22: Performance map in patent applications indicator[45]
Business Creation
Why is this important? A thriving business ecosystem should experience a high volume of business start-ups. This indicator measures the share of a region’s business enterprises that were established in the past year. The business creation indicator is limited in scope to new businesses, without capturing business turnover resulting from the market disruption and creative destruction that forces incumbents to innovate or leave the market. Thus, the full impact of business competition on innovation is not captured. Moreover, this metric does not differentiate between industries, so there is no differentiation between creation rates in advanced, innovative industries and those in less advanced industries. Absent a better alternative at the cross-national regional level, this indicator reflects a region’s overall economic resilience and regional competitiveness.
Figure 23: Economy-wide enterprise birth rate, 2016–2018 (%)[46]
The rankings: Business creation rates are quite diverse across Polish regions, with Zachodniopomorskie (12.5 percent) and Dolnośląskie (12.4 percent) leading in fostering new businesses (see figure 23 and figure 24). Lubelskie (11.6 percent) and Silesia (11.5 percent) show relatively lower rates, suggesting potential for increased entrepreneurial efforts.
Austria demonstrates a balanced entrepreneurial environment, with all regions having moderate business creation rates. Burgenland (7.9 percent) and Lower Austria and Vienna (9 percent) have relatively higher rates, indicating favorable conditions for startups.
Sweden showcases a diverse entrepreneurial landscape. Greater Metropolitan Region (8.1 percent) leads in business creation, while North Middle Sweden (4.5 percent) and Middle Norrland (4.3 percent) have lower rates, suggesting room for growth in start-up activities.
Hungary exhibits consistent entrepreneurial efforts across its regions. Central Hungary (12.6 percent) and Central Transdanubia (12.4 percent) stand out, showing a strong commitment to new business ventures.
Italy’s regions show varying levels of business creation. Molise (11.8 percent) and Calabria (11.3 percent) demonstrate higher rates, while Lombardy (7.7 percent) and Trentino (7 percent) have comparatively lower rates, indicating diverse entrepreneurial ecosystems.
Germany’s regions exhibit balanced entrepreneurial activities. Berlin and Brandenburg (9 percent) and North Rhine-Westphalia (8.6 percent) lead, highlighting their vibrant startup ecosystems, while Saxony (6.1 percent) and Thuringia (5.2 percent) show potential for further development.
The United States displays diverse entrepreneurial dynamics. Nevada (13.1 percent) and Florida (12.5 percent) score outstandingly in business creation, showcasing their entrepreneurial appeal, while Iowa (7.2 percent) and West Virginia (7 percent) have comparatively lower rates, indicating scope for growth in startups.
Figure 24: Performance map in business creation indicator[47]
Carbon Efficiency
Why is this important? As the world endeavors to combat climate change, decarbonization is of paramount importance. Regions’ abilities to innovate sustainably to achieve a reduction in and the efficient use of carbon and other greenhouse gases will determine their long-term competitiveness, as well as their national economic prosperity. This indicator measures carbon dioxide (CO2) and other greenhouse gas efficiency per unit of output (as measured by PPP-adjusted GDP). It is noted that more-developed regions may have a slight advantage in this indicator due to their more service-oriented economies. As policymakers look to improve efficiency and reduce overall emissions, they will take their lead from those regions that are devising new solutions and innovative technologies.
Figure 25: Metric tons of greenhouse gas (measured in CO2 equivalents) emitted per $10,000 of PPP-adjusted GDP, 2018[48]
The rankings: Poland’s regions exhibit contrasting levels of carbon efficiency, with some regions like Łódzkie (7.3) and Świętokrzyskie (7.4) showcasing significant carbon emissions (see figure 25 and figure 26). This indicates a need for commitment to sustainable development across various parts of the country.
Austria demonstrates a consistent approach to carbon efficiency across its regions. Regions like Vorarlberg (0.8) and Salzburg (1.1) lead in carbon efficiency, displaying a national commitment to environmental responsibility.
Sweden showcases an emphasis on carbon efficiency across its regions. However, Småland and the Islands (2.4) and West Sweden (4.9) are slightly behind in carbon efficiency despite a nationwide commitment to sustainable practices.
Hungary displays diverse carbon efficiency levels across its regions. Regions such as Central Transdanubia (3.5) and Northern Hungary (4.7) could focus more on reducing their carbon footprints to achieve better carbon efficiency, as it appears that regions such as Central Hungary (1) and Northern Great Plain (1.5) have achieved.
Italy demonstrates a range of carbon efficiency levels. Regions like Lombardy (1.1) and Lazio (1.1) display commendable carbon efficiency efforts, highlighting a nationwide pursuit of sustainable development.
Germany showcases varying carbon efficiency across its regions. Regions like Berlin and Brandenburg (3.1) and Saxony-Anhalt (3.9) are behind in carbon efficiency despite a concerted nationwide effort toward sustainability.
The United States presents a diverse range of carbon efficiency levels across its states. While states like Massachusetts (1.2) and New York (1.2) demonstrate strong carbon efficiency, states such as North Dakota (15.6) and Wyoming (23.5) face much greater challenges in reducing their carbon footprint than regions in Europe (although this of course again reflects to some degree those states’ very large energy sectors).
Figure 26: Performance map in carbon efficiency indicator[49]
Venture Capital
Why is this important? This indicator examines a region’s total venture capital investment (measured as VC-receiving firms) relative to the size of its GDP. VC represents a form of business financing wherein investors provide funds to early-stage companies in exchange for equity in their firms. Given the considerable uncertainty regarding start-ups’ success potential, VC investment assumes higher risks than other forms of investment. Accordingly, VC investment is often intended for companies with real or perceived high-growth potential, often associated with their innovative technology use or business model design. A region’s receipt of VC investment reflects both the innovativeness of its start-up ecosystem as well as the commitment of its firms to lead in crucial technologies such as AI, biotechnology, clean energy, advanced manufacturing, and robotics. Due to the volatility of VC investment from year to year, this report considers regions’ average scores between 2017 and 2019.
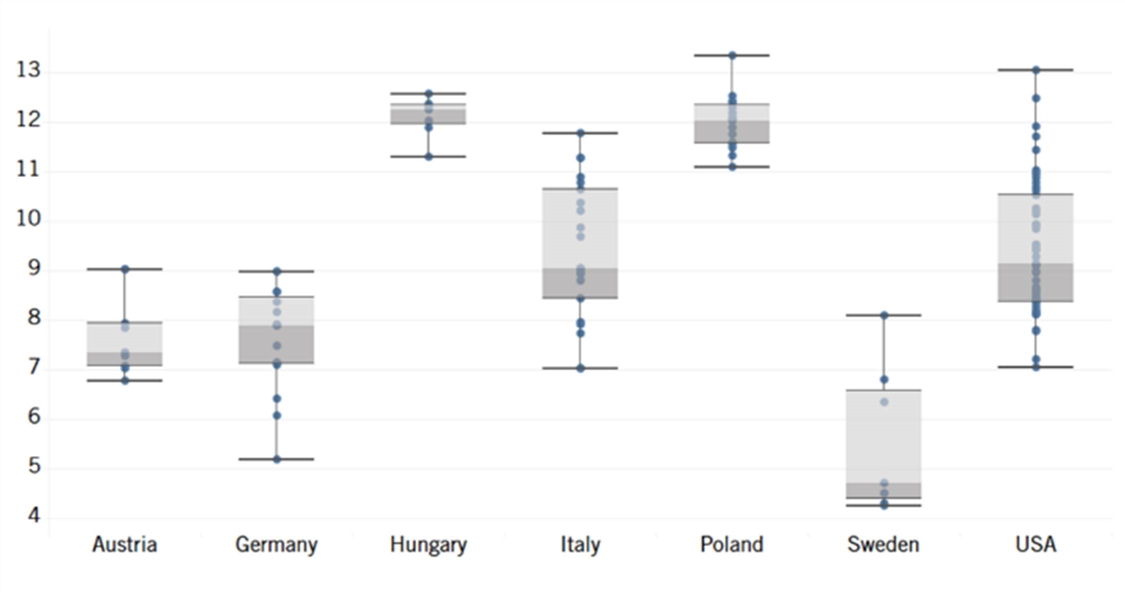
Figure 27: Venture capital investment received as a percentage of GDP, 2017–2019 (average)[50]
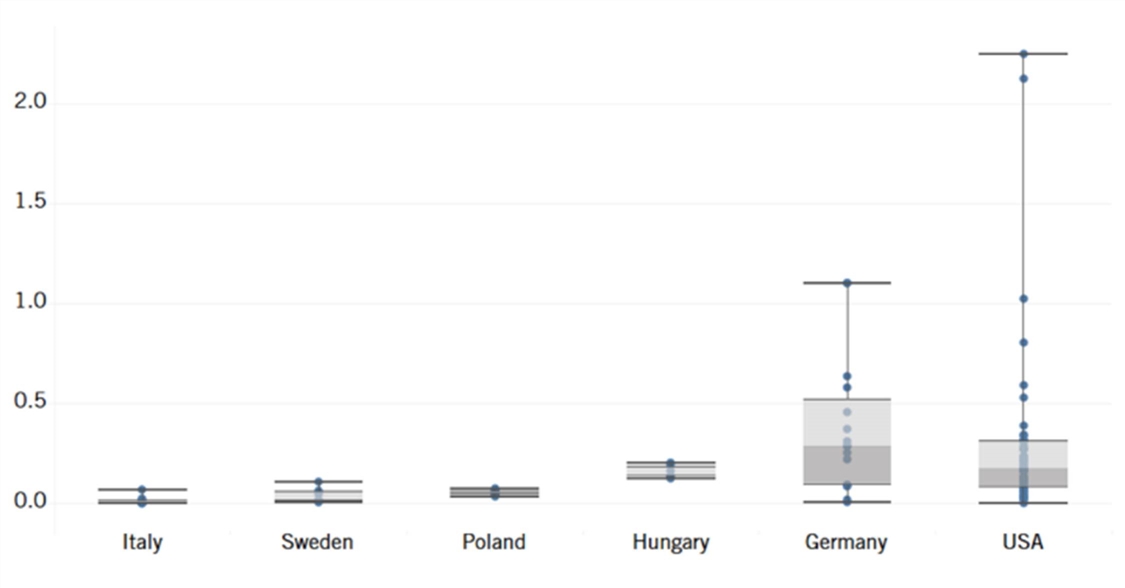
The rankings: Dolnośląskie (0.07 percent) and Opolskie (0.07 percent) are among the regions with notable venture capital influx in Poland, indicating an emerging entrepreneurial landscape (see figure 27 and figure 28). Meanwhile, regions like Świętokrzyskie (0.04 percent) and Małopolskie (0.05 percent) lag on this indicator.
Sweden boasts significant venture capital activity in certain regions. Greater Metropolitan Region (0.11 percent) and South Sweden (0.06 percent) stand out as hubs for attracting venture funding and fostering innovation and start-ups. On the other hand, Småland and the Islands (0.01 percent) lag among Swedish regions at IP. Overall, it’s surprising that Swedish regions so substantially lag German ones in VC investment, but as the policy recommendations section subsequently explains, difficulty in attracting VC investment is one of the weakest aspects of Sweden’s otherwise robust innovation economy.
Hungary showcases active participation in the venture capital ecosystem. Central Hungary (0.20 percent) and Northern Hungary (0.19 percent) demonstrate a thriving entrepreneurial environment. Regions like Southern Transdanubia (0.13 percent) and Northern Great Plain (0.13 percent) also contribute substantially to Hungary’s venture capital landscape.
Italy presents a mixed landscape for venture capital attraction. Regions like Lombardy (0.07 percent) and Piedmont (0.02 percent) showcase notable venture capital activities, fostering innovation and growth. However, some regions like Abruzzo, Aosta Valley, and Molise have yet to tap into the full potential of venture capital. But overall Italy lags behind both Germany and Hungary on this important indicator.
Germany demonstrates varying degrees of venture capital engagement across its regions. Berlin and Brandenburg (1.1 percent) emerge as significant hubs for start-ups and innovative ventures, while regions like Mecklenburg-Vorpommern (0.5804 percent) and Hesse (0.64 percent) also show substantial venture capital activities.
The United States showcases a robust venture capital landscape. States like Massachusetts (2.13 percent) and California (2.25 percent) lead the nation in attracting venture funding, reflecting their status as global tech and innovation hubs. Other regions like New York (1.03 percent) and Utah (0.8 percent) also display considerable venture capital activities. West Virginia (0.00 percent) and Mississippi (0.02 percent) demonstrate comparatively much lower scores in received venture capital.
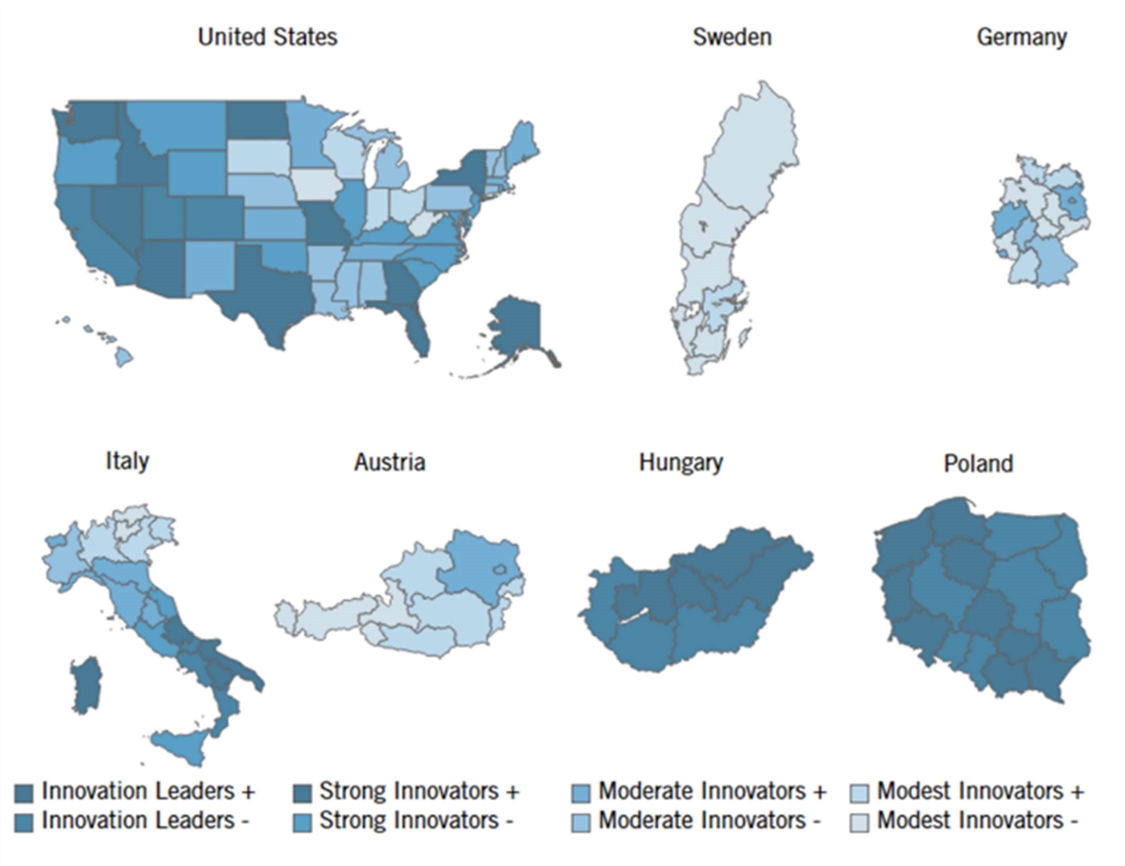
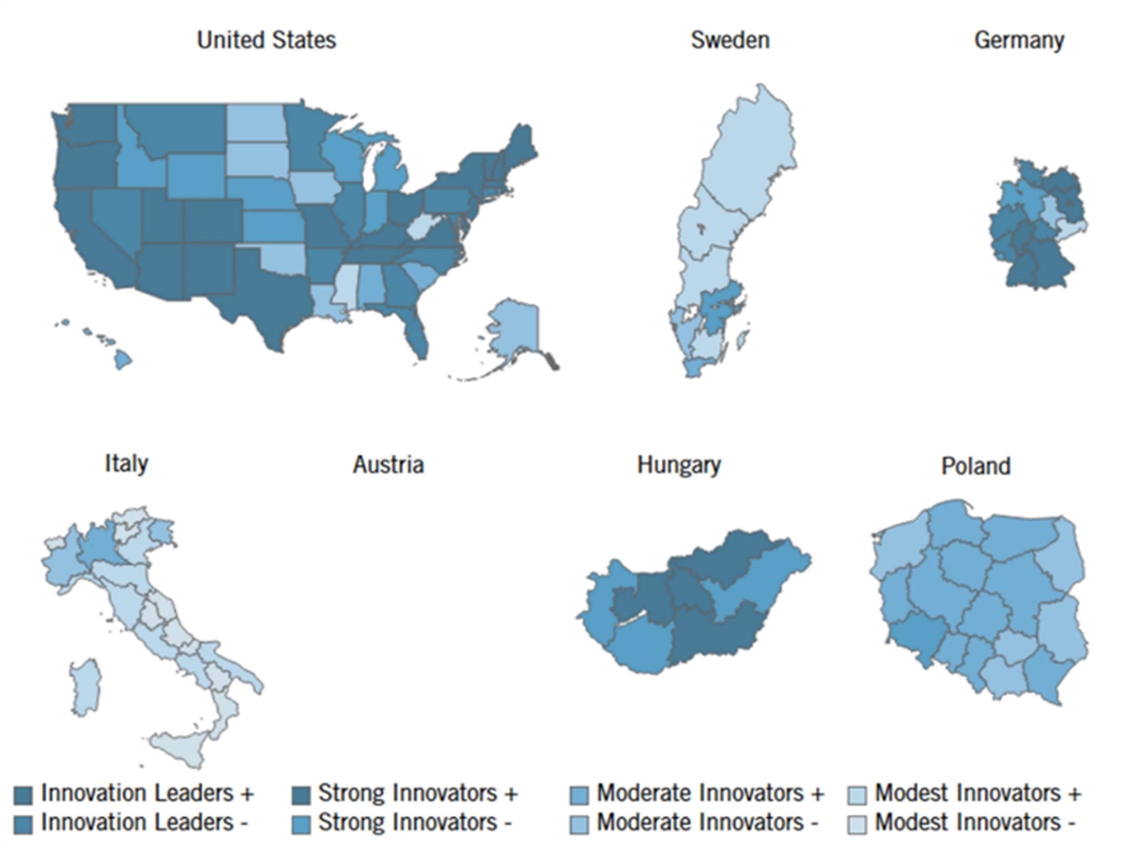
Figure 28: Performance map in venture capital indicator[51]
Policy Recommendations
This section proposes policy actions to boost innovation competitiveness in the regions and states of Austria, Germany, Hungary, Italy, Poland, Sweden, and the United States.
Austria
Knowledge Economy
Austria, like Germany, is grappling with the challenges of decarbonization, digitization, and an aging population. The country’s education system emphasizes STEM subjects, but there is room for improvement in both infrastructure and teaching skills. To enhance computer literacy and information-related competencies, Austrian policymakers must enable more investment in digital infrastructure in schools and universities. As part of this, teachers’ proficiency in using digital tools should be expanded, and the subject of computer science should be integrated more extensively into the curriculum. The government should minimize regulation to allow educational institutions to innovate and tailor their curriculums to market needs. Austria can also streamline its immigration procedures for skilled workers, particularly in STEM areas, to boost innovation and productivity. Enhancing the attractiveness of the job market and simplifying administrative processes are key.
Globalization
Austria’s economy is heavily integrated with the EU’s, and its high-tech exports are competitive. However, the government can apply some specific strategies to improve performance. Austria should reduce trade barriers and regulations, allowing businesses, especially SMEs, to compete and innovate without hindrance. Austria should further align with EU policies that encourage technological innovation and trade competitiveness. Policymakers should consider boosting growth in less-developed regions of Austria, taking advantage of technological spillover effects. Austria should also pursue policies to attract more technological FDI, particularly in emerging sectors, to stimulate innovation and economic growth. The government could create a more attractive environment for foreign investment by minimizing regulations and taxes.
Innovation Capacity
Austria’s innovation landscape is rich but requires targeted policies to maintain momentum. The government should increase investment in universities and research institutions, with a focus on facilitating knowledge transfer to industry. The key is to create a friendly environment for private investment by reducing regulations and taxes on businesses and research institutions. Austria can realize its commitment to a greener future by promoting innovation in energy efficiency, renewable energy, and sustainable mobility. The government should minimize subsidies and regulations, allowing businesses to innovate and compete freely. Investing in AI technologies and digital infrastructure is crucial for Austria to remain competitive. Policies should encourage the private sector to invest in these areas. The key is for the government to reduce entry barriers and allow competition. Young and small companies in Austria often face financial challenges. Knowledge clusters and support for entrepreneurs require a more innovation-friendly environment. Less regulation and protection would be a consequential first step in this direction.
Germany
Knowledge Economy
Companies in Germany are facing the major challenges of decarbonization, demographics, and digitization. In surveys, companies want the government to invest more in digitization and education, especially in computer science and other STEM subjects, to strengthen innovation in Germany.
In relation to STEM education, it’s important to improve opportunities in the education system. This includes the expansion of all-day facilities at daycare centers and schools, the expansion of language support programs, and an increase in the quality of all-day facilities through family centers. Furthermore, additional multi-professional staff should be financed through a social index to reduce inequality of opportunity. Targeted support programs can help close COVID-related learning gaps with the help of targeted support programs. Second, Germany needs to advance the digitalization of educational institutions. Existing gaps in the digital infrastructure should be closed, with 20,000 additional information technology (IT) positions created in schools for administrative tasks. Germany plans the integration of IT-related education into teacher training, furthering training offers for digital learning formats, and the development of digitally supported teaching materials in the STEM field. Third, Germany must strengthen STEM education. The aim is to anchor digital media education in preschool and to introduce computer science as a subject from primary school onwards. To secure skilled workers, Germany must train teachers better, and lateral entrants must be qualified in the STEM field. It is essential to develop measures along the entire education chain and strengthen extracurricular offers. Bottlenecks in the German STEM sector alone would be 386,000 individuals higher without the employment successes of immigrants.
Regarding utilizing the potential of women, older citizens, and immigrants, it is first necessary to promote women. This is about a prejudice-free career and study-orientation for STEM professions, communicating the importance of STEM professions as climate-protection professions, and strengthening the STEM strengths of girls through better feedback systems. Germany should expand mentoring programs and networks. Second, German companies should meet the further training needs of employed STEM experts. Companies affected by digitalization should invest more in continuing education. Universities should expand in-service training opportunities, and legislators should be called upon to improve the framework conditions for later retirement. Third, to maximize the potential of the immigrant community to contribute to the German economy and society, immigrants should be attracted by optimizing bureaucratic processes and targeted recruitment efforts abroad.[52]
Bottlenecks in the German STEM sector alone would be 386,000 individuals higher without the employment successes of immigrants.
In research, according to evaluations of the IW (German Economic Institute) patent database, there has been a sharp rise in the share of inventors with foreign roots in all patent applications from Germany. To attract more highly qualified specialists for innovation and transformation from abroad, policymakers should significantly increase capacities for immigration via universities and funds for accompanying international students at German universities.
Globalization
Germany performs well in high-tech exports. Nevertheless, the high export ratio and strong presence of technology highlights the innovativeness of German trade, which has also been affected by the industrial policy of Germany, In particular, this refers to the “Industrie 4.0” strategy that supports businesses to accelerate technology adoption for competitiveness in domestic and international markets. Government-industry partnerships are fostering progress toward innovation and productivity growth in engineering and manufacturing especially.
Policies in line with the Industrie 4.0 strategy should provide effective technology adoption approaches for the German economy. German policymakers should further develop the initiatives and optimize specific policies for the most critical technologies and industries. Germany should consider placing a special focus on the northern and eastern regions of the country, where technology adoption and production by enterprises could boost growth (comparatively) more than in technologically more-advanced regions, especially among SMEs. (In other words, that’s where the greatest opportunity for potential improvement exists.)
Germany lags behind other countries in attracting FDI, therefore the country should consider policies that specifically incentivize technological FDI, especially in developing regions, as the spillover effects of new technology businesses may increase innovative activities in the technology ecosystem the investment is received in, which can lead to increased productivity and economic prosperity.
However, the conditions for investment in Germany are currently deteriorating due to the sharp rise in energy costs, a shortage of skilled labor, and an aging road and rail infrastructure. The currently high outflows of investment capital provide an important warning signal.[53] It is therefore important to significantly reduce energy costs for industry. A much faster expansion of renewable energies (in Germany, for example, wind) is urgently needed for this. Furthermore, there should be more investment in transport infrastructure and digitalization.
Innovation Capacity
Even though the German economy is relatively strong in research thanks to its economic structure, it faces major challenges. Digitization and decarbonization, for example, are changing firms’ business models and mean that more needs to be invested in the innovation process. To this end, Germany should increase public investment in research at universities and research institutions and should also strengthen the transfer of knowledge and technology to industry and the promotion of private-sector research activities.
Regarding the energy transition, it is important to drive it forward through innovation and to support the mobility transition in a way that is open to technology. Regarding digitization, Germany must catch up technologically, for example in AI. Likewise, Germany must increase investments in digital infrastructure. In response to the demographic challenge, the third priority is to secure skilled labor, particularly in the STEM sector, with both domestic and foreign skilled labor.
To meet major sociopolitical challenges such as decarbonization and digitization, research policy formulates missions that enable and accelerate this transformation process. The German government’s “High-Tech Strategy 2025” formulates corresponding missions and goals. The government should expand research programs for decarbonization, with the goal of non-fossil propulsion technologies broadly defined to enable technology-open solutions. Overall, Germany should more strongly promote innovations in promising fields such as AI and climate protection.
Large companies can more easily access internal and external sources of financing—such as venture capital. Government research funding can support young and smaller innovative companies that face greater financing hurdles. One instrument for this is the newly introduced research premium. Germany should increase and maintain this in the long term to create planning security and sufficient financial incentives for companies that want to steer their business models away from sporadic research activities toward continuous research. To achieve the goal of investing 3.5 percent of GDP on R&D, the research allowance provides an effective lever.
Hungary
Knowledge Economy
To establish a robust knowledge economy, Hungary should implement a multifaceted approach that focuses on education, industry collaboration, and workforce development. STEM education should be a primary focus, with increased investment in high schools and universities due to the traditionally outstanding performance of Hungarian mathematicians.[54] This includes enhancing STEM teachers’, and university faculty’s, performance-based salaries and providing funding for student competitions to incentivize excellence in STEM subjects. Linking universities with corporations can lead to practical, industry-relevant education and research opportunities. Hungary may consider extending its dual education system following successful Hungarian examples such as in the automotive industry, which combines classroom learning with hands-on industry experience to bridge the gap between academia and practical skills needed in the workforce. Hungary must continue developing the Hungarian Startup University Program by expanding the involvement of corporations and ensuring efficient mentorship to nurture entrepreneurial talent and innovative startups. Providing incentives in Hungary for workforce training and educating senior executives about innovation and technology adoption will create a culture of continuous learning and accelerated development.
Providing incentives in Hungary for workforce training and educating senior executives about innovation and technology adoption will create a culture of continuous learning and accelerated development.
Lastly, attracting international talent can infuse Hungary’s talent pool with international expertise.
Globalization
Hungary could utilize its globalized economy to achieve outstanding innovation competitiveness. Strengthening ties with the Visegrad Group countries and the Three Seas Region can amplify collective economic growth and innovation. International technology collaboration and development could be accelerated by promoting trade and establishing an international technology brand for Hungary. Hungary could facilitate the growth of startups in the United States and Western Europe by utilizing agreements such as the European single market or the EU-United States Trade and Technology Council. Hungary should cultivate international partnerships in Hungarian strategic sectors such as medical devices, biotechnology, pharmaceuticals, energy innovation, Industry 4.0, battery development, automotive technologies, and other manufacturing technologies. By diversifying trade and promoting both exports and imports with Asian markets, Hungary can balance its trade relations and reduce dependency on specific regions.
Innovation Capacity
Hungary can elevate its innovation capacity through a combination of financial incentives, streamlined funding processes, and industry-academia collaboration. Hungary should encourage venture capital investments by offering tax incentives to attract more funding for innovative projects. Hungary should ensure efficient funding mechanisms for innovation initiatives, reducing administrative burdens for subsidy approvals. Hungary might consider strengthening tax incentives for R&D activities, encouraging companies to invest in innovation. Supporting patent applications to protect intellectual property could stimulate innovation-driven entrepreneurship. By fostering collaboration between universities, corporations, and startups, Hungary could create a synergistic ecosystem that promotes knowledge exchange and innovative thinking. Strong connections between corporations, universities, SMEs, and high-tech enterprises can allow for a value-chain transition to higher value-added services and products, and the establishment of new R&D centers in Hungary.
Italy
Knowledge Economy
As the digital and environmental transition is radically transforming most of the world’s advanced economies, fostering the transition to a highly skilled and flexible workforce, a crucial goal for Italy in the coming years must be to strengthen human capital.
Policymakers should utilize coherent policies to target the upskilling and reskilling of the current workforce, as well as invest in increasing the number of graduates, which is too low compared to the main international partners, especially in the STEM disciplines. The necessary upgrade in terms of employee know-how and skills, as well as managerial competence, can come not only from an increase in the skilled workforce but also from the promotion of lifelong learning and further training courses for employees who find themselves changing jobs or working conditions late in their careers.
In addition, Italy needs more specialized information and communications technology (ICT) degrees to meet specific market demands, especially from large companies or digitized enterprises. A comprehensive and targeted use of European Union (EU) funding is of utmost importance in this respect, as it provides funding for scholarships and Ph.D. programs, as well as incentives for the creation of specialized degree courses in digital-related fields and cybersecurity.
At the same time, these changes are also reflected in the growing demand for specialized personnel not only by large companies but also by small to medium-sized enterprises (SMEs). This new development in the Italian industrial framework, previously more averse to transformation and innovation, is a key factor for the Italian labor market. In the past, and even recently, over-qualification was often observed, with a consequent mismatch between supply and demand that led to many qualified young people leaving Italy to find work opportunities in other countries. It is therefore essential to continue to promote the introduction of innovation and change in SMEs, also with support from the government and the EU. A key policy measure here could be to provide small companies with a voucher to spend on an innovation audit to assess strengths and weaknesses compared to their market peers and offer strategic advice to improve their long-term performance.
Finally, attracting immigrant knowledge workers should also be a national government priority. To this end, ad-hoc policies would be useful to feed flows of skilled workers into industrial sectors with more specialization and better growth prospects, as well as to promote Italian universities internationally to attract top students from abroad, and successively integrate them into the national labor market.
Globalization
For an industrial environment such as the Italian one, where SMEs and family-run businesses are dominant, the disruptive changes deriving from the digital era of globalization pose challenges to the overall economy and require firm policy intervention to promote accessibility to the many new opportunities resulting from this innovation. Failure to assist and accompany smaller industrial firms which, unlike the large and medium companies which are often also world-class leaders, are not equipped from the outset with the necessary innovation capacity, would risk increasing the already persistent geographical fragmentation of the country, damaging its economy and competitiveness.
To encourage the internationalization of businesses, a mix of instruments is therefore needed, aiming at providing adequate skills, tools, and capital. Italy should introduce measures to strengthen the capitalization of SMEs, as well as provide them with incentives for digitalization and the global promotion of their products. Furthermore, policymakers should promote horizontal industrial policy intervention (as well as vertical measures on the most promising value chains such as AI, clean tech, and biotech) involving the strengthening of physical and digital infrastructures, improving access to credit, developing innovative financing, attracting FDI, and encouraging business cooperation.
Innovation Capacity
Innovation plays a key role in enhancing the efficiency and productivity of businesses, as well as in ensuring their competitiveness in the contemporary international context. Therefore, the incentive to invest in tangible and intangible capital, in R&D within companies, as well as in the development and acquisition of licenses and patents cannot be neglected. Furthermore, private investment in R&D, which is still insufficient to ensure the real competitiveness of Italy’s innovative sectors, must be accompanied by an increase in public investment in basic research and technology transfer, which is currently inadequate compared with European and Organization for Economic Cooperation and Development (OECD) benchmarks.
In terms of technical progress, there is an urgent need to strengthen the spread of ICT technologies in the economy. Italian policymakers should foster and incentivize the adoption of technologies such as cloud computing, data analysis and AI, enterprise resource planning (ERP) solutions, customer relationship management (CRM) systems, and e-commerce platforms. Many companies, especially the smaller and family-owned ones, which are by far the most widespread in Italy, need support and incentives to overcome the challenges posed by the digital transition, and to prevent the regional gap from widening further. Here, too, policymakers have already launched ad hoc measures as part of the National Recovery and Resilience Program (NRRP), the extraordinary instrument activated by the European Union to support economic recovery after the COVID-19 pandemic, but due to the inflationary crisis and rising costs, the government will probably need to provide further investments.
Poland
Knowledge Economy
Poland ranks relatively poorly, with the best region ranked 100th. In this area, the main culprits are poor labor productivity, where the best-performing Polish regions show similar performance as the bottom of the productivity distribution of the United States. Similarly, the level of skilled migration is low. On the other hand, the share of the highly educated population and high-skill employment are similar to those of the U.S. average. Therefore, the performance of Polish regions can be supported by policies that boost manufacturing labor productivity and skilled migration. Policies that encourage investment of physical capital and encourage innovation should be strengthened, as both the investment rates and R&D spending are low in Polish regions. On the other hand, a long-term migration policy should address the demographic challenges that Polish regions face.
Globalization
Several Polish regions score very high in the globalization ranking. This is due mainly to their export orientation, especially in high-tech industries. At the same time, Poland relies strongly on FDI, with a persistent net inflow for over three decades. These two are strongly connected; that is, the central location of Poland, the good connection of the Western regions to the rest of Europe, and the inflow of FDI have contributed to the Polish export orientation. However, the role of Poland in production chains will have to change with the gradual erosion of price-cost competitiveness that is due to the persistent growth in wages that is not necessarily reflected in productivity growth.
Innovation Capacity
Polish regions are very diversified in their innovation capacity, but overall innovation capacity is certainly lower than average. The main culprits for such results are relatively low scores for R&D activity and R&D personnel, a low number of patent applications, and relatively low scores for venture capital received. On the other hand, broadband adoption and carbon efficiency do not stand out significantly. However, these results are in line with other studies relating to the innovation performance of the Polish economy: the economy is oriented mainly toward participation in global value chains where it is primarily supplying intermediate goods requiring little innovation effort while relying on price-cost competitiveness. This translates to low R&D expenditures and patent activity. At the same time, despite the presence of several large academic units in the analyzed regions, the degree of cooperation between academia and industry is very low.
Sweden
Knowledge Economy
The discussion on Sweden’s knowledge economy comprises three key aspects: 1) The Swedish Research Bill 2021-2024; 2) The shortage of STEM-educated individuals; and 3) Sweden’s green industrial revolution in the northern region and the accompanying skills gap.
The foremost question for the leading knowledge-intensive regions in Sweden is how to generate value through the transition to an environmentally, socially, and economically sustainable world. This question holds paramount importance in the pursuit of sustainable growth.
The Swedish Government’s research policy bill, titled “Research, Freedom, the Future – Knowledge and Innovation for Sweden, 2021-2024,” centers around five overarching societal challenges: climate and environment, health and welfare, digitization, skills supply and working life, and a democratic and resilient society.[55] The bill also entails increased funding for higher education institutions and research infrastructures.
Despite having a highly educated population overall, Sweden faces a growing knowledge gap in digital and STEM skills. This shortage not only has immediate employment implications but also raises concerns about long-term economic growth. To bridge this gap and bolster PTS employment in Sweden, policymakers must prioritize investments in digital and STEM training and development. Of particular concern is the lack of interest among Swedish youth in pursuing STEM fields to meet the labor market’s demands.
Sweden’s northern region is currently witnessing a green industrial revolution, characterized by the emergence of large battery factories, fossil-free steel production, and carbon-neutral data centers. This significant shift is projected to double electricity demand by 2045. To support this transformation, it’s crucial to invest in renewable energy sources, storage systems, and transmission infrastructure, notwithstanding the region’s existing abundance of clean energy sources. Moreover, addressing the skills gap necessitates attracting talent from both within Sweden and internationally to meet the mounting workforce demands in the industrial and public service sectors. Additionally, substantial regional disparities in the availability of highly skilled labor and knowledge-intensive business services within Sweden contribute to a mismatch between skills supply and demand.
Globalization
When considering Sweden’s globalization two aspects are central: 1) Swedish exports and foreign-owned companies; and 2) private sector R&D and ties to globalization.
Sweden’s strong export-oriented economy, driven by industries such as machinery, automobiles, telecommunications equipment, pharmaceuticals, and forestry products, has faced challenges due to the COVID-19 pandemic. However, the country’s diversified export base and adaptive capabilities have helped mitigate the impact. Nonetheless, the geopolitical landscape poses risks, including protectionism.
In the private sector, Sweden has over 3 million employed individuals, with over 700,000 working in foreign-owned companies. The number of foreign-owned companies in the country is nearly 16,000. Norway controls the highest number of companies in Sweden, followed by the United Kingdom and the United States.[56] Germany has been the most-active country in acquiring Swedish companies since 2010 and has the highest number of employees among foreign countries.
Investment in R&D by major Swedish-owned international groups reached SEK 93 billion in 2019 ($8.7 billion), a 12 percent increase from 2017. The number of full-time equivalents (FTEs) engaged was around 60,000, an increase of just under 2 percent compared to 2017.[57] This indicates that Sweden is capable of more high-value-added R&D, focusing more on breakthrough research than incremental development. Over time, Swedish companies have allocated a larger proportion of their R&D efforts to their staff abroad, while investments in Sweden have remained relatively stable. R&D intensity in Swedish-owned groups is twice as high in Sweden as compared to abroad. Meanwhile, R&D intensity in low- and middle-income countries has more than doubled in the past 12 years.
Enterprises choose to locate R&D in Sweden primarily for access to R&D labor and knowledge centers. However, the importance of these factors has decreased over time, with low- and middle-income countries receiving a growing percentage of corporate R&D investments.
Considering the level of interplay between higher education and research policy, innovation policy, and trade policy, Sweden should recognize the interconnectedness of these areas and direct strengthening activities to the intersections. It is crucial to understand how producers of global value-added activities associated with Sweden perceive the country’s value proposition. Sweden needs to strengthen the global positioning of its key export industries, while internally strengthening capabilities in the areas mentioned to further growth prospects in key export industries, which can also drive FDI.
Innovation Capacity
The topic of Sweden’s innovation economy centers on three themes: 1) the lack of VC investment; 2) initiatives supporting innovation; and 3) the long-term development of R&D investments.
Sweden is one of the leading innovation powerhouses in the world, at the forefront of decarbonization, with a solid IT infrastructure and a highly educated population. To tap into the potential of breakthrough technologies, drive innovation, and establish itself as a global leader in science-based and society-changing companies, Sweden needs to address its lack of VC. VC investment in Swedish regions is low across the board, reflecting a gap in funding opportunities for startups and emerging companies. Closing the funding gap and fostering a supportive ecosystem for startups would not only contribute to economic growth but also enhance the country’s ability to leverage research and bridge the gap between academia and industry.
A collaborative approach, fostering shared learning and concerted efforts among academia, business, and society, is pivotal as Sweden tackles present and future societal challenges.
A notable initiative in this regard is the joint program called Impact Innovation, launched by the Swedish Energy Agency, the Swedish Research Council for Sustainable Development (Formas), and the Swedish Agency for Innovation Systems (Vinnova).[58] This actor-driven, long-term collaboration aims to enhance global competitiveness through transformative actions for sustainable development. The program is oriented toward ambitious transition goals, to be solved by quadruple helix constellations, through methods involving advanced, cutting-edge research and innovation.
On a national level, R&D expenditure as a share of GDP has been stable at over 3 percent since 2007.[59] However, there is cause for concern about the future of R&D investments in Sweden, because while the Swedish industrial landscape is becoming increasingly service-oriented and knowledge-intensive, these service suppliers are not R&D intensive.[60] Considering the shifting landscape, a better understanding of possible reasons for the decrease in R&D intensity is needed to enable targeted efforts to strengthen R&D.
United States
Knowledge Economy
To bolster the United States’ innovation ecosystem and global competitiveness, a comprehensive policy approach is recommended. Firstly, the U.S. government must direct a substantial increase in funding for R&D toward universities, research institutions, and private sectors. Concurrently, a renewed emphasis on STEM education at all levels is imperative to cultivate a proficient and adaptable workforce. Introducing immersive technologies into classrooms has the potential to make the U.S. education system more effective, but before these technologies are deployed in schools, the federal government should increase R&D investments in key areas that need further research.[61] Additionally, the United States should streamline the immigration process for STEM professionals through the implementation of fast-track visas, green cards, and accessible pathways to permanent residency and citizenship. To ensure a resilient workforce, the United States must establish targeted programs for workforce training and reskilling, enabling professionals to stay relevant amidst technological advancements. For instance, the United States should establish a National Robotics Strategy Committee similar to Australia’s, while revising education standards, preparing students for workplaces with robotics, and supporting workers affected by automation.[62] Simultaneously, investments in advanced manufacturing technologies, such as automation, robotics, and additive manufacturing, could not only enhance manufacturing productivity but also generate high-tech job opportunities. Finally, fostering global collaboration by partnering with international counterparts on research initiatives, knowledge exchange, and talent mobility would expand access to a diverse pool of expertise, propelling the nation’s innovation capacity to new heights.
Funding for initiatives advanced in the CHIPS and Science Act, such as the critically important regional innovation hubs program, should be fully advanced in Biden administration budget proposals and Congressional budgeting reality.
Globalization
The U.S. government should set a strategic policy framework focused on increasing high-tech exports and attracting FDI to elevate the United States’ innovation competitiveness on the global stage. The United States must focus in particular on attracting greenfield as opposed to brownfield investment. The U.S. government should also implement targeted initiatives to promote the export of high-tech products and services, including streamlined export procedures, financial incentives, and trade missions that highlight the nation’s technological prowess. Concurrently, the United States should adopt a proactive approach to attract FDI by offering attractive incentives, simplified regulatory processes, and enhanced investor protections. By fostering an environment conducive to high-tech exports and foreign investment, the United States can harness the power of international collaboration and propel its innovation ecosystem to unparalleled heights, solidifying its position as a global leader in cutting-edge technologies and industries. The federal government should avoid export policies that limit sales of U.S. high-tech products to civilian and commercial actors in China, as U.S. high-tech companies need access to large markets at scale and, moreover, every $1 a U.S. semiconductor firm (for example) earns in China is one that a Chinese competitor does not.[63]
Innovation Capacity
The United States should implement several policies to bolster its innovation capacities. First, bolstering investment in education and research is imperative, involving increased funding for R&D across universities, research institutions, and private sectors. To catalyze innovation, the government should nurture a robust collaboration between academia and industry through partnerships, enabling seamless knowledge transfer and technology commercialization. The National Science Foundation’s Technology, Innovation, and Partnerships (TIP) program should focus on 1) Artificial intelligence, machine learning, autonomy, and related advances; 2) High-performance computing, semiconductors, and advanced computer hardware and software; 3) Quantum information science and technology; 4) Robotics, automation, and advanced manufacturing; 5) Biotechnology, medical technology, genomics, and synthetic biology, and 6) advanced materials science.[64] The TIP should also focus on industry-relevant research with high technology readiness levels (TRLs) from the early stage because it avoids spillover of the value-added to other nations.[65]
The Biden administration should further build out the Manufacturing USA Network of Manufacturing Innovation Institutes and ensure that it achieves its promised goal of tripling funding for the Manufacturing Extension Partnership program. Funding for initiatives advanced in the CHIPS and Science Act, such as the critically important regional innovation hubs program, should be fully advanced in Biden administration budget proposals and Congressional budgeting reality.
Moreover, supporting startups and entrepreneurship demands the creation of an enabling ecosystem, entailing grants, tax incentives, and access to venture capital, alongside the establishment of innovation hubs and accelerators. While some support for high-growth technology-intensive companies, such as the Small Business Innovation Research program is absolutely warranted, overall U.S. innovation policy should seek to be size neutral, in part because, to compete successfully in global markets in advanced-technology industries, size and scale matter.[66] Strategic infrastructure investment, encompassing modernization of transportation networks, energy grids, and digital connectivity, can attract and retain skilled talent and businesses. To incentivize innovation further, boosting R&D tax incentives and reinforcing intellectual property protection are crucial steps. By providing R&D grants, fostering public-private partnerships, streamlining regulations, and ensuring robust data privacy and security measures, the United States can create an environment conducive to innovation-driven economic growth. A first step in boosting R&D in the pharmaceutical industry is to reverse the Inflation Reduction Act’s pharmaceutical pricing provisions that compel pharmaceutical companies to negotiate prices with the Department of Health and Human Services on the most popular Medicare Part D branded drugs.[67] The federal government must also step up its game in defense of a more-robust global IP regime to spur U.S. competitiveness, support American jobs, and advance innovation. To strengthen domestic policies, U.S. policymakers should adopt website-blocking legislation, improve public engagement and education about IP, and stop trying to weaken the Bayh-Dole Act by advocating for the use of march-in rights to control drug prices.[68]
Conclusion
As countries—and regions therein—continue to move forward through the 21st century, they should adopt new policies aimed at improving their international competitiveness in the innovation economy. Due to regional disparities within countries, national-level policymakers must consider targeted policies to address local-specific challenges. Countries should develop their competitive capabilities in knowledge-based and technologically advanced industries via a variety of policies. These include, but are not limited to, investment in STEM education, incentivizing R&D investment, ensuring a proper patent system, and attracting high-skilled foreign workers and professionals. This report has highlighted 13 different indicators which together help to measure subnational competitiveness in the innovation economy. By analyzing this index, policymakers can get a better idea of the specific policies they should pursue, with special attention to underdeveloped or lagging regions.
Appendices
Appendix A: Composite and Category Scores Methodology
For each indicator, regions’ scores were converted to a standardized score, which was capped at ±3 to avoid an outlier performance on a single indicator from too heavily influencing the composite score. For composite and category scores, a weighted-average capped standardized score (WACSS) was calculated for each indicator, wherein the weights used are those listed in the table below (normalized such that an indicator’s applied weight is equal to its listed weight divided by the sum of the listed weights—i.e., applied weights sum to one). For the composite score, this was calculated by including all indicator weights; for the category scores, this was done by including only the weights for the indicators that fall under that category. WACCS are rescaled to a 100-point scale via min-max normalization, in which the “maximum” parameter is the maximum WACCS plus one-quarter standard deviation of WACCS, and the “minimum” parameter is the minimum WACCS minus one-quarter standard deviation of WACCS.
Mathematically, the WACCS of region ![]() is calculated as:
is calculated as:
![]()
wherein ![]() denotes the indicator,
denotes the indicator, ![]() denotes the capped standardized score for region
denotes the capped standardized score for region ![]() in indicator
in indicator ![]() , and
, and ![]() is the applied weight of indicator
is the applied weight of indicator ![]() , defined as:
, defined as:
![]()
such that ![]() .
.
The scaled score for region/UT ![]() is then calculated as:
is then calculated as:

Appendix B: Indicator Methodologies and Weights
Table A1: Indicator weights and descriptions
|
Indicator |
Weight |
Year |
Description |
Category |
|
Broadband Adoption |
0.50 |
2019 |
Share of households subscribing to broadband Internet |
Innovation Capacity |
|
Business Creation |
0.50 |
2016–2018 |
Enterprise birth rate in share of employer enterprises |
Innovation Capacity |
|
Carbon Efficiency |
0.50 |
2018 |
Metric tons of CO2e emitted per $10,000 of PPP-adjusted GDP |
Innovation Capacity |
|
High-Tech Exports |
0.75 |
2017 |
Exports in NACIS codes 333–335 (or equivalent) as a share of GDP |
Globalization |
|
Highly Educated Population |
0.75 |
2019 |
Share of 25–64-year-olds with a bachelor’s degree (or equivalent) or higher |
Knowledge Economy |
|
Inward FDI |
0.75 |
2017–2019 (average) |
FDI inflow as a share of GDP |
Globalization |
|
Manufacturing Labor Productivity |
1.25 |
2019 |
PPP-adjusted GVA per worker in the manufacturing sector |
Knowledge Economy |
|
Patent Applications |
1.25 |
2015 |
PCT patent applications per million residents |
Innovation Capacity |
|
Professional, Technical, and Scientific Employment |
1.25 |
2019 |
Share of employees in professional, technical, and scientific activities sector |
Knowledge Economy |
|
R&D Intensity |
1.50 |
2019 |
R&D expenditures as a share of GDP |
Innovation Capacity |
|
R&D Personnel |
1.50 |
2017, 2018 |
R&D personnel as a share of total employees |
Innovation Capacity |
|
Skilled Immigration |
0.50 |
2019 |
Share of population that is foreign born and has at least some tertiary education (ISEC 5–8) |
Knowledge Economy |
|
Venture Capital Received |
1.00 |
2017–2019 (average) |
Venture capital investments received as a share of GDP |
Innovation Capacity |
Appendix C: Estimation Methodologies
Combining Cities With Neighboring Regions
To avoid inequivalent comparisons between European cities and U.S. states, some NUTS regions were combined such as Berlin with Brandenburg, Bremen with Lower Saxony, Hamburg with Schleswig-Holstein, and Vienna with Lower Austria.[69] The combined result of these regions is the weighted averages of the components according to their respective GDP, population, employment, or number of businesses in line with the denominator of the specific indicators.
Carbon Efficiency
Italian and German greenhouse gas emissions data is not available at the regional level. Instead, each of these regions’ CO2 emissions is taken and divided by CO2’s share of greenhouse gas emissions at the country level. This estimate implicitly assumes that CO2’s share of greenhouse gas emissions is equal for all regions of the same country. However, this is likely to have little effect on the results since CO2 accounts for approximately 90 percent of greenhouse gas emissions in Germany and 85 percent in Italy.
Estimating Unavailable Data
Subnational-level data was not available for all indicators and countries. To bridge this gap, we used available proxy indicators that are available on the subnational level, and we assumed that they correlate with the original indicator. For instance, if high-tech exports are only available on a national level but not on a subnational level, while all exports are available on a subnational level too, then it is possible to estimate the amount of subnational high-tech exports by using the distribution of all exports across regions. The national-level high-tech export data ensures that the estimated regional high-tech export measures are in line with the national performance. These estimations allow for capturing parts of the innovation competitiveness metrics of regions despite the unavailability of the exact original indicator.
Innovation Categories
Regions were sorted into eight innovation competitiveness categories: modest innovator -, modest innovator +, moderate innovator -, moderate innovator +, strong innovator -, strong innovator +, innovation leader -, and innovation leader + based on the regions’ positions in the ranking. The number of regions in each category was selected to be 15 to place an equal number of regions in each category given that there are 121 regions in total. The minus sign in the name of the category indicates that its regions fall into a lower category than those regions that are in the respective category with a positive sign. As the colors of the charts indicate, the categories’ ascending order is modest innovator, moderate innovator, strong innovator, and innovation leader, in line with the rankings in the European Innovation Scorecard.
Acknowledgments
The authors would like to thank Ian Tufts, Policy Analyst at ITIF; Hubertus Bardt, Managing Director at IW; Thomas Osborn at I-Com; Martin Gundinger, Senior Fellow at the Austrian Economics Center; and Prof. Dr. Zoltán Cséfalvay, Head of the Centre for Next Technological Futures at MCC, for their contributions to this report.
About the Authors
Viktor Lazar is a policy fellow for global innovation policy at ITIF and a researcher at MCC’s Centre for Next Technological Futures in Hungary.
Stephen Ezell is vice president for global innovation policy at ITIF and director of ITIF’s Center for Life Sciences Innovation. He also leads the Global Trade and Innovation Policy Alliance.
Prof. Dr. Axel Plünnecke is the head of cluster education, immigration and innovation, at IW.
Andreas Larsson is CEO at STUNS and chairman of the board at Uppsala Innovation Centre.
Stefano da Empoli is president and principal policy analyst at the Institute for Competitiveness (I-Com), a think tank based in Rome and Brussels and which he founded in 2005.
Barbara Kolm is President of the Friedrich A. v. Hayek Institute in Vienna, Austria, Founding Director of the Austrian Economics Center, and Vice President of the Österreichische Nationalbank (Austrian Central Bank).
Jan Hagemejer is a Macro & Trade Director at CASE and also works as an Assistant Professor at the University of Warsaw.
Amanda Johansson is a project coworker at STUNS.
About GTIPA
The Global Trade and Innovation Policy Alliance (GTIPA) is a global network of independent think tanks that are ardent supporters of greater global trade liberalization and integration and deplore trade-distorting “innovation mercantilist” practices, but yet believe that governments can and should play important and proactive roles in spurring greater innovation and productivity in their enterprises and economies. Visit gtipa.org.
Endnotes
[1]. The Global Trade and Innovation Policy Alliance, “About,” https://gtipa.org/.
[2]. Authors’ calculation based on World Intellectual Property Organization (WIPO), “Global Innovation Index 2022, 15th Edition” (WIPO, 2022), https://www.wipo.int/publications/en/details.jsp?id=4626&plang=EN. and WIPO, “Global Innovation Index 2017, 10th Edition (WIPO, 2017), https://www.wipo.int/publications/en/details.jsp?id=4193&plang=EN.
[3]. Klaus Schwab, “The Global Competitiveness Report 2019” (World Economic Forum, 2019), https://www3.weforum.org/docs/WEF_TheGlobalCompetitivenessReport2019.pdf.
[4]. Viktor Lázár et al. “The Transatlantic Subnational Innovation Competitiveness Index,” (ITIF, November 2022), https://itif.org/publications/2022/11/14/the-transatlantic-subnational-innovation-competitiveness-index/.
[5]. N. F. Bassis and F. Armellini, “Systems of innovation and innovation ecosystems: a literature review in search of complementarities” Journal of Evolutionary Economics Vol. 28, Issue 5 (2018): 1053–1080, https://doi.org/10.1007/s00191-018-0600-6.
[6]. Robert Atkinson and Stephen Ezell, Innovation Economics: The Race for Global Advantage (New Haven, Connecticut: Yale University Press, 2012): 123–126, https://doi.org/10.1007/978-1-4614-4349-0_24.
[7]. Department of Geography and Environment, LSE, “The geography of innovation and development: global spread and local hotspots - LSE Research Online,” http://eprints.lse.ac.uk/105116/.
[8]. WIPO, “Global Innovation Index 2022, 15th Edition.”
[9]. H. Hollanders, N. Es-Sadki, and A. Khalilova, “European Innovation Scoreboard 2022” (European Commission, Directorate-General for Research and Innovation, 2022), https://data.europa.eu/doi/10.2777/309907.
[10]. Robert Atkinson and Caleb Foote, “The 2020 State New Economy Index” (ITIF, October 2020), https://itif.org/publications/2020/10/19/2020-state-new-economy-index/.
[11]. Lázár at al., “The Transatlantic Subnational Innovation Competitiveness Index.”
[12]. Authors’ calculation. For further information please see our methodology in the Appendices section.
[13]. Ibid.
[14]. “Essential Skills Are in Demand, But Lacking,” Council for Aid to Education, https://cae.org/evidence/.
[15]. Ali Quazi and Majharul Talukder, “Demographic Determinants of Adoption of Technological Innovation” Journal of Computer Information Systems No. 51 (March 2011), 38–46, https://www.researchgate.net/publication/285705399_Demographic_determinants_of_adoption_of_technological_innovation.
[16]. Lázár, et al., “The Transatlantic Subnational Innovation Competitiveness Index.” OECD, “Regions and Cities (Regional Education - Share of population 25 to 64 year-olds by educational attainment, Bachelor’s or equivalent level (ISCED2011 level 6-8), 2017” (accessed June 30 2023); OECD, “Regions and Cities (Regional Education - Share of population 25 to 64 year-olds by educational attainment, Total tertiary education (ISCED2011 levels 5 to 8), 2017 and 2019” accessed June 30 2023); Statistics Poland.
[17]. Ibid.
[18]. Adams Nager et al., “The Demographics of Innovation in the United States” (ITIF, February 2016), https://www2.itif.org/2016-demographics-of-innovation.pdf.
[19]. Tina Huang, Zachary Arnold, and Remco Zwetsloot, “Most of America’s ‘Most Promising’ AI Startups have Immigrant Founders” (Georgetown University website, October 2020), https://cset.georgetown.edu/publication/most-of-americas-most-promising-ai-startups-have-immigrant-founders/.
[20]. Vivek Wadhwa, “America’s New Immigrant Entrepreneurs” (Duke School of Engineering and UC Berkely School of Information, January 2007), https://people.ischool.berkeley.edu/~anno/Papers/Americas_new_immigrant_entrepreneurs_I.pdf.
[21]. Giovanni Peri, Kevin Shih, and Chad Sparber, “Foreign STEM Workers and Native Wages and Employment in U.S. Cities” (NBER Working Paper Series, no. 20093, May 2014), https://www.nber.org/system/files/working_papers/w20093/w20093.pdf.
[22]. Lázár, et al., “The Transatlantic Subnational Innovation Competitiveness Index”; Statistics Sweden, Population, foreign born, 2021 distributed by level of educational attainment, county and sex. 25-64 years, accessed January 18 2023; Statistics Sweden, Population, domestic born, 2021 distributed by level of educational attainment, county and sex. 25-64 years, accessed January 18 2023; Estimation based on the share of high-educated mirants from OECD and the number of migrants at NUTS2 level from Statistics Poland; OECD, Regions and Cities (Regional Demography – Population, All ages, 2019; accessed May 30 2023); OECD, Regions and Cities Database (Migrants – Education, Share of population with high education; accessed 30 May 2023); OECD, Regions and Cities (Regional Demography - Working Age Population Group (15-64), 2019; accessed May 30 2023); EUROSTAT, Population and social conditions (Population by educational attainment level, sex, age and country of birth (%), Tertiary education (levels 5-8), EU27 countries (from 2020) except reporting country, Non-EU27 countries (from 2020) nor reporting country; accessed 15 May 2023), https://ec.europa.eu/eurostat/databrowser/view/EDAT_LFS_9912__custom_1123330/bookmark/table?lang=en&bookmarkId=6b87c707-c138-4d84-b08b-53acd2455edd; OECD, Regions and Cities Database (Migrants – Share of 15-64 year olds population by origin, in % of total (native plus foreign) 15-64 age population, Foreign-born from inside EU-27 countries, Foreign-born from outside EU-27 countries, 2019; accessed 15 May 2023); OECD, Regions and Cities (Regional Demography - Working Age Population Group (15-64), 2019; accessed May 15 2023).
[23]. Ibid.
[24]. Lázár, et al., “The Transatlantic Subnational Innovation Competitiveness Index.” OECD, Regions and Cities Database (Regional Economy, Employment in prof., scientific, techn. activities, admin., support service activities (ISIC rev4); accessed January 16 2023); OECD, Regions and Cities Database (Regional Economy, Regional Employment at place of work, total activities; accessed January 16 2023).
[25]. Ibid.
[26]. BLS, “Quarterly Census of Employment and Wages (labor productivity and costs),” http://www.bls.gov/cew/.
[27]. Lázár, et al., “The Transatlantic Subnational Innovation Competitiveness Index”; OECD, Regions and Cities Database (Regional Economy, GVA_IND_10_VC: ..Of which: GVA in manufacturing (ISIC rev4), USD per worker, current prices, current PPP; accessed January 16 2023); OECD, Regions and Cities Database (Regional Economy, Regional GVA per worker in manufacturing (ISIC rev4), USD per worker, constant prices, constant PPP, 2019; accessed 15 May 2023); OECD, Regions and Cities Database (Regional Economy, Employment in manufacturing (ISIC rev4), 2019; accessed 15 May 2023).
[28]. Ibid.
[29]. Lázár, et al., “The Transatlantic Subnational Innovation Competitiveness Index”; Statistics Sweden, Number of companies by region, Standard Industrial Classification SNI 2007, size, quartile and year (SNI 25, 26, 27 and 28; accessed February 1 2023); The Swedish Agency for Economic and Regional Growth, Export value of goods 2021 by county (billions SEK; accessed December 16 2022); OECD, Regions and Cities Database (Regional Economy, Regional GDP, Millions National currency, current prices; accessed June 14 2023); OECD, Exchange rates (Total national currency units/US dollar, 2017; accessed June 15 2023); Statistik Austria, International trade in goods, Regional data by federal provinces, 2020. https://www.statistik.at/en/statistics/international-trade/international-trade-in-goods/regional-data-by-federal-provinces; The World Bank, High-technology exports (current US$), https://data.worldbank.org/indicator/TX.VAL.TECH.CD?locations=HU; OECD, Regions and Cities Database (Regional Economy, Regional GDP, Millions National currency, current prices; accessed 30 May 2023); The World Bank, GDP (current US$), https://data.worldbank.org/indicator/NY.GDP.MKTP.CD?locations=HU; OECD, Exchange rates (Total national currency units/US dollar, 2020; accessed 30 May 2023), https://data.oecd.org/conversion/exchange-rates.htm; Hungarian Central Statistical Office, Regional export revenues in industry (Millions National currency, 2019; accessed 15 May 2023), https://www.ksh.hu/docs/hun/xstadat/xstadat_evkozi/e_oia041.html; The World Bank, High-technology exports (current US$; accessed 15 May 2023), https://data.worldbank.org/indicator/TX.VAL.TECH.CD?locations=HU; OECD, Regions and Cities Database (Regional Economy, Regional GDP, Millions National currency, current prices, 2017; accessed 15 May 2023); OECD, Exchange rates (Total national currency units/US dollar, 2017; accessed 15 May 2023), https://data.oecd.org/conversion/exchange-rates.htm.
[30]. Ibid.
[31]. Eduardo Borensztein, Jose De Gregorio, and Jong-Wha Lee, “How Does Foreign Direct Investment Affect Economic Growth?” NBER Working Paper Series, No. 5057 (March 1995), https://www.sciencedirect.com/science/article/abs/pii/S0022199697000330; W.N.M. Azman-Saini, Ahmad Zubaidi Baharumshah, and Siong Hook Law, “Foreign Direct Investment, Economic Freedom and Economic Growth: International Evidence,” Economic Modelling No. 27 (2010): 1079–1089, https://www.sciencedirect.com/science/article/abs/pii/S0264999310000635.
[32]. Lázár, et al., “The Transatlantic Subnational Innovation Competitiveness Index”; Swedish Agency for Growth Policy Analysis, Foreign controlled enterprises in Sweden 2017 (Table: Employees in foreign controlled local units by county, municipality, and industry in Sweden 2017. Percentage distribution of employees by industry, p. 31), June 2018; Swedish Agency for Growth Policy Analysis, Foreign controlled enterprises in Sweden 2018 (Table: Employees in foreign controlled local units by county, municipality, and industry in Sweden 2018. Percentage distribution of employees by industry, p. 31), June 2019; Swedish Agency for Growth Policy Analysis, Foreign controlled enterprises in Sweden 2019 (Table: Employees in foreign controlled local units by county, municipality, and industry in Sweden 2019. Percentage distribution of employees by industry, p. 30), September 2021; UNCTAD, World investment report 2020 (FDI flows, by region and economy, 2014–2019 (Millions of dollars); FDI inflows; p. 238), June 2020; OECD, Regions and Cities Database (Regional Economy, Regional GDP, Millions National currency, current prices; accessed June 14 2023); OECD, Exchange rates (Totalt national currency units/US dollar, 2017; accessed June 15 2023); Estimation based on the shares of regional investment (Statistics Poland) and overall share of FDI in GDP (World Bank), regional GDP by Statistics Poland, 2019; The World Bank, Foreign direct investment (net inflows, % of GDP; accessed May 30 2023), https://data.worldbank.org/indicator/BX.KLT.DINV.WD.GD.ZS?locations=AT; Bundesministerium für Digitalisierung und Wirtschaftsstandort, Österreichs Direktinvestitionen im Jahr 2018 Abb. 18, p.15, https://www.bmaw.gv.at/dam/jcr:831912b7-96ab-4583-92b5-34f69ca6df8a/%C3%96sterreichs%20Direktinvestitionen_rev.pdf; The World Bank, GDP (current US$; accessed 15 May 2023), https://data.worldbank.org/indicator/NY.GDP.MKTP.CD?locations=AT; OECD, Regions and Cities Database (Regional Economy, Regional GDP, Millions National currency, current prices; accessed 30 May 2023); The World Bank, Foreign direct investment (net inflows, % of GDP; accessed May 15 2023), https://data.worldbank.org/indicator/BX.KLT.DINV.WD.GD.ZS?locations=HU; Hungarian Central Statistical Office, Investment trends in the Hungarian regions after the turn of the millennium (Investment performance of foreign affiliates by region, 2001-2007 average, Millions National currency, All industries, p. 57), December 2008, https://www.ksh.hu/docs/hun/xftp/idoszaki/regiok/orsz/beruhazasreg.pdf; The World Bank, GDP (current US$; accessed 15 May 2023), https://data.worldbank.org/indicator/NY.GDP.MKTP.CD?locations=HU; OECD, Regions and Cities Database (Regional Economy, Regional GDP, Millions National currency, current prices; accessed 15 May 2023); OECD, Exchange rates (Total national currency units/US dollar, 2019; accessed 15 May 2023), https://data.oecd.org/conversion/exchange-rates.htm.
[33]. HIPA, “FDI Inflow To Hungary Hits New High” (Hungarian Investment Promotion Agency, 2022), https://hipa.hu/news/fdi-inflow-to-hungary-hits-new-high/.
[34]. Ibid.
[35]. Unlike the sources for the other three countries, Canada’s Survey of Household Spending does not differentiate between types of Internet connections (e.g., broadband v dial-up).
[36]. Nina Czernich et al., “Broadband Infrastructure and Economic Growth,” The Economic Journal No. 121 (May 2011), 505–532, https://doi.org/10.1111/j.1468-0297.2011.02420.x.
[37]. Lázár, et al., “The Transatlantic Subnational Innovation Competitiveness Index”; OECD, Regions and Cities (Regional Social and Environmental indicators, Share of households with internet broadband access, % of total households; accessed January 16 2023), https://stats.oecd.org/.
[38]. Ibid.
[39]. Brown H. Hall, Jacques Mairesse, and Pierre Mohnen, “Measuring the Returns to R&D,” NBER Working Paper Series, No. 15622 (December 2009), https://doi.org/10.1016/S0169-7218(10)02008-3.
[40]. Lázár, et al., “The Transatlantic Subnational Innovation Competitiveness Index”; OECD, Regions and Cities (Regional Innovation, Share of R&D Total Expenditure, in % of GDP, 2015 and 2017; accessed January 16 2023), https://stats.oecd.org/; Eurostat; OECD, Regions and Cities (Regional Innovation, Share of R&D Total Expenditure, in % of GDP, 2017; accessed May 30 2023), https://stats.oecd.org/; OECD, Regions and Cities Database (Regional Economy, Regional GDP, Millions National currency, current prices, 2018; accessed 30 May 2023).
[41]. Ibid.
[42]. Lázár, et al., “The Transatlantic Subnational Innovation Competitiveness Index”; OECD, Regions and Cities (Regional Innovation, R&D Total Personnel Rate, in % of total employment, 2015 and 2017; accessed January 16 2023), https://stats.oecd.org/; Eurostat; OECD, Regions and Cities (Regional Economy, Regional Employment by industry, Regional Employment at place of work, total activities), 2017; accessed May 30 2023), https://stats.oecd.org/.
[43]. Ibid.
[44]. Lázár, et al., “The Transatlantic Subnational Innovation Competitiveness Index”; OECD, Regions and Cities (Regional Innovation, PCT patent applications per million inhabitants (fractional count; by inventor and priority year) - level, 2015; accessed January 19 2023), https://stats.oecd.org/; OECD, Regions and Cities (Regional Innovation, PCT patent applications per million inhabitatnts, 2015; accessed May 30 2023), https://stats.oecd.org/.
[45]. Ibid.
[46]. Lázár, et al., “The Transatlantic Subnational Innovation Competitiveness Index”; Swedish Agency for Growth Policy Analysis, New enterprises in Sweden 2018 (Table: New enterprises 2018 by county, p. 12), June 2019; OECD, Regions and Cities (Regional Business Demography, Number of employer firms (active), Total economy - aggregate 3 (industry, construction, services exc. Insurance activities of holding companies, 2016-2020; accessed May 30 2023), https://stats.oecd.org/; OECD, Regions and Cities (Regional Business Demography, Number of births (employer firms), Total economy - aggregate 3 (industry, construction, services exc. Insurance activities of holding companies, 2016-2020; accessed May 30 2023), https://stats.oecd.org/; Eurostat.
[47]. Ibid.
[48]. Lázár, et al., “The Transatlantic Subnational Innovation Competitiveness Index”; Moran et al., “Estimating CO2 emissions for 108 000 European cities” (Earth Syst. Sci. Data, Total t CO2, February 2022), https://essd.copernicus.org/articles/14/845/2022/; OECD, Regions and Cities Database (Regional Economy, Regional GDP, Millions USD, current prices, current PPP, 2020; accessed 30 May 2023); OECD, Environment (Air and Climate, Greenhouse gas emissions by source, Total emissions excluding LULUCF, Tonnes of CO2 equivalent (thousands), 2019; accessed 30 May 2023).
[49]. Ibid.
[50]. Lázár, et al., “The Transatlantic Subnational Innovation Competitiveness Index”; Swedish Private Equity & Venture Capital Association (SVCA), Growth Regions Sweden 2007-2021 (Venture capital – Amount in € thousands), April 2021; OECD, Regions and Cities Database (Regional Economy, Regional GDP, Millions National currency, current prices; accessed June 14 2023); OECD, Exchange rates (Totalt national currency units/US dollar, 2017; accessed June 15 2023); PFR Poland VC data for 2019, Investment data from Statistics Poland, GDP data from Statistics Poland; Hungarian Central Statistical Office, Investment by businesses in regions (Millions National currency, 2018 and 2019), https://www.ksh.hu/stadat_files/ber/hu/ber0013.html; EY and HVCA, Venture Capital and Private Equity update, (Hungary - 2019, Million EUR, 2018 and 2019, Total capital invested, Market statistics), https://www.hvca.hu/documents/HVCA_Report_2020_06_08.pdf; OECD, Regions and Cities Database (Regional Economy, Regional GDP, Millions National currency, current prices, 2018 and 2019; accessed 15 May 2023); OECD, Exchange rates (Total national currency units/US dollar, 2018 and 2019; accessed 15 May 2023), https://data.oecd.org/conversion/exchange-rates.htm.
[51]. Ibid.
[52]. Anger, Christina / Betz, Julia / Plünnecke, Axel, 2023, MINT-Bildung stärken, Potenziale von Frauen, Älteren und Zuwandernden heben, Gutachten für BDA, MINT Zukunft schaffen und Gesamtmetall, Köln.
[53]. Hüther, Michael, 2023, “Deindustrialisierung. Schreckgespenst oder notwendiger Schritt im Strukturwandel der deutschen Wirtschaft?” in: ifo Schnelldienst, 76 .Jg., Heft 3, S. 3–6; Rusche, Christian, 2023, Deindustrialisierung. Eine Analyse auf Basis von Direktinvestitionen, IW-Kurzbericht, Nr. 43, Köln.
[54]. A. Pandey, “Why India does so poorly in International Mathematics Olympiads,” Medium, (January 6, 2022), https://amit-pandey2103.medium.com/why-india-does-so-poorly-in-international-mathematics-olympiads-d0e6d6d494b9.
[55]. The Government of Sweden, “Research, Freedom, the Future – Knowledge and Innovation for Sweden” (December 2020), https://www.regeringen.se/rattsliga-dokument/proposition/2020/12/forskning-frihet-framtid--kunskap-och-innovation-for-sverige/.
[56]. Swedish Agency for Growth Policy Analysis, “Foreign controlled enterprises 2020” (2022), https://www.tillvaxtanalys.se/publikationer/statistik/statistikserien/2022-06-15-utlandska-foretag-2020.html.
[57]. Swedish Agency for Growth Policy Analysis, “Research and Development in enterprises in 2019” (2021), https://www.tillvaxtanalys.se/in-english/publications/statistics/statistics/2021-10-08-research-and-development-in-enterprises-in-2019.html.
[58]. The Swedish Energy Agency, Formas and Vinnova, “Sweden’s innovation investment for the 2030s”, https://impactinnovation.se/en/.
[59]. Statistics Sweden, “Increased expenditures for R&D in Sweden” (2022), https://www.scb.se/en/finding-statistics/statistics-by-subject-area/education-and-research/research/research-and-development-in-sweden/pong/statistical-news/research-and-development-in-sweden-2021/.
[60]. Enrico Deiaco and Emma Lappi, “The knowledge-intensive suppliers’ economic significance in Swedish business – a national and regional analysis” (Swedish Entrepreneurship Forum, 2023), https://entreprenorskapsforum.se/wp-content/uploads/2023/05/Rapport_Deiaco_Lappi_Web.pdf.
[61]. Juan Londono, “Developing an R&D Strategy to Integrate Immersive Learning Into the Classroom” (ITIF, August 2023), https://itif.org/publications/2023/08/07/developing-an-rd-strategy-to-integrate-immersive-learning-into-the-classroom/.
[62]. Morgan Stevens, “Why Policymakers Should Support Robotic Automation to Solve the Productivity Crunch in Logistics Facilities” (ITIF, June 2023), https://itif.org/publications/2023/06/26/policymakers-should-support-robotic-automation-to-solve-productivity-crunch-in-logistics/.
[63]. Robert Atkinson, “Export Controls Shrink the Global Markets U.S. Semiconductors Need to Survive” (ITIF, July 2023), https://itif.org/publications/2023/07/17/export-controls-shrink-global-markets-us-semiconductors-need-to-survive/.
[64]. Robert Atkinson, “Comments to the National Science Foundation Regarding the Technology, Innovation, and Partnerships (TIP) Directorate” (ITIF, July 2023), https://itif.org/publications/2023/07/06/comments-to-national-science-foundation-regarding-technology-innovation-and-partnerships-directorate/.
[65]. Ibid.
[66]. Robert Atkinson, “The National Economic Council Gets It Wrong on the Roles of Big and Small Firms in U.S. Innovation” (ITIF, July 2023), https://itif.org/publications/2023/07/20/nec-gets-it-wrong-on-roles-of-big-and-small-firms-in-us-innovation/.
[67]. Trelysa Long and Stephen Ezell, “The Hidden Toll of Drug Price Controls: Fewer New Treatments and Higher Medical Costs for the World” (ITIF, July2023), https://itif.org/publications/2023/07/17/hidden-toll-of-drug-price-controls-fewer-new-treatments-higher-medical-costs-for-world/.
[68]. Stephen Ezell, “Losing the Lead: Why the United States Must Reassert Itself as a Global Champion for Robust IP Rights” (ITIF, June 2023), https://itif.org/publications/2023/06/12/losing-the-lead-why-united-states-must-reassert-itself-as-global-champion-for-robust-ip-rights/.
[69]. The nomenclature of territorial units for statistics (Nomenclature des Unités territoriales statistiques – NUTS) is a geographical system, according to which the territory of the European Union is divided into hierarchical levels. The three hierarchical levels are known as NUTS -1, NUTS -2 and NUTS -3. German Statistical Office, “NUTS Classification,” https://www.destatis.de/Europa/EN/Methods/Classifications/OverviewClassification_NUTS.html.
