


The Transatlantic Subnational Innovation Competitiveness Index
Innovation ecosystems are increasingly complex and diverse, but there are common markers of core strength. In this report, the Information Technology and Innovation Foundation, the German Economic Institute, the Institute for Competitiveness, and the Macdonald-Laurier Institute benchmark 96 states and regions across Germany, Italy, the United States, and Canada.
KEY TAKEAWAYS
Key Takeaways
Contents
The Transatlantic Subnational Innovation Competitiveness Index 5
Highly Educated Population. 15
Professional, Technical, and Scientific Employment 18
Manufacturing Labor Productivity 19
Appendix A: Composite and Category Scores Methodology 46
Appendix B: Indicator Methodologies and Weights 47
Appendix C: Estimation Methodologies 48
Appendix D: Full Dataset and Rankings Error! Bookmark not defined.
Executive Summary
Governments—at federal, state, and even regional and city levels—are realizing that they must develop innovation strategies to compete in an increasingly knowledge-, technology-, and innovation-driven global economy. Improving both national- and state-level innovation competitiveness entails governments fostering advanced industries and incentivizing the activities that lead to technological progress, such as R&D and making investments in productivity-enhancing technologies. Such strategies are becoming more common, as exemplified by Germany’s “Industry 4.0” (2011) and China’s “Made in China 2025” (2015) as well as the United States’ passage of the CHIPS and Science Act this July (2022).
As countries develop economically, they are less able to rely on simple “catch-up” growth strategies such as technology absorption from more-developed countries. While ITIF encourages further investments in advanced capital equipment (e.g., industrial robots for manufacturing), economies at the technological frontier must also be able to design and develop new technologies, products, and processes to boost productivity, the ultimate source of long-term economic growth. Rather than being “Manna from Heaven” beyond the control of economic actors, innovation-driven productivity growth is something governments and society can and should actively promote.
This report builds on its predecessor, the North American Subnational Innovation Competitiveness Index (NASICI), using 13 commonly available indicators to compare the innovative capacity and global competitiveness of the subnational regions of Canada, Germany, Italy, and the United States. The report’s goal is to provide policymakers with a comparative and evaluative tool to better understand where their regions rank among peers in terms of innovation capacity as well as how they can improve.[1] As in the predecessor of this report, Massachusetts ranks first among the 96 regions evaluated, thanks to its world-leading network of universities, highly educated population, and concentration of biotechnology and other advanced-industry firms. Although Massachusetts holds the top spot and California comes in second, Germany generally outperforms the United States. The overall score of the median German state across all indicators is 45.3, while that of the median U.S. state is 33.9. Germany claims the second-best-performing state in Baden-Württemberg, home to companies such as Mercedes-Benz and SAP, as well as 4 others in the top 10. Though Canada’s best-performing province (Ontario) scores higher than Italy’s (Emilia-Romagna), and Canada’s worst-performing province (Saskatchewan) scores better than Italy’s (Calabria), the median Italian region actually outperforms the median Canadian province. Canada’s particular weaknesses lie in measures of R&D activity, carbon efficiency of production, business creation, and high-tech exports relative to GDP.
One persistent trend is the disparity in performance among regions in Canada, Germany, Italy, and, to a lesser extent, the United States. Germany’s best performers on almost all indicators can be found in the south and west of the country (with Berlin as a common exception), while this is true as well for Italy’s northern regions. Innovative activity in Canada is concentrated in British Columbia, Ontario, and Quebec (as is Canada’s population and economic activity in general). The United States’ best performers tend to be found along the east and west coasts, though for many indicators, states in the middle of the country score very well (e.g., New Mexico scores highly in R&D intensity and personnel and Nevada in business creation).
The report contends that Germany should sustain its leadership by increasing investment in its education system and supporting businesses in adopting digital technologies and increasing R&D expenditures. Canada should incentivize greater R&D investment, attract technology-intensive FDI, boost productivity, and invest in science, technology, engineering, and mathematics (STEM) education to support employment in advanced-technology industries. Italy should work to expand access to higher education and attract more VC and FDI. The United States should increase its R&D tax credit, bolster science and R&D funding, and reconsider immigration policies in high-demand professions to help accelerate technology innovation and adoption by firms in all states.
After a brief introduction, the report proceeds by delving into overall findings before turning to an analysis of how states in the four countries perform in each of the 13 indicators across the three high-level categories of knowledge economy, globalization, and innovation capacity. It concludes by offering policy recommendations in light of the specific findings for each country.
Introduction
While the populations of Canada, Germany, Italy, and the United States are relatively small compared with the global population (512 million of the 7.9 billion people worldwide), these countries account for one-third of global economic output ($32 trillion of the $96 trillion).[2]
Governments throughout the world—at federal, state, and even regional and city levels—are realizing they must develop innovation strategies to compete in an increasingly knowledge-, technology-, and innovation-driven global economy. For any developed economy, the ability to maintain economic prowess and international relevance hinges on innovation and technological advancements, which boost per capita GDP.[3]
Multiple critical factors influence a nation’s innovation ecosystem. Among them are the quality of education and academics (especially in STEM fields), public and private R&D and innovation investments, the extent of highly trained R&D personnel, economic dynamism, and entrepreneurship.
Governments increasingly recognize the imperative of cultivating robust innovation ecosystems. As a result, many nations have introduced national technology and innovation strategies and industrial policies, such as those in Canada, China, France, Germany, Italy, Japan, and the United States.[4] Most recently, the United States’ CHIPS and Science Act of 2022 exemplified this global trend.[5]
It’s clear that countries place significant emphasis on the development of their innovation ecosystems and set ambitious goals to achieve economic prosperity. The crucial question is how individual nations and regions are progressing in this race for competitiveness, and what policymakers can do to nurture their innovation ecosystems.
Through self-reinforcing mechanisms, businesses, universities, and research facilities in specific regions specialize in certain areas. Moreover, regional policymakers may also prioritize different determinants of innovation that result in unique regional strengths and weaknesses. For instance, California and Massachusetts excel in information technology and life-sciences sectors while Arizona, New York, and Texas excel at semiconductors. As a result, it’s essential to inspect the performances of these regional ecosystems in terms of innovation competitiveness on a subnational level to understand national and regional comparative advantages and key areas that require targeted policymaking.
Several studies seek to assess national innovation competitiveness.[6] There are also reports that assess the performance of subnational regions. In the United States, for example, ITIF publishes the State New Economy Index, which measures the extent to which U.S. states’ economies are knowledge-driven, globalized, entrepreneurial, IT driven, and innovation oriented.[7] The European Commission has also published a report evaluating the effectiveness of European innovation ecosystems at a subnational level.[8]
Governments throughout the world—at federal, state, and even regional and city levels—are waking up to the fact that they must develop innovation strategies to compete in an increasingly knowledge-, technology-, and innovation-driven global economy.
However, there is insufficient data and literature comparing North American and European subnational innovation ecosystems. This report responds to that gap by providing detailed analysis of the innovation competitiveness of major economies in Europe and North America, specifically Germany, Italy, Canada, and the United States.
The Transatlantic Subnational Innovation Competitiveness Index
The Transatlantic Subnational Innovation Competitiveness Index (TASICI) captures the innovation performance of 96 regions across 4 developed countries and 2 continents: Canada (10 provinces), Germany (16 states), Italy (20 regions), and the United States (50 states).
The TASICI represents the continuation of the NASICI report and follows its structure.[9] Given the constraints that data must be available for the regions in each of the four countries for the same (or at least adjacent) years, this report consists of 13 indicators representing the relevant determinants of a successful innovation ecosystem, grouped into three categories:
▪ Knowledge-Based Workforce: Indicators measure the educational attainment of the workforce; immigration of knowledge workers; employment in professional, technical, and scientific (PTS) activities; and manufacturing sector productivity.
▪ Globalization: Indicators measure high-tech exports and inward FDI.
▪ Innovation Capacity: Indicators measure a region’s share of households subscribing to broadband Internet, expenditures on R&D, the number of R&D personnel, the creation of new businesses, patent output, the extent of progress toward decarbonization, and VC investment.
The most important category of the TASICI is innovation capacity, which accounts for 54 percent of the index’s weight, while the knowledge economy indicators account for 33 percent of the index’s weight, and the globalization indicators account for the remaining 13 percent.
Overall Score
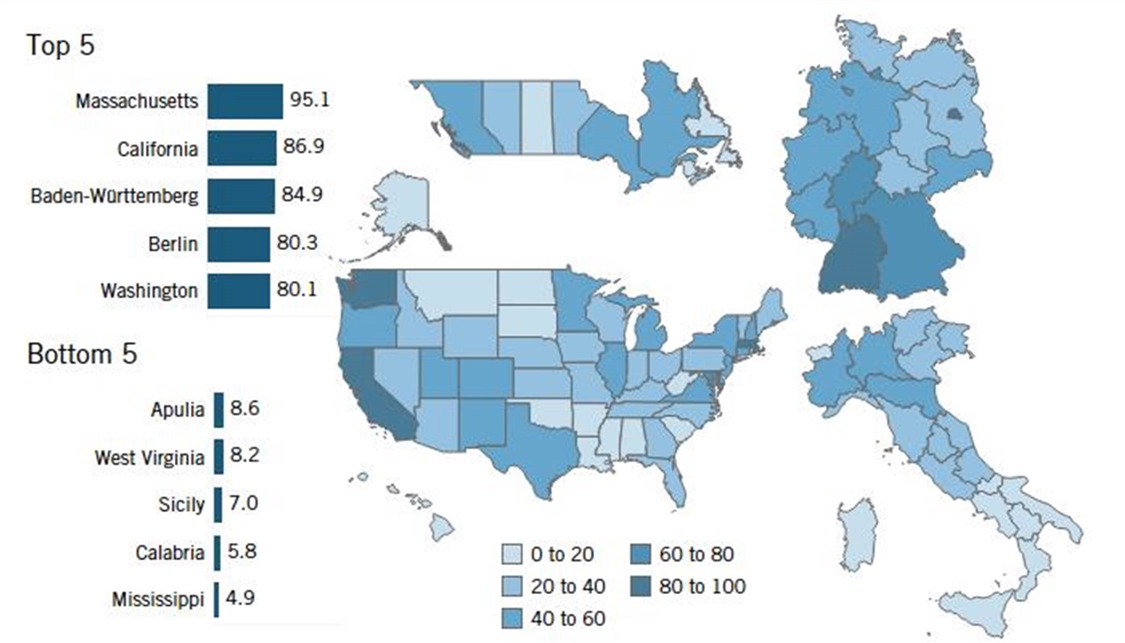
Figure 1: Overall composite TASICI scores
The Rankings
Massachusetts, California, Baden-Württemberg, Berlin, and Washington top contenders in this 96-region index, while Apulia, West Virginia, Sicily, Calabria, and Mississippi perform the weakest. (See Figure 1.) Interestingly, regional disparities are apparent in each country. Canada’s central and Atlantic regions perform poorly compared with the provinces of British Columbia, Ontario, and Quebec. (However, Canada’s population and economic activity are heavily concentrated in these three provinces.) Germany’s western and southern states predictably outperform their northeastern counterparts (except for Berlin). Likewise, Italy’s more-industrialized northern and central regions outperform its slower-developing southern regions. And the United States’ best performers can mostly be found along its coasts, while the southeast region contains the three lowest scoring U.S. states (Mississippi, West Virginia, and Arkansas). Notably, the United States claims the best-performing (Massachusetts) and worst-performing (Mississippi) states, as well as 4 of the top 10 and 5 of the bottom 10.
Overall, Germany’s states slightly lead American ones across the TASICI indicators, while the performance of Canada’s provinces is much more similar to that of Italian regions than to German or American states. Germany demonstrates leadership in innovation competitiveness with a median of 44.1 and average of 50.4 in overall scores and with 6 states placing in the
top 10. Although 4 of the top 10 regions are in the United States, the median score is 33.8
and the average score is 35.6, both of which are significantly behind German levels. Canada and Italy display the least successful performances with median scores of 21.1 and 24.9, and average scores of 27.5 and 25.2, respectively. The performance of Canadian provinces is much more similar to those of Italian regions than to German or American states. In fact, despite its highest- and lowest-scoring provinces outperforming regions in Italy, the median Italian region outscores the median Canadian province.
Canada performs poorly in the innovation capacity category, notching the lowest median score. It performs only middlingly in the other two categories, scoring closer to Italy on knowledge economy indicators than it does to either Germany or the United States. Canada does not possess a single province in the top 10, with its highest-scoring province being Ontario (16th). Ontario performs quite well in the knowledge economy and globalization categories, ranking eighth and third, respectively. However, it falters in the innovation capacity category, ranking only 35th. Canada does not have another province that ranks in the top 10 in any of the three categories.
As a whole, Germany performs very well in each of the three categories. It contains the highest-scoring state in the knowledge economy and innovation capacity categories and the highest-scoring median region in all three categories. Baden-Württemberg and Berlin both score in the top five overall, ranking third and fourth, respectively. Other standouts for Germany are Bavaria, Bremen, Hamburg, and Hesse, which all also rank in the top 10 overall.
Italy’s clear weakness lies in the knowledge economy category, where it has both the lowest median score and lowest-scoring region (Sicily). Globalization proves to be a “tale of two halves” for Italy. It possesses the highest-scoring region in Lombardy while Piedmont and Emilia-Romagna also rank in the top 10. On the other hand, Italy’s southern regions account for 5 of the 10 lowest-scoring regions in the category, with Calabria ranking last. However, innovation capacity is a surprising bright spot for Italy despite its highest-scoring region in the category, Emilia-Romagna, lagging far behind the highest-scoring states in Germany and the United States. Italy’s best overall performer is Emilia-Romagna, which ranks 17th overall. Emilia-Romagna ranks 9th in globalization, 14th in innovation capacity, yet only 48th in knowledge economy.
Despite three of the top-five overall performers being in the United States (Massachusetts, California, and Washington), America does not lead in any of the three categories. However, it is the only other country that matches strength with Germany in the knowledge economy category. The median U.S. state scores slightly better than the median Italian region in innovation capacity. Despite having 3 of the 4 highest-scoring states in the category, it claims 8 of the 10 lowest-scoring states, including all of the bottom 7. Massachusetts is both the United States’ highest-scoring state and the highest-scoring state overall, ranking 2nd in innovation capacity, 3rd in knowledge economy, and 12th in globalization. California and Washington both also score well in knowledge economy (6th and 14th, respectively) and innovation capacity (4th and 3rd), but surprisingly score quite poorly in globalization (42nd and 68th). Maryland is the other U.S. state to score in the top 10, also performing very well in knowledge economy and innovation capacity (5th and 12th, respectively), but much more poorly in globalization (64th).
Table 1: Summary of country performance in overall TASICI and components
|
Median Knowledge Score |
Median Globalization Score |
Median Capacity Score |
Max Overall Score |
Min Overall Score |
||||
|
Germany |
44.1 |
41.5 |
50.6 |
46.9 |
84.9 |
(Baden-Württemberg) |
23.1 |
(Saxony-Anhalt) |
|
USA |
33.8 |
39.3 |
36.3 |
32.9 |
95.1 |
(Massachusetts) |
4.9 |
(Mississippi) |
|
Italy |
24.9 |
23.7 |
37.5 |
32.2 |
50.2 |
(Emilia-Romagna) |
5.8 |
(Calabria) |
|
Canada |
21.1 |
30.2 |
38.8 |
22.8 |
51.9 |
(Ontario) |
12.8 |
(Saskatchewan) |
|
ALL |
33.1 |
34.7 |
39.8 |
33.8 |
95.1 |
(Massachusetts) |
4.9 |
(Mississippi) |
Table 2: Regional performance in overall TASICI and components sorted by overall TASICI
|
Overall |
Region |
Country |
Overall |
Knowledge |
Globalization |
Capacity |
|||
|
Rank |
Score |
Rank |
Score |
Rank |
Score |
||||
|
1 |
Massachusetts |
USA |
95.1 |
3 |
87.4 |
12 |
70.7 |
2 |
93.2 |
|
2 |
California |
USA |
86.9 |
6 |
77.4 |
42 |
43.0 |
4 |
91.6 |
|
3 |
Baden-Württemberg |
DEU |
84.9 |
19 |
54.4 |
4 |
83.1 |
1 |
95.2 |
|
4 |
Berlin |
DEU |
80.3 |
1 |
95.1 |
46 |
40.5 |
5 |
78.2 |
|
5 |
Washington |
USA |
80.1 |
14 |
61.6 |
68 |
29.9 |
3 |
92.6 |
|
6 |
Hamburg |
DEU |
73.5 |
2 |
93.5 |
13 |
69.4 |
10 |
62.2 |
|
7 |
Bavaria |
DEU |
71.6 |
20 |
53.6 |
2 |
90.4 |
6 |
74.6 |
|
8 |
Hesse |
DEU |
66.1 |
15 |
61.6 |
5 |
81.2 |
8 |
63.6 |
|
9 |
Maryland |
USA |
62.8 |
5 |
77.4 |
64 |
31.3 |
12 |
59.6 |
|
10 |
Bremen |
DEU |
58.9 |
10 |
64.5 |
47 |
40.2 |
11 |
60.5 |
|
11 |
New Jersey |
USA |
57.9 |
4 |
82.3 |
80 |
23.5 |
19 |
50.5 |
|
12 |
Oregon |
USA |
57.9 |
30 |
46.1 |
33 |
49.9 |
7 |
65.4 |
|
13 |
Connecticut |
USA |
54.7 |
9 |
65.4 |
24 |
56.5 |
22 |
47.6 |
|
14 |
Colorado |
USA |
53.9 |
12 |
62.3 |
21 |
60.8 |
20 |
49.3 |
|
15 |
Delaware |
USA |
53.0 |
21 |
52.4 |
36 |
48.3 |
15 |
56.4 |
|
16 |
Ontario |
CAN |
51.9 |
8 |
65.4 |
3 |
86.5 |
35 |
40.3 |
|
17 |
Emilia-Romagna |
ITA |
50.2 |
48 |
35.1 |
9 |
74.2 |
14 |
56.5 |
|
18 |
New Hampshire |
USA |
49.9 |
39 |
40.5 |
18 |
66.3 |
16 |
54.1 |
|
19 |
Michigan |
USA |
49.0 |
37 |
40.9 |
59 |
34.5 |
13 |
57.4 |
|
20 |
North Rhine-Westphalia |
DEU |
48.6 |
27 |
47.1 |
19 |
63.5 |
21 |
49.2 |
|
21 |
Minnesota |
USA |
48.6 |
23 |
50.9 |
40 |
43.9 |
18 |
51.1 |
|
22 |
Utah |
USA |
48.1 |
31 |
46.0 |
38 |
47.1 |
17 |
51.9 |
|
23 |
New York |
USA |
47.7 |
16 |
60.1 |
35 |
48.6 |
31 |
41.2 |
|
24 |
New Mexico |
USA |
47.2 |
51 |
33.6 |
70 |
27.4 |
9 |
63.1 |
|
25 |
Virginia |
USA |
46.1 |
7 |
75.2 |
32 |
50.1 |
53 |
32.4 |
|
26 |
Illinois |
USA |
45.7 |
18 |
58.3 |
22 |
58.4 |
37 |
40.0 |
|
27 |
Texas |
USA |
45.6 |
13 |
62.1 |
15 |
68.3 |
50 |
33.3 |
|
28 |
Lombardy |
ITA |
44.9 |
35 |
41.8 |
1 |
94.8 |
33 |
40.8 |
|
29 |
Lower Saxony |
DEU |
44.6 |
33 |
42.7 |
39 |
44.9 |
23 |
47.1 |
|
30 |
British Columbia |
CAN |
44.3 |
17 |
58.8 |
17 |
66.7 |
45 |
36.1 |
|
31 |
Rhineland-Palatinate |
DEU |
43.7 |
41 |
40.0 |
31 |
50.4 |
24 |
46.6 |
|
32 |
Saxony |
DEU |
43.3 |
40 |
40.4 |
23 |
56.6 |
28 |
43.6 |
|
33 |
Saarland |
DEU |
42.1 |
46 |
36.0 |
14 |
69.4 |
26 |
44.2 |
|
34 |
Quebec |
CAN |
40.6 |
28 |
46.8 |
28 |
52.8 |
36 |
40.2 |
|
35 |
Piedmont |
ITA |
40.0 |
63 |
29.4 |
6 |
78.2 |
27 |
43.7 |
|
36 |
Lazio |
ITA |
39.9 |
29 |
46.2 |
44 |
42.9 |
30 |
41.6 |
|
37 |
North Carolina |
USA |
39.6 |
24 |
50.7 |
82 |
20.8 |
40 |
39.2 |
|
38 |
Pennsylvania |
USA |
39.1 |
26 |
47.2 |
52 |
37.9 |
42 |
37.6 |
|
39 |
Friuli-Venezia Giulia |
ITA |
38.2 |
69 |
27.2 |
11 |
71.1 |
29 |
43.2 |
|
40 |
Arizona |
USA |
37.5 |
38 |
40.8 |
48 |
39.8 |
39 |
39.4 |
|
41 |
Thuringia |
DEU |
37.1 |
49 |
34.2 |
30 |
50.8 |
41 |
38.7 |
|
42 |
Idaho |
USA |
36.1 |
74 |
24.6 |
54 |
36.6 |
25 |
46.5 |
|
43 |
Missouri |
USA |
35.6 |
47 |
35.7 |
8 |
74.5 |
52 |
32.6 |
|
44 |
Wisconsin |
USA |
35.5 |
61 |
29.4 |
25 |
56.3 |
38 |
39.8 |
|
45 |
Rhode Island |
USA |
34.9 |
43 |
38.0 |
37 |
48.1 |
46 |
35.6 |
|
46 |
Alberta |
CAN |
34.6 |
11 |
64.4 |
51 |
38.6 |
64 |
24.1 |
|
47 |
Veneto |
ITA |
34.4 |
73 |
24.7 |
20 |
62.1 |
34 |
40.5 |
|
48 |
Schleswig-Holstein |
DEU |
33.4 |
50 |
34.2 |
43 |
42.9 |
47 |
35.0 |
|
49 |
Ohio |
USA |
32.8 |
45 |
37.6 |
55 |
36.6 |
48 |
33.9 |
|
50 |
Tuscany |
ITA |
32.2 |
71 |
26.7 |
49 |
39.7 |
32 |
40.8 |
|
51 |
Indiana |
USA |
30.0 |
55 |
32.0 |
75 |
24.9 |
44 |
36.6 |
|
52 |
Liguria |
ITA |
29.8 |
59 |
30.3 |
34 |
48.9 |
49 |
33.6 |
|
53 |
Mecklenburg-Vorpommern |
DEU |
29.8 |
56 |
31.7 |
62 |
32.5 |
56 |
30.4 |
|
54 |
Kansas |
USA |
29.1 |
36 |
41.4 |
65 |
31.1 |
61 |
27.5 |
|
55 |
Georgia |
USA |
28.3 |
34 |
42.3 |
79 |
23.7 |
59 |
28.0 |
|
56 |
Florida |
USA |
27.3 |
32 |
43.3 |
81 |
23.0 |
63 |
24.3 |
|
57 |
Marche |
ITA |
26.2 |
85 |
19.2 |
63 |
32.2 |
43 |
37.2 |
|
58 |
Abruzzo |
ITA |
25.6 |
77 |
23.6 |
27 |
53.6 |
58 |
29.7 |
|
59 |
Maine |
USA |
25.3 |
64 |
29.1 |
7 |
75.5 |
84 |
19.6 |
|
60 |
Vermont |
USA |
25.1 |
58 |
30.5 |
16 |
67.5 |
76 |
21.3 |
|
61 |
Wyoming |
USA |
25.0 |
25 |
48.7 |
86 |
16.0 |
83 |
19.8 |
|
62 |
Brandenburg |
DEU |
24.7 |
42 |
39.4 |
85 |
16.0 |
60 |
27.7 |
|
63 |
Trentino |
ITA |
24.3 |
53 |
32.4 |
57 |
35.3 |
51 |
32.8 |
|
64 |
Umbria |
ITA |
23.8 |
76 |
23.7 |
66 |
30.6 |
54 |
31.6 |
|
65 |
Saxony-Anhalt |
DEU |
23.1 |
60 |
29.8 |
77 |
24.9 |
79 |
20.2 |
|
66 |
Iowa |
USA |
22.6 |
68 |
27.3 |
83 |
19.9 |
57 |
30.4 |
|
67 |
Tennessee |
USA |
22.2 |
52 |
32.9 |
72 |
27.1 |
70 |
22.6 |
|
68 |
Nebraska |
USA |
22.0 |
44 |
38.0 |
74 |
25.5 |
80 |
20.1 |
|
69 |
Kentucky |
USA |
21.5 |
78 |
23.3 |
10 |
71.9 |
85 |
18.2 |
|
70 |
Nevada |
USA |
21.1 |
70 |
27.2 |
67 |
30.6 |
69 |
22.7 |
|
71 |
Prince Edward Island |
CAN |
21.1 |
81 |
21.5 |
26 |
56.3 |
67 |
23.0 |
|
72 |
Manitoba |
CAN |
21.0 |
57 |
31.0 |
53 |
37.3 |
72 |
21.8 |
|
73 |
Nova Scotia |
CAN |
21.0 |
65 |
28.9 |
50 |
38.9 |
68 |
22.7 |
|
74 |
North Dakota |
USA |
18.8 |
72 |
26.1 |
69 |
29.6 |
75 |
21.6 |
|
75 |
South Carolina |
USA |
18.2 |
67 |
28.1 |
78 |
23.9 |
74 |
21.7 |
|
76 |
Campania |
ITA |
17.5 |
90 |
12.5 |
84 |
17.8 |
55 |
31.2 |
|
77 |
Louisiana |
USA |
17.3 |
22 |
52.2 |
87 |
15.6 |
95 |
8.6 |
|
78 |
Alabama |
USA |
16.3 |
75 |
24.0 |
91 |
13.3 |
65 |
23.4 |
|
79 |
Aosta Valley |
ITA |
15.4 |
84 |
19.2 |
76 |
24.9 |
71 |
22.4 |
|
80 |
Montana |
USA |
15.2 |
54 |
32.0 |
94 |
9.4 |
87 |
17.2 |
|
81 |
Basilicata |
ITA |
15.1 |
87 |
16.3 |
41 |
43.2 |
78 |
20.3 |
|
82 |
Oklahoma |
USA |
14.9 |
79 |
23.0 |
58 |
35.1 |
86 |
17.5 |
|
83 |
New Brunswick |
CAN |
14.4 |
80 |
22.9 |
60 |
32.8 |
88 |
17.0 |
|
84 |
Newfoundland and Labrador |
CAN |
13.7 |
92 |
12.1 |
61 |
32.5 |
73 |
21.8 |
|
85 |
Hawaii |
USA |
13.4 |
66 |
28.3 |
95 |
8.9 |
90 |
15.0 |
|
86 |
Molise |
ITA |
13.2 |
91 |
12.4 |
93 |
13.0 |
62 |
25.8 |
|
87 |
Saskatchewan |
CAN |
12.8 |
62 |
29.4 |
92 |
13.1 |
89 |
15.2 |
|
88 |
Sardinia |
ITA |
12.2 |
89 |
12.8 |
90 |
14.6 |
66 |
23.1 |
|
89 |
South Dakota |
USA |
11.9 |
88 |
16.1 |
45 |
40.8 |
92 |
13.4 |
|
90 |
Alaska |
USA |
11.6 |
82 |
20.4 |
73 |
26.5 |
94 |
11.3 |
|
91 |
Arkansas |
USA |
9.0 |
86 |
17.3 |
71 |
27.2 |
91 |
14.2 |
|
92 |
Apulia |
ITA |
8.6 |
93 |
7.7 |
88 |
14.9 |
77 |
20.8 |
|
93 |
West Virginia |
USA |
8.2 |
83 |
19.3 |
29 |
51.5 |
96 |
4.8 |
|
94 |
Sicily |
ITA |
7.0 |
96 |
4.9 |
89 |
14.8 |
81 |
20.0 |
|
95 |
Calabria |
ITA |
5.8 |
95 |
5.2 |
96 |
5.2 |
82 |
20.0 |
|
96 |
Mississippi |
USA |
4.9 |
94 |
6.2 |
56 |
36.0 |
93 |
11.4 |
|
30 |
Median German state |
44.1 |
37 |
41.5 |
31 |
50.6 |
24 |
46.9 |
|
|
47 |
Median U.S. state |
33.8 |
41 |
39.3 |
56 |
36.3 |
51 |
32.9 |
|
|
61 |
Median Italian region |
24.9 |
77 |
23.7 |
53 |
37.5 |
53 |
32.2 |
|
|
72 |
Median Canadian province |
21.1 |
60 |
30.2 |
51 |
38.8 |
68 |
22.8 |
|
|
28 |
Average German state |
50.4 |
32 |
49.9 |
34 |
53.5 |
28 |
51.1 |
|
|
47 |
Average U.S. state |
35.6 |
44 |
41.9 |
53 |
39.3 |
51 |
36.1 |
|
|
60 |
Average Canadian province |
27.5 |
50 |
38.1 |
44 |
45.6 |
64 |
26.2 |
|
|
62 |
Average Italian region |
25.2 |
73 |
22.6 |
52 |
40.6 |
51 |
32.8 |
|
Knowledge Economy
Why Is It Important?
Knowledge and skills lie at the heart of any country, state, or region’s innovation and competitive potential. A knowledge-based economy possesses a greater relative stock of human capital that can be more efficiently deployed in the research, development, and production of new or improved products, processes, or services. Knowledge-intensive economies are also more likely to be leaders in the discovery of new knowledge, thereby improving their competitiveness in an innovation-driven global economy.
This category comprises four indicators: 1) the share of the 25–64-year-old population with a bachelor’s degree (or equivalent) or higher; 2) the share of the population that is foreign born and has tertiary education; 3) the share of total employees working in PTS activities; and 4) gross value added (GVA) per worker in the manufacturing sector.
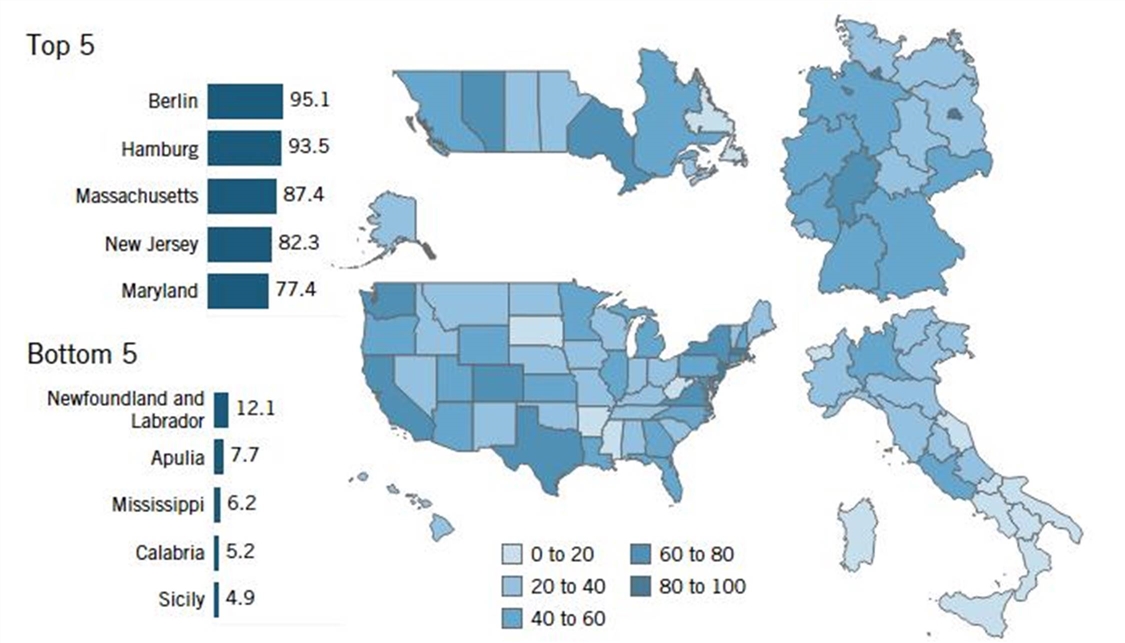
Figure 2: Knowledge Economy category scores
The Rankings
Germany possesses the clear advantage in this category, notching the top spot, the highest median score, and by far the best-scoring worst performer when comparing the lowest-ranked regions in each country. (See Figure 2.) Italy, in contrast, claims the lowest-scoring region of the four countries, the lowest median score, and by far the worst-scoring best performer.
Regional disparities are less pronounced in this category than they are for overall scores, as differences tend to be larger between the countries than within them compared with overall scores. With the exception of the United States, each country’s highest-scoring region in this category is the one that contains the nation’s capital.
Canada’s strength in this category lies in its share of educated immigrants, while its weakness lies in its low manufacturing labor productivity. Canada’s highest-scoring province in this category is Ontario, which ranks 8th. Ontario ranks 1st in skilled immigration; 10th in its share of employees in PTS services; and 16th in university-educated population share. Alberta and British Columbia also rank in the top 20 in the knowledge economy category.
Germany’s strengths lie in its share of employees working in PTS services and in its share of educated immigrants. Germany has no clear weaknesses in this category, though it lags behind the United States and (to a lesser extent) Canada in the share of its population with a university degree. Berlin, Germany’s highest-scoring state in this category, is also the highest-scoring region in the category overall. Berlin ranks in the top five in each of the indicators in this category except for manufacturing labor productivity. Right behind Berlin is Hamburg, which ranks in the top 16 in each of the four indicators and second in PTS employment. Bremen is the only other German state to place in the top 10 in the category.
This is the indicator for which Italy most lags behind the other three countries, claiming the lowest median score, the lowest-scoring best performer, and the lowest-scoring region. Italy lags behind its peers in each of the four indicators that comprise this category, except for PTS employees as a share of total employees. Lazio is Italy’s best performer, though it only ranks 29th in the category. Lazio ranks 4th in PTS employment but no higher than 58th in any of the other three indicators.
The United States is the only country to compete closely with Germany in this category, though American states’ scores range widely, from 87.4 (Massachusetts) to 6.2 (Mississippi). The United States’ strengths come in the share of its population with a university education and in manufacturing labor productivity. The best-performing U.S. states are mostly found along its northeast coast, with Massachusetts, New Jersey, and Maryland each ranking in the top five. Each of these 3 states ranks in the top 10 in each indicator except for manufacturing labor productivity, and Massachusetts ranks first in the share of the population with a university education. Other notable standouts are California, Virginia, and Connecticut.
Table 3: Summary of country scores in overall TASICI Knowledge Economy category
|
Country |
Median Score |
Maximum Score |
Minimum Score |
Standard Deviation |
||
|
Canada |
30.2 |
65.4 |
(Ontario) |
12.1 |
(Newfoundland and Labrador) |
18.3 |
|
Germany |
41.5 |
95.1 |
(Berlin) |
29.8 |
(Saxony-Anhalt) |
19.5 |
|
Italy |
23.7 |
46.2 |
(Lazio) |
4.9 |
(Sicily) |
11.3 |
|
USA |
39.3 |
87.4 |
(Massachusetts) |
6.2 |
(Mississippi) |
18.4 |
|
ALL |
34.7 |
95.1 |
(Berlin) |
4.9 |
(Sicily) |
19.5 |
Highly Educated Population
Why Is It Important?
This indicator measures the share of a region’s 25–64-year-old (“prime age”) population with a bachelor’s degree (or equivalent) or higher. Education provides citizens with the skills and knowledge necessary to compete and innovate in the modern economy. While more time spent in school does not necessarily guarantee sufficient applied skills for the innovation economy—for example, the Council for Aid to Education found that 44 percent of current U.S. university graduates are not proficient in essential career skills—the proportion of highly educated residents remains a strong indicator of human capital.[10] Moreover, evidence suggests that more-educated individuals are more likely and willing to adopt new technological innovations.[11]
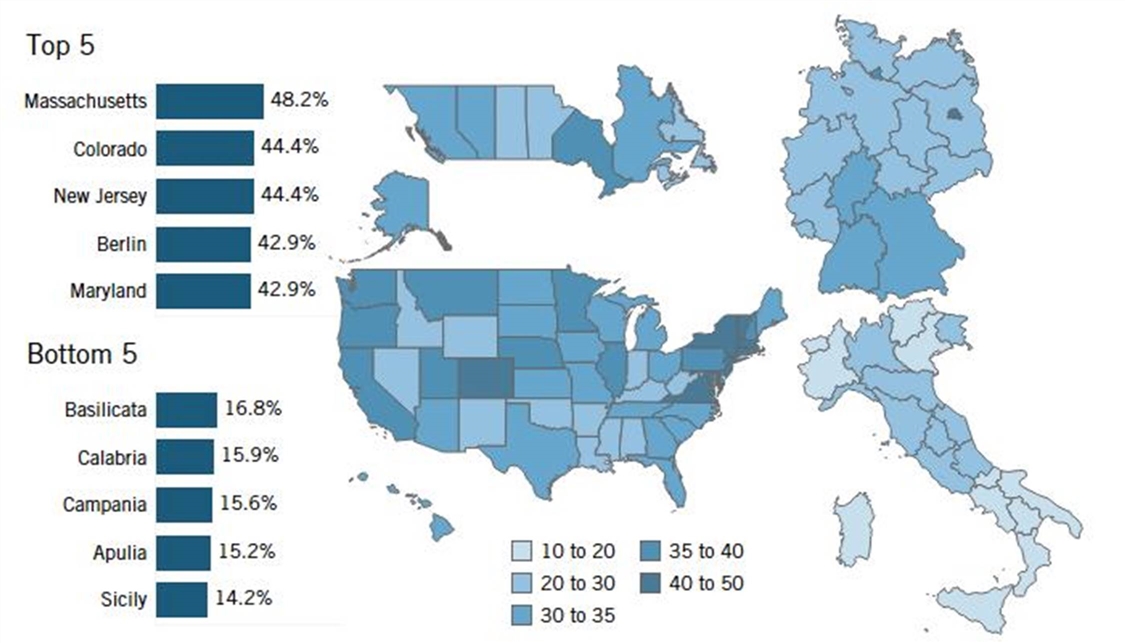
Figure 3: Share of the 25–64-year-old population with a bachelor's degree (or equivalent) or higher, 2019[12]
The Rankings
Massachusetts, Colorado, New Jersey, Berlin, and Maryland lead in this indicator, while Basilicata, Calabria, Campania, Apulia, and Sicily (all from Italy) rank lowest. (See Figure 3.) Overall, American states score better than their peers, while Canadian and German states perform closely in this indicator. Italy, on the other hand, lags far behind the other three countries; only 19.4 percent of prime-age residents in its median region have a bachelor’s degree or higher, compared with 33.5 percent for the median U.S. state.
In more than half of the Italian regions, less than one-fifth of the prime-age population has a bachelor’s degree or higher. North and central Italy perform better than southern Italy. Lazio, with a strong presence of universities and the ability to intercept internal flows of skilled talent, shows a ratio higher than 26 percent. Southern Italian regions do much worse, however, achieving only about 16 percent on average.
While it still scores fairly well, it should be noted that Germany is perhaps at a disadvantage in this indicator due to its promotion of trade schools and other alternatives to universities for much of its youth.
The regions containing the respective nations’ capital city tend to be the best-scoring regions in this indicator, with Massachusetts the sole exception. Nevertheless, Maryland and Virginia still score remarkably well, ranking fifth and seventh overall, respectively.
Table 4: Summary of country performance in TASICI Highly Education Population indicator
|
Country |
Median Score |
Maximum Score |
Minimum Score |
Standard Deviation |
||
|
Canada |
29.0% |
37.0% |
(Ontario) |
20.0% |
(Newfoundland and Labrador) |
4.7% |
|
Germany |
28.2% |
42.9% |
(Berlin) |
22.6% |
(Saxony-Anhalt) |
5.0% |
|
Italy |
19.4% |
26.1% |
(Lazio) |
14.2% |
(Sicily) |
2.9% |
|
USA |
33.5% |
48.2% |
(Massachusetts) |
22.8% |
(Mississippi) |
5.7% |
|
ALL |
29.6% |
48.2% |
(Massachusetts) |
14.2% |
(Sicily) |
7.5% |
Skilled Immigration
Why Is It Important?
Skilled immigration brings together workers with unique educational experiences and backgrounds as a driver of innovative ideas. Level of skill can be difficult to quantify, so this indicator is instead measured via educational attainment, calculated as a region’s share of foreign-born workers with at least some tertiary education relative to the total regional population. A 2016 ITIF study finds that foreign-born workers living in the United States are highly represented in the number of scientists and engineers producing meaningful innovations, compared with the overall levels of immigration in the United States.[13] Similarly, half of Silicon Valley’s artificial intelligence (AI) start-ups have foreign-born founders.[14]A separate study finds that 52 percent of all Silicon Valley start-ups have at least one foreign-born founder.[15] In addition to contributing to a state’s stock of skilled human capital, highly educated immigrant populations raise wages for both domestic- and foreign-born workers.[16]
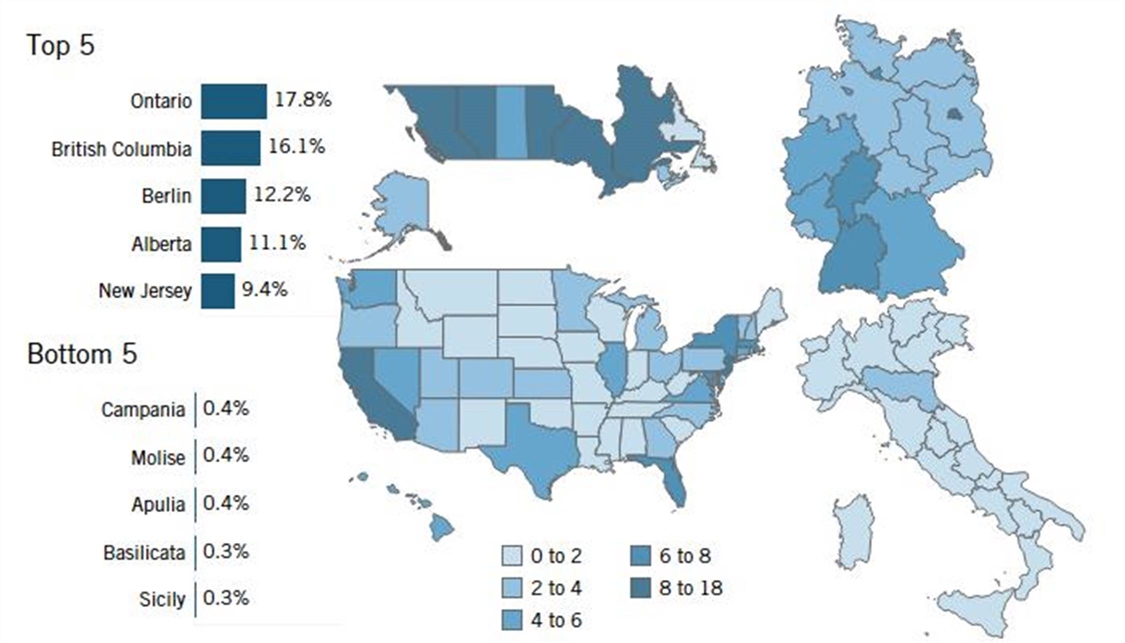
Figure 4: Share of population that is foreign born and has some tertiary education, 2019[17]
The Rankings
Canada performs very well in this indicator, counting three provinces—Ontario, British Columbia, and Alberta—among the top five regions, likely due to a favorable immigration system that includes regulatory pathways for hiring foreign-born workers and securing permanent-residency permits.[18] (See Figure 4.)
These rankings also reflect important trends in immigration laws, which might explain why the United States performs relatively worse than its peers. Immigration caps, such as those in the United States that hold H-1B visas to 85,000 per year, negatively impact overall levels of skilled immigration.[19]
With regard to the immigration of foreign-born residents that are highly educated, Italy records extremely low percentages compared with most advanced economies. Certain regions that are equipped with a very specialized industrial system score the highest in Italy; however, Italy’s best performer in this indicator, Emilia-Romagna, still only has a skilled-immigrant population share of just 2.1 percent. Other regions with a strong manufacturing presence follow (Friuli Venezia Giulia, Tuscany, and Lombardy). On the contrary, the southern regions (especially Basilicata, Sicily, and Apulia) have a lower share of highly educated foreign-born residents compared with the total regional population at less than 0.5 percent.
Table 5: Country performance in TASICI Highly Skilled Immigration indicator
|
Median Score |
Maximum Score |
Minimum Score |
Standard Deviation |
|||
|
Canada |
7.2% |
17.8% |
(Ontario) |
1.1% |
(Newfoundland and Labrador) |
5.4% |
|
Germany |
4.2% |
12.2% |
(Berlin) |
2.1% |
(Saxony-Anhalt) |
2.5% |
|
Italy |
1.1% |
2.1% |
(Emilia-Romagna) |
0.3% |
(Sicily) |
0.6% |
|
USA |
2.4% |
9.4% |
(New Jersey) |
0.5% |
(Mississippi) |
2.1% |
|
ALL |
2.5% |
17.8% |
(Ontario) |
0.3% |
(Sicily) |
3.2% |
Professional, Technical, and Scientific Employment
Why Is It Important?
This indicator measures the share of employees working in PTS activities in each region. This includes, for example, engineers, researchers, and lawyers. PTS services include those needed to facilitate the development, implementation, and commercialization of innovations. Automation and globalization also make high-value-added professional services increasingly important in the modern economy. These occupations are highly knowledge-intensive and therefore harder to offshore. States with greater concentrations in these occupations are thus less threatened by increased levels of globalization.
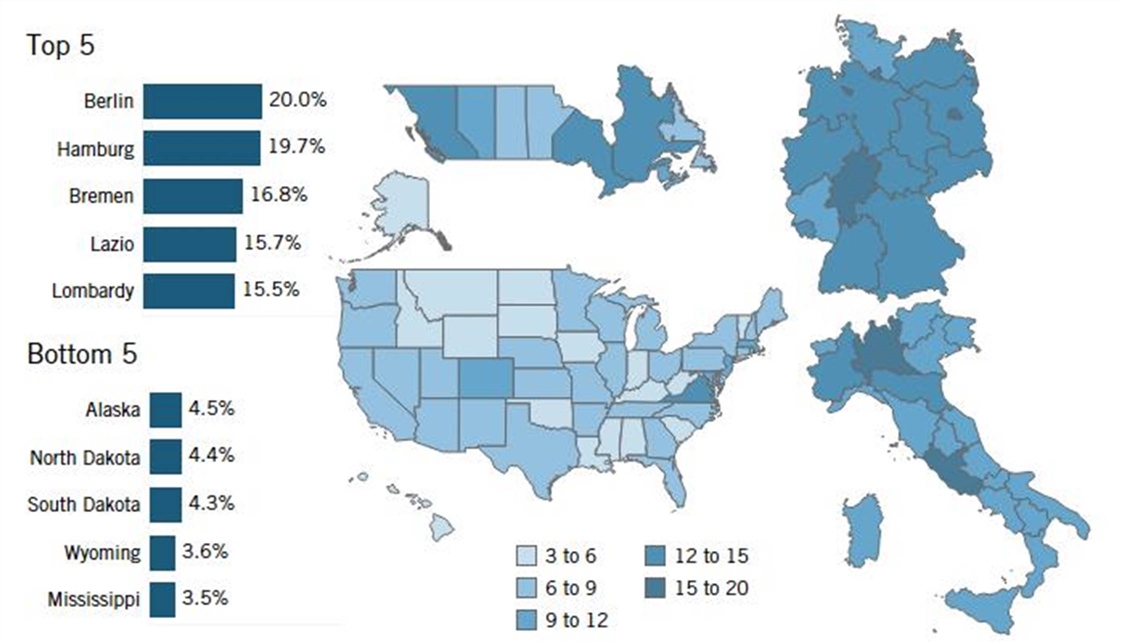
Figure 5: Share of employees in professional, technical, and scientific services fields, 2019[20]
The Rankings
The two European countries score better than their North American counterparts in this indicator. The median German state has 12.9 percent of its employees working in PTS activities, and Germany claims the three highest-scoring regions—Berlin, Hamburg, and Bremen (large cities all)—while Italy produces the other two top-five regions with Lazio and Lombardy. (See Figure 5.)
Ontario is the only province in North America to score in the top 10 (10th), with 13.3 percent of its employees in PTS fields. Notably—though perhaps unsurprisingly—the best-scoring region within each country is the region containing or bordering the country’s capital. The American states of Alaska, North Dakota, South Dakota, Wyoming, and Mississippi fare poorest in this indicator.
Italy performs remarkably well in PTS employment as a share of total employment. Lazio and Lombardy, which benefit from many universities and research centers of national importance, register a share of more than 15 percent, among the highest percentages of the regions covered in this report. However, most of the Italian regions have a ratio of at least 11 percent (the national median is 11 percent), and in some regions of southern Italy, less than 1 out of 10 employees work in PTS sectors.
Table 6: Country performance in TASICI Professional, Technical, and Scientific Employment indicator
|
Country |
Median Score |
Maximum Score |
Minimum Score |
Standard Deviation |
||
|
Canada |
9.5% |
13.3% |
(Ontario) |
7.4% |
(Saskatchewan) |
2.2% |
|
Germany |
12.9% |
20.0% |
(Berlin) |
10.6% |
(Rhineland-Palatinate) |
2.6% |
|
Italy |
11.0% |
15.7% |
(Lazio) |
9.7% |
(Molise) |
1.6% |
|
USA |
6.9% |
12.3% |
(Virginia) |
3.5% |
(Mississippi) |
1.8% |
|
ALL |
8.5% |
20.0% |
(Berlin) |
3.5% |
(Mississippi) |
3.4% |
Manufacturing Labor Productivity
Why Is It Important?
GVA measures the contribution to GDP made by an individual producer, industry, or sector. This indicator measures the average GVA per manufacturing worker on a purchasing power parity (PPP) basis. Within manufacturing, high-value-added firms are most often capital intensive, producing more technologically complex products and organizing their workers to take better advantage of their skills. They typically pay higher wages because their workers are more productive, generating greater value for each hour worked. All else being equal, firms with higher-value-added levels are more likely to be able to meet global competitiveness challenges. Unfortunately, U.S. manufacturing labor productivity has been in decline for some time, falling by 1.34 percent between 2012 and 2019.[21]
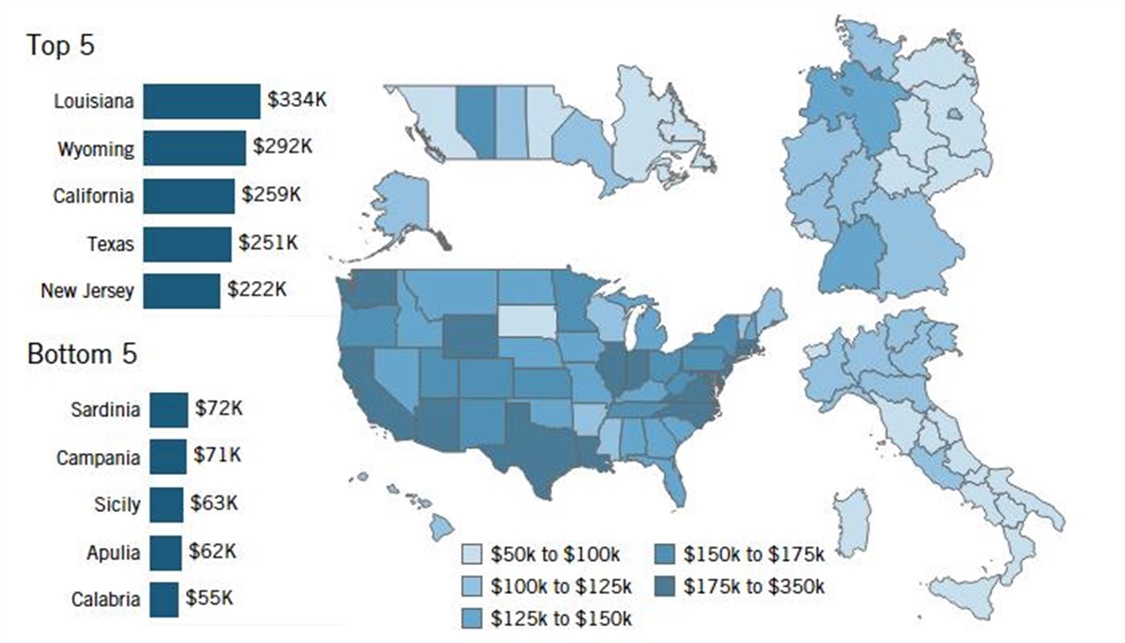
Figure 6: PPP-adjusted gross value added per worker in the manufacturing sector, 2019[22]
The Rankings
Perhaps surprisingly, the United States scores much better than the other three countries in general, with Louisiana, Wyoming, California, Texas, and New Jersey topping this indicator. (See Figure 6.) The median U.S. state recorded a GVA per worker in the manufacturing sector $40,000 higher than the median German state, $58,000 higher than the median Canadian province, and $59,000 higher than the median Italian region.
The Italian regions of Sardinia, Campania, Sicily, Apulia, and Calabria score weakest in this indicator. For many years, the stagnant trend in the added value of Italian workers has been considered one of the main causes of Italy’s sluggish aggregate growth compared with the major Western countries. Even the regions that perform better in Italy (e.g., Lombardy and Emilia Romagna) perform poorly when compared with regions from other high-income countries. Moreover, the Italian regions with a lower performance (Calabria, Apulia, and Sicily) show productivity values that are almost one-half that of the more advanced Italian regions. Therefore, this is one of the areas where the gap between the Italian regions and the others is most significant.
U.S. states likely score so well for two reasons. The first is that the U.S. manufacturing sector is more heavily concentrated in higher-value-added industries in both the high-tech sector (e.g., aerospace, biopharmaceuticals, and semiconductors) and the energy-producing sectors (e.g., petroleum/coal manufacturing and chemical manufacturing). This effect is especially compounded by Europe’s significantly reduced domestic energy production (reflecting, notably, the German manufacturing sector’s large dependence on imported Russian natural gas).
The significance of energy production in this indicator is especially evident in the two perhaps-surprising leading regions: Louisiana and Wyoming. In 2019, the petroleum/coal manufacturing and chemical manufacturing industries accounted for 74 percent of manufacturing output in Louisiana and 67 percent in Wyoming.[23] Workers in these industries also command higher wages. In 2021, the average wage in the petroleum/coal manufacturing industry and chemical manufacturing industry in the United States was $44.98 and $35.17, respectively, compared with $29.70 for the manufacturing sector overall.[24]
Another reason the United States scores so well in this indicator is that, while its manufacturing sector is shrinking and it manufactures fewer goods, it still performs the higher-value-added tasks in the production process. For example, despite its share of global semiconductor fabrication falling from 37 percent in 1990 to 12 percent in 2020, the United States still accounts for nearly 50 percent of global value added in the semiconductor industry thanks to its significant involvement in the design- and R&D-intensive aspects of the semiconductor production process (and statistical data still counts this as manufacturing-sector output).[25]
Table 7: Country performance in TASICI Manufacturing Labor Productivity indicator
|
Median Score |
Maximum Score |
Minimum Score |
Standard Deviation |
|||
|
Canada |
$93K |
$162K |
(Alberta) |
$79K |
(Nova Scotia) |
$23K |
|
Germany |
$111K |
$173K |
(Hamburg) |
$74K |
(Mecklenburg-Vorpommern) |
$25K |
|
Italy |
$92K |
$117K |
(Liguria) |
$55K |
(Calabria) |
$18K |
|
USA |
$151K |
$334K |
(Louisiana) |
$95K |
(South Dakota) |
$48K |
|
ALL |
$123K |
$334K |
(Louisiana) |
$55K |
(Calabria) |
$49K |
Globalization
Why Is It Important?
Today’s economy is increasingly globalized, relying on international trade, global supply chains, and foreign investment. Maintaining and gaining a competitive edge in the global economy is paramount to the future growth prospects of all countries and regions.
This category comprises two indicators: 1) Inward FDI attracted relative to GDP and 2) high-tech exports (NAICS 333–335 or equivalent) as a share of GDP.
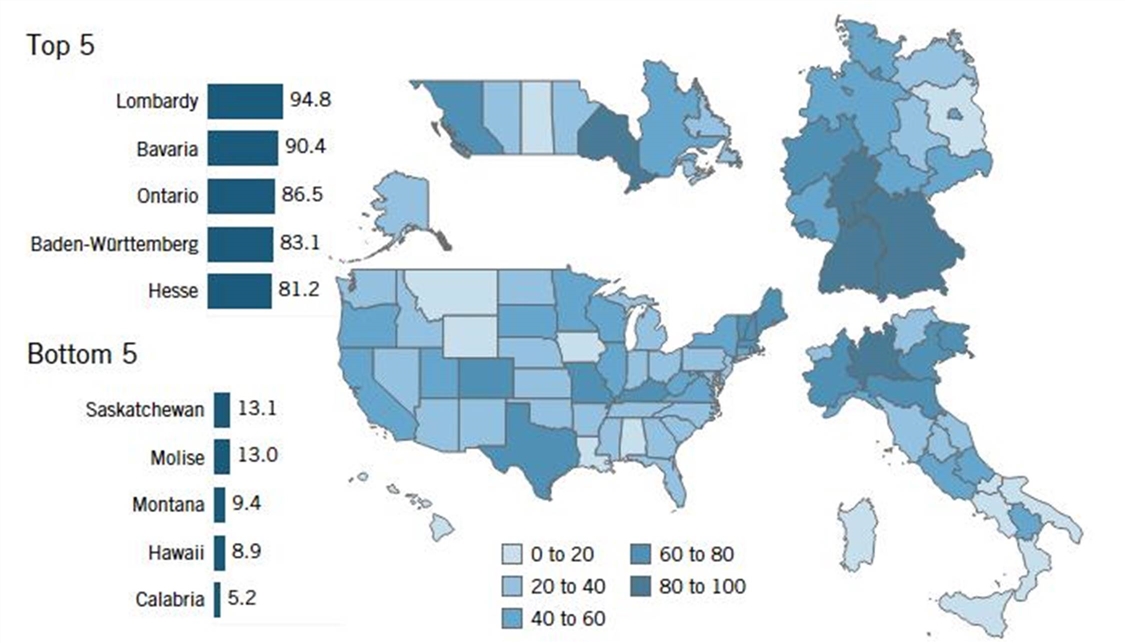
Figure 7: Globalization category scores
The Rankings
Germany scores far better than the other countries overall, which is unsurprising given its place in the European Union’s single market and its high export intensity. However, the top spot goes to Lombardy, which is followed by Bavaria, Ontario, Baden-Württemberg, and Hesse. Saskatchewan, Molise, Montana, Hawaii, and Calabria are the worst-ranking regions in the category. (See Figure 7.)
Canada scores well in this category thanks to its ability to attract FDI. In general, Canada performs best in attracting inward FDI and worst in the high-tech exports indicator. Canada’s best-performing province is again Ontario, which ranks 3rd in FDI relative to GDP and 24th in high-tech exports relative to GDP. Though there are no other Canadian provinces in the top 10, British Columbia ranks 17th due to its top-5 ranking in FDI.
As mentioned, overall German states considerably outperform those from the other three countries in this category (the median score for German states is 50.6, while the median scores for the other countries are each below 40), though Germany only claims 3 of the top-10 regions. Germany’s best performer is Bavaria, which ranks second both in the general globalization category and in high-tech exports. Baden-Württemberg and Hesse both also rank in the top five. In Baden-Württemberg’s case, this is because it ranks first in high-tech exports. Hesse, on the other hand, ranks in the top 15 in both high-tech exports and FDI.
Italy performs only middlingly because of the disparity between its northern and central regions and its southern regions. Lombardy in Italy’s north scores first overall in this category, while Calabria, in Italy’s south, scores last. Lombardy claims the top spot due to ranking 8th in FDI and 12th in high-tech exports. Piedmont and Emilia-Romagna both also rank in the top 10 and Friuli-Venezia Giuli ranks 11th. For all three regions, this is due to their high concentration of high-tech exports.
The United States lags behind the other three countries due to its generally low concentration of high-tech exports. Though it contains 7 of the top-20 scoring regions in the category, Maine is the United States’ best performer in the category, as it ranks 1st in FDI (though only 79th in high-tech exports). Missouri and Kentucky also rank in the top 10 in the category, as both also rank top 5 in FDI.
Table 8: Country performance in TASICI Globalization category
|
Country |
Median Score |
Maximum Score |
Minimum Score |
Standard Deviation |
||||
|
Canada |
38.3 |
86.5 |
(Ontario) |
13.1 |
(Saskatchewan) |
19.6 |
||
|
Germany |
50.6 |
90.4 |
(Bavaria) |
16.0 |
(Brandenburg) |
20.7 |
||
|
Italy |
37.5 |
94.8 |
(Lombardy) |
5.2 |
(Calabria) |
24.6 |
||
|
USA |
36.3 |
75.5 |
(Maine) |
8.9 |
(Hawaii) |
17.8 |
||
|
ALL |
39.8 |
94.8 |
(Lombardy) |
5.2 |
(Calabria) |
20.7 |
||
High-Tech Exports
Why Is It Important?
This indicator measures a region’s exports in the machinery manufacturing, computer, and electronic products manufacturing, and electrical equipment, appliances, and components manufacturing industries (NAICS 333–335 or equivalent) as a share of GDP. These represent high-value-added goods that are crucial in the modern global economy. Considering a state’s exports of these goods as a share of its GDP shows to what extent a region has a comparative advantage in production. Moreover, this indicator represents a region’s position in global value chains to produce these goods.
Figure 8: Exports in NAICS 333–335 (or equivalent) as a share of GDP, 2017[26]

The Rankings
The European countries perform much better than their North American counterparts in general, with Baden-Württemberg, Bavaria, Saarland, Saxony, and Emilia-Romagna taking the top five spots. (See Figure 8.)
The median German state’s exports of these goods accounts for a larger share of GDP than that of the best-performing region in either Canada (Ontario) or the United States (Vermont). This is largely thanks to Germany’s involvement in the European Union’s single market and close proximity to many smaller and therefore more trade-intensive countries. For example, a shipment of high-tech goods from Texas to Indiana (1,100 miles) will not register as an export, but a similar shipment from Bavaria to Salzburg (140 miles) will.
Germany’s worst-performing state (Brandenburg) still scores better than the median Canadian or U.S. region. Regional disparities are especially apparent in the European countries, with the best-performing German states hailing from the country’s south and the best-performing Italian regions from the country’s north. The median German state’s exports of these goods accounts for a larger share of GDP than that of the best-performing region in either Canada (Ontario) or the United States (Vermont).
Italy, well known for its export-led economy, stands out for its innovative exported products. With one of the highest export-to-GDP ratios among advanced countries and northern Italy’s concentration of advanced industries, Italian regions excel in high-tech exports as a share of GDP. Emilia Romagna, Friuli Venezia Giulia, and Piedmont––three regions in the country’s north with a high concentration of advanced industries––record high-tech exports equal to over 8 percent of GDP. The share decreases as one moves toward the south of the Italian peninsula, however. Overall, high-tech exports account for less than 2 percent of GDP in 6 of Italy’s 20 regions.
Table 9: Country performance in TASICI High-tech Exports Indicator
|
Country |
Median Score |
Maximum Score |
Minimum Score |
Standard Deviation |
||
|
Canada |
1.2% |
4.3% |
(Ontario) |
0.2% |
(Newfoundland & Labrador) |
1.3% |
|
Germany |
6.2% |
14.1% |
(Baden-Württemberg) |
1.9% |
(Brandenburg) |
3.3% |
|
Italy |
3.7% |
8.7% |
(Emilia-Romagna) |
0.2% |
(Calabria) |
2.7% |
|
USA |
1.5% |
6.1% |
(Vermont) |
0.0% |
(Hawaii) |
1.3% |
|
ALL |
2.0% |
14.1% |
(Baden-Württemberg) |
0.0% |
(Hawaii) |
2.8% |
Inward FDI
Why Is It Important?
This indicator measures the inward FDI a region receives relative to its GDP measured as the funds an entity in the region receives from a foreign-based entity to purchase, establish, or expand enterprises. Inward FDI not only spurs domestic economic activity but also facilitates technology transfer between foreign-owned enterprises and local establishments. Foreign owners can also introduce domestic firms to new international markets and help regions carve out positions in global supply chains. Inward FDI has also been associated with greater economic growth in market economies and tends to be more productive and induce greater levels of investment by domestic firms.[27]
Because FDI can be very volatile from year to year, regions’ averages over the period 2017–2019 are considered. Measures for each country required varying degrees of estimation, the methods for which are described in the appendix.
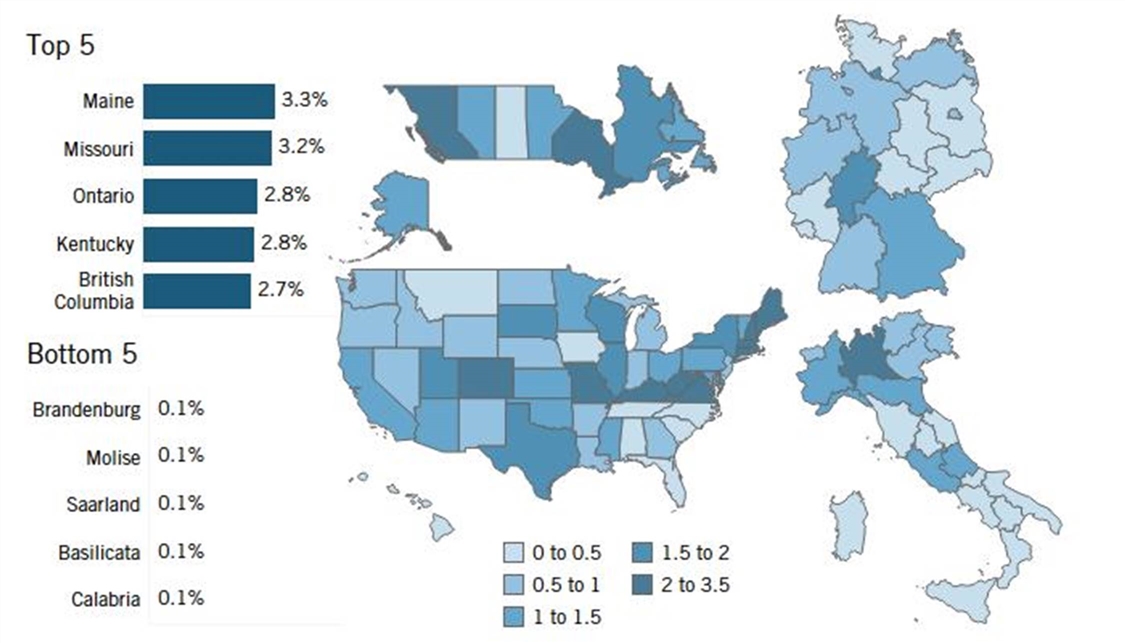
Figure 9: Inward foreign direct investment as a percentage of GDP, 2017–2018 (average)[28]
The Rankings
Canada claims the highest median score, and the United States claims the highest-scoring region, Maine, which is followed by Missouri, Ontario, Kentucky, and British Colombia. (See Figure 9.) Despite their inclusion in the European Union’s single market, the European states receive noticeably less FDI relative to their GDP than their North American counterparts.
FDI inflows are quite low relative to GDP in the Italian regions. Lombardy is the exception, attracting on average 2.5 percent of its GDP in FDI between 2017 and 2019. The divide between north and south is apparent in Italy in terms of FDI, as Italy’s southern regions still clearly perform worse than its northern and central regions.
German regions find themselves in a similar position. The median German state only attracted 0.5 percent of its GDP in FDI on average between 2017 and 2019. Again, even when accounting for the size of the states’ economies, most of the FDI went to Germany’s western and southern states.
Table 10: Country performance in TASICI Inward FDI indicator
|
Country |
Median Score |
Maximum Score |
Minimum Score |
Standard Deviation |
||
|
Canada |
1.5% |
2.8% |
(Ontario) |
0.3% |
(Saskatchewan) |
0.7% |
|
Germany |
0.5% |
2.0% |
(Hamburg) |
0.1% |
(Saarland) |
0.6% |
|
Italy |
0.6% |
2.5% |
(Lombardy) |
0.1% |
(Calabria) |
0.6% |
|
USA |
1.1% |
3.3% |
(Maine) |
0.2% |
(Montana) |
0.8% |
|
ALL |
0.9% |
3.3% |
(Maine) |
0.1% |
(Calabria) |
0.8% |
Innovation Capacity
Why Is It Important?
A region’s ability to innovate is crucial to its sustainable long-term economic growth. Regions with greater capacities for innovation command a greater competitive advantage in improving and commercializing current technologies and creating disruptive new technologies for the future. A strong innovation capacity relies on investments in research from both the private and public sectors, access to and adoption of modern technologies—particularly information and communication technologies (ICTs) in an increasingly digital world—and a business environment conducive to creative destruction.
The category comprises seven indicators: 1) the share of households adopting broadband Internet; 2) R&D intensity; 3) R&D personnel as a share of total employees; 4) PCT patent applications per capita; 5) enterprise birth rates; 6) greenhouse gas emissions per unit of output; and 7) VC investments received relative to GDP.
Figure 10: Innovation Capacity category scores
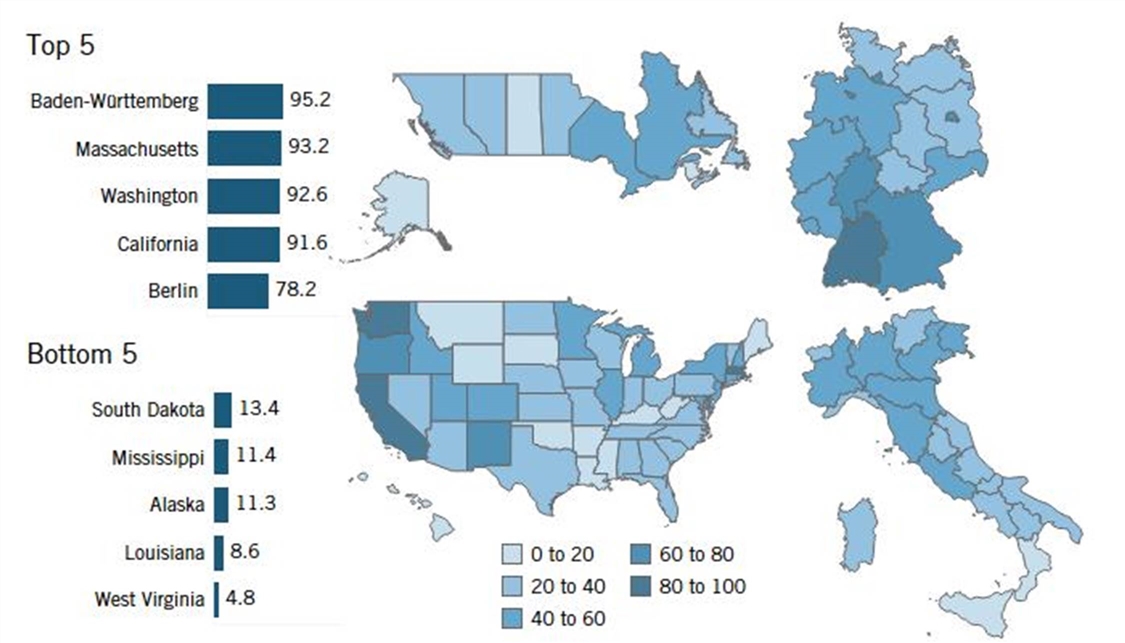
The Rankings:
Overall, Baden-Württemberg tops this category, followed by Massachusetts, Washington, California, and Berlin. South Dakota, Mississippi, Alaska, Louisiana, and West Virginia score the worst (giving the United States the five lowest-scoring regions in this category). (See Figure 10.)
Germany performs best in the broadband adoption and R&D-related indicators, and there is no indicator in this category for which Germany performs especially poorly. Baden-Württemberg, the best-performing region in the category, ranks first in R&D personnel, second in patent output, fifth in R&D intensity, and seventh in carbon efficiency. It also ranks 9th in broadband adoption (tied with Bavaria) and 12th in VC received. Berlin joins Baden-Württemberg in the top 5, and Bavaria, Hesse, and Hamburg also place in the top 10 in the category.
Canada clearly scores the weakest overall in this category, though its worst-scoring provinces perform better than the United States’ worst-performing states. Canada especially struggles with respect to R&D (both intensity and personnel), patent output, business creation, and carbon efficiency. Canada’s best-performing province is once again Ontario, though it ranks only 35th. Quebec ranks 36th in the category, and British Columbia ranks 45th.
Italy scores surprisingly well in this category thanks to impressive performances in R&D personnel, business creation, and carbon efficiency, with its median score eclipsing that of the United States. Emilia-Romagna, its highest-scoring region, ranks 13th in the category, driven by a 2nd-place ranking in R&D personnel. Emilia-Romagna also ranks 20th in patent output and 22nd in carbon efficiency.
The United States’ median score and those of its worst-performing states are surprisingly low. This is due to poor overall performances in R&D personnel and carbon efficiency. However, the United States claims several of the top performers, as Massachusetts, Washington, and California all rank in the top five thanks to their high R&D intensities, high patent output, and high VC intensity. The United States also performs very well in business creation. One notable standout in the United States is New Mexico, which ranks 9th in the category thanks to having the highest R&D intensity and 5th-highest R&D personnel concentration due to the presence of the Los Alamos and Sandia National Laboratories in the state. However, New Mexico does not rank higher than 40th in any of the other 5 indicators in the category. Although the United States claims these innovation capacity standouts, it also claims the 7 lowest-scoring regions in the category and 9 of the 11 lowest-scoring.
Table 11: Country performance in TASICI Innovation Capacity category
|
Country |
Median Score |
Maximum Score |
Minimum Score |
Standard Deviation |
||
|
Canada |
22.8 |
40.3 |
(Ontario) |
15.2 |
(Saskatchewan) |
8.7 |
|
Germany |
46.9 |
95.2 |
(Baden-Württemberg) |
20.2 |
(Saxony-Anhalt) |
19.5 |
|
Italy |
32.2 |
56.5 |
(Emilia-Romagna) |
20.0 |
(Calabria) |
9.9 |
|
USA |
32.9 |
93.2 |
(Massachusetts) |
4.8 |
(West Virginia) |
20.9 |
|
ALL |
33.8 |
95.2 |
(Baden-Württemberg) |
4.8 |
(West Virginia) |
19.2 |
Broadband Adoption
Why Is It Important?
This indicator measures broadband adoption—that is, the share of households within each region that subscribe to a broadband Internet connection, either mobile or fixed.[29] (All measures of broadband adoption used include satellite adoption as well). The Internet is now essential to full participation in today’s increasingly digital economy. The COVID-19 pandemic vividly demonstrated how crucial widespread Internet adoption is for societies, enabling telework, tele-education, telehealth, etc. Increased access to the Internet has also been associated with greater productivity and economic growth.[30]
Figure 11: Share of households that have adopted broadband Internet, 2019[31]
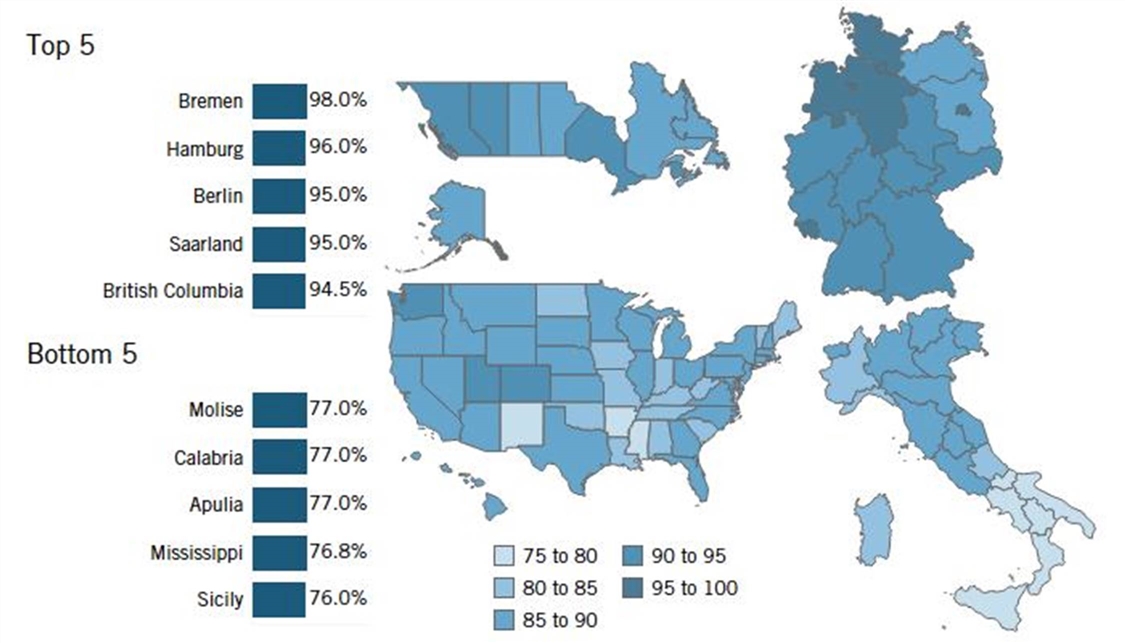
The Rankings
Bremen, Hamburg, Berlin, Saarland, and British Columbia lead this indicator, while Molise, Calabria, Apulia, Mississippi, and Sicily perform the worst. (See Figure 11.)
Germany performs noticeably better than the other countries in this indicator; it has the four best-performing regions and the highest median score of 94.0 percent. Regional disparities are less prevalent for the North American countries and Germany in this indicator than they are for others. In contrast, the north-south divide is still evident in Italy; Italy’s south claims four of the five worst-performing regions (including the worst-performing region). While Italy performs worse than the other three countries, it has made great progress in improving adoption rates in the past few years. Between 2017 and 2019 alone, Italy’s nationwide broadband adoption rate increased from 79 percent of households to 84 percent (compared with an increase from 89 percent to 91 percent for Canada, 92 percent to 94 percent for Germany, and 83.5 percent to 86.4 percent for the United States).
Table 12: Country performance in TASICI Broadband Adoption indicator
|
Country |
Median Score |
Maximum Score |
Minimum Score |
Standard Deviation |
||
|
Canada |
89.9% |
94.5% |
(British Columbia) |
88.1% |
(Quebec) |
2.1% |
|
Germany |
94.0% |
98.0% |
(Bremen) |
86.0% |
(Brandenburg) |
2.8% |
|
Italy |
84.5% |
88.0% |
(Trentino) |
76.0% |
(Sicily) |
4.2% |
|
USA |
86.0% |
91.2% |
(Washington) |
76.8% |
(Mississippi) |
3.1% |
|
ALL |
87.1% |
98.0% |
(Bremen) |
76.0% |
(Sicily) |
4.8% |
R&D Intensity
Why Is It Important?
This indicator measures R&D expenditures in a region relative to its GDP considering R&D expenditures by all sectors: business, government, and higher education. R&D lies at the heart of innovation, as it represents the source of the new knowledge needed to discover, design, and implement innovative technologies and products. R&D results in slightly higher private returns and much larger social returns than other types of investment as new knowledge and technology spill over to the rest of the economy.[32]
Figure 12: R&D expenditures as a share of GDP, 2019[33]
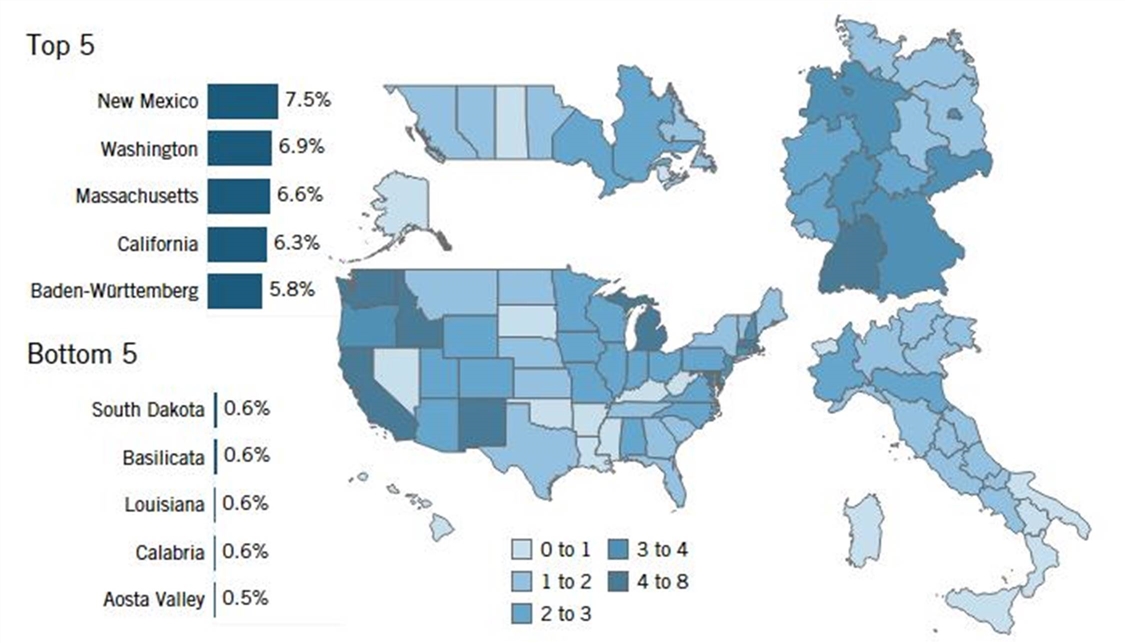
The Rankings
New Mexico, Washington, Massachusetts, California, and Baden-Württemberg top this indicator, while South Dakota, Basilicata, Louisiana, Calabria, and Aosta Valley perform weakest. (See Figure 12.) In Italy, only two regions (Piedmont and Emilia Romagna) have an R&D intensity higher than 2 percent, while there are seven regions with R&D intensities less than 1 percent. While Germany’s median state scores better than the median U.S. state, the United States claims four of the five best performers, including each of the top four. However, R&D intensity varies quite significantly among the U.S. states, and the United States also accounts for three of the five worst performers.
The best-performing region, New Mexico, benefits from large federal R&D investments through the Los Alamos National Laboratory and Sandia National Laboratories. The United States’ other R&D-intense states can typically be found along the east and west coasts (e.g., Washington, Massachusetts, and California), where they benefit from advanced university networks and a high concentration of technology-intensive industries. Baden-Württemberg too benefits from a high concentration of advanced industries, housing companies such as Mercedes-Benz, Porsche, and SAP. Surprisingly, the R&D intensities of the Canadian provinces more closely match those of the Italian regions despite performing far better in the knowledge economy indicators, particularly with respect to higher-education attainment and skilled immigration.
Table 13: Country performance in TASICI R&D Intensity indicator
|
Country |
Median Score |
Maximum Score |
Minimum Score |
Standard Deviation |
||
|
Canada |
1.3% |
2.2% |
(Quebec) |
0.9% |
(New Brunswick) |
0.4% |
|
Germany |
2.5% |
5.8% |
(Baden-Württemberg) |
1.5% |
(Saxony-Anhalt) |
1.0% |
|
Italy |
1.1% |
2.3% |
(Piedmont) |
0.5% |
(Aosta Valley) |
0.5% |
|
USA |
2.1% |
7.5% |
New Mexico) |
0.6% |
(Louisiana) |
1.7% |
|
ALL |
1.7% |
7.5% |
New Mexico) |
0.5% |
(Aosta Valley) |
1.4% |
R&D Personnel
Why Is It Important?
This indicator measures the number of R&D personnel as a share of all employees in each region. R&D personnel are indispensable to conducting R&D activities and turning investments into new productivity-enhancing knowledge and technologies.
Figure 13: R&D personnel as a share of total employees, 2017–2018[34]
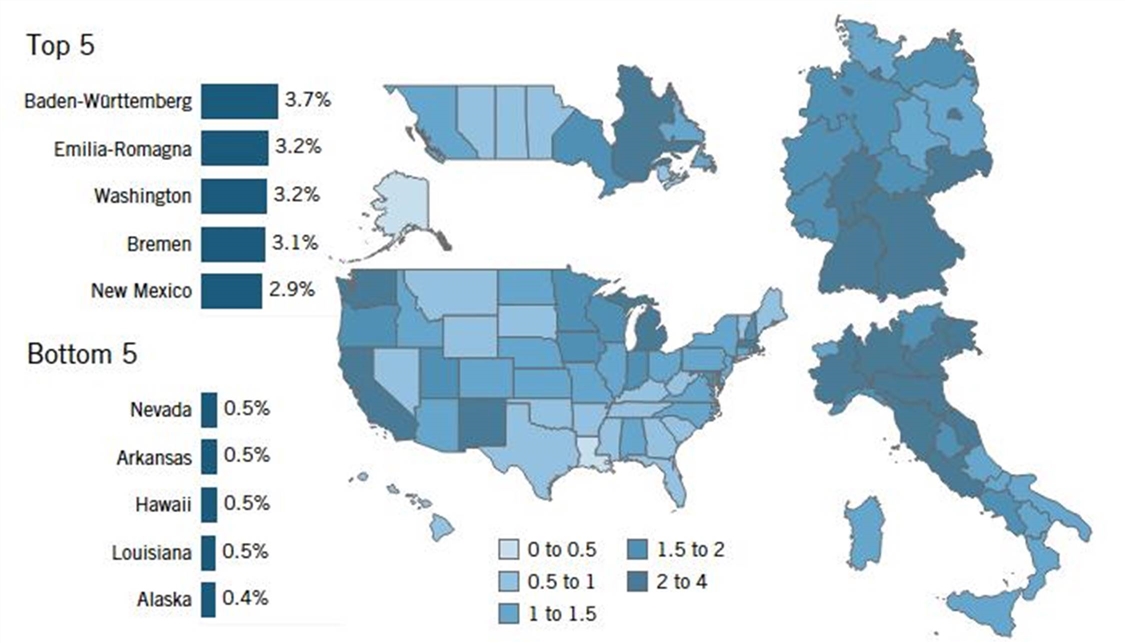
The Rankings
Baden-Württemberg, Emilia-Romagna, Washington, Bremen, and New Mexico lead, while Nevada, Arkansas, Hawaii, Louisiana, and Alaska perform the worst (again giving the United States the five-lowest performing regions in an indicator). (See Figure 13.)
Overall, the European regions perform better than their North American counterparts here. Except for the United States, each country’s best-performing region in R&D intensity is the best-performing region for R&D personnel as well. For the United States, Washington supplants New Mexico, though both score in the top five. Again, New Mexico scores well thanks to its national laboratories, which employ over half of the state’s R&D personnel.
Given its strong performance in R&D intensity, it is unsurprising that Germany performs outstandingly well in R&D personnel. On the other hand, Italy’s and the United States’ positions are somewhat surprising given the strong U.S. and weak Italian performances in R&D intensity (with Italy performing poorly in R&D intensity and well in R&D personnel and the opposite being true for the United States). This may be the result of the productivity factor, as U.S. R&D is generally more productive than R&D performed in Europe.[35] In other words, in general, the United States needs to employ fewer R&D personnel than do European nations to reach a similar level of R&D output.
Table 14: Country performance in TASICI R&D Personnel Intensity indicator
|
Country |
Median Score |
Maximum Score |
Minimum Score |
Standard Deviation |
||
|
Canada |
0.9% |
2.0% |
(Quebec) |
0.8% |
(New Brunswick) |
0.4% |
|
Germany |
1.9% |
3.7% |
(Baden-Württemberg) |
1.3% |
(Schleswig-Holstein) |
0.7% |
|
Italy |
1.8% |
3.2% |
(Emilia-Romagna) |
1.0% |
(Basilicata) |
0.6% |
|
USA |
1.2% |
3.2% |
(Washington) |
0.4% |
(Alaska) |
0.6% |
|
ALL |
1.4% |
3.7% |
(Baden-Württemberg) |
0.4% |
(Alaska) |
0.7% |
Patent Applications
Why Is It Important?
This indicator measures international Patent Cooperation Treaty (PCT) patent applications filed by residents or entities within a region per one million residents. Patent output measures the “inventiveness” of a population. Patents also secure private returns on investment in R&D activities, which are necessary to incentivize these activities and their socially desirable spillover effects. By considering PCT patents, this indicator focuses on internationally filed patents to mitigate differences in patent qualifications between countries’ patent offices.
Figure 14: PCT patent applications per million residents, 2015[36]
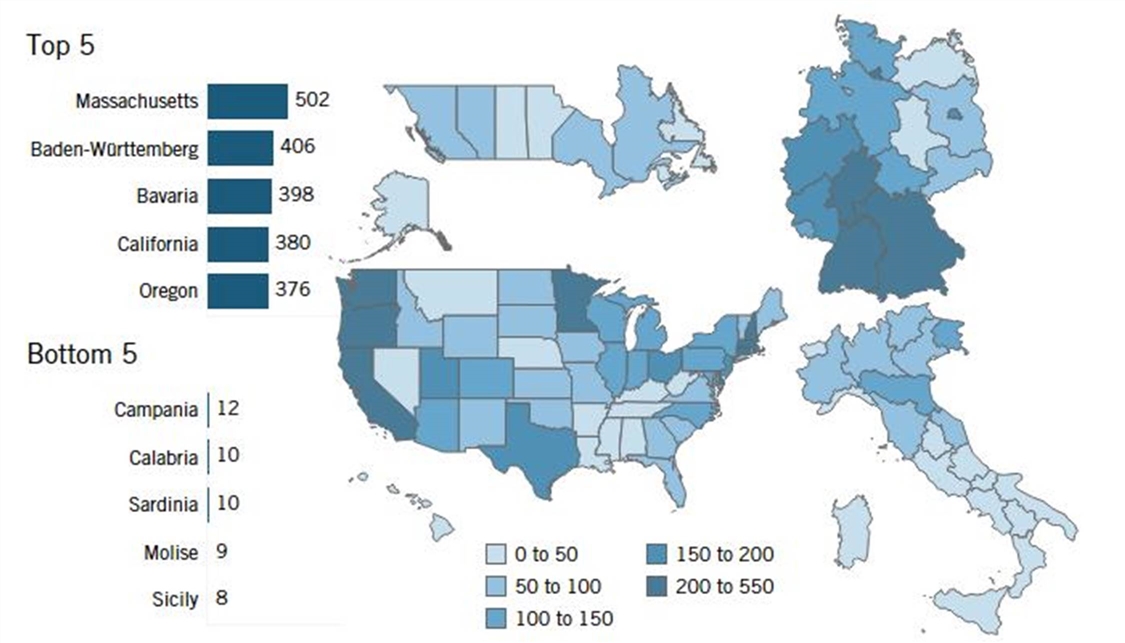
The Rankings
Germany and the United States perform better than their peers, with Massachusetts, Baden-Württemberg, Bavaria, California, and Oregon ranking in the top five. Italy fielded the five lowest-performing regions in this indicator: Campania, Calabria, Sardinia, Molise, and Sicily. (See Figure 14.)
Notably, however, there exists significant variation and regional disparities in PCT patent intensity among states across Germany and the United States. The best-performing German states are found in the south and west of the country, while the United States’ best performers are found along the west coast and in the northeast. Though the median Italian region scores much worse than the median Canadian province, Italy’s best performer (Emilia-Romagna) outscores Canada’s best performer (Ontario). Only a few Italian regions produce more PCT patents per capita than the average region in the analysis: Emilia Romagna, Friuli Venezia Giulia, Lombardy, Tuscany, and Veneto. Some southern Italian regions, on the other hand, generate almost 10 times fewer patents per capita than the overall average.
Table 15: Country performance in TASICI PCT Patent Applications indicator
|
Country |
Median Score |
Maximum Score |
Minimum Score |
Standard Deviation |
||
|
Canada |
68 |
97 |
(Ontario) |
16 |
(Newfoundland and Labrador) |
29 |
|
Germany |
139 |
406 |
(Baden-Württemberg) |
32 |
(Mecklenburg-Vorpommern) |
107 |
|
Italy |
43 |
147 |
(Emilia-Romagna) |
8 |
(Sicily) |
39 |
|
USA |
88 |
502 |
(Massachusetts) |
12 |
(Alaska) |
106 |
|
ALL |
82 |
502 |
(Massachusetts) |
8 |
(Sicily) |
97 |
Business Creation
Why Is It Important?
A thriving business ecosystem should experience a high volume of business start-ups. This indicator measures the share of a region’s business enterprises that were established in the past year. The business creation indicator is limited in scope to new businesses, without capturing business turnover resulting from the market disruption and creative destruction that forces incumbents to innovate or leave the market. Thus, the full impact of business competition on innovation is not captured. Moreover, this metric does not differentiate between industries, so there is no differentiation between creation rates in advanced, innovative industries and those in less-advanced industries. Absent a better alternative at the cross-national regional level, this indicator reflects a region’s overall economic resilience and regional competitiveness.
Figure 15: Economy-wide enterprise birth rate, 2016–2018[37]
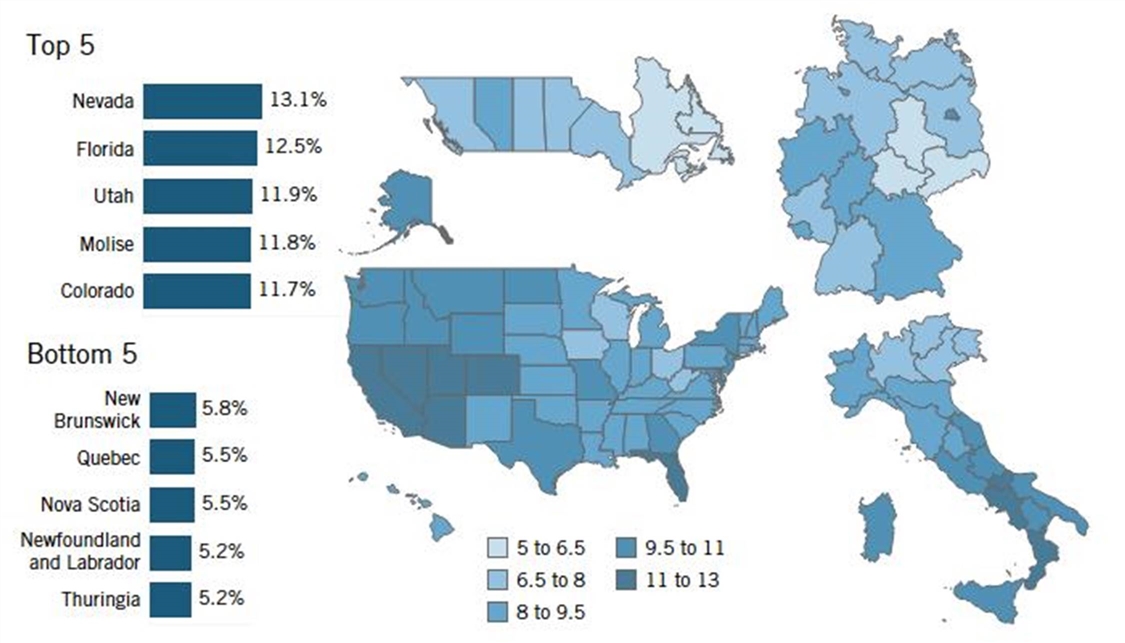
The Rankings
Nevada, Florida, Utah, Molise, and Colorado lead in this indicator, while New Brunswick, Quebec, Nova Scotia, Newfoundland and Labrador, and Thuringia rank at the bottom. (See Figure 15.) American states claim four of the top five spots, with Italy’s Molise ranking fourth. Expanding the selection to the top 50 regions, the United States and Italy maintain this lead over Germany and Canada, with 33 U.S., 15 Italian, and 2 German states comprising the top 50. While the dispersion of business creation in the United States and Germany is scattered, high business creation is concentrated in southeastern Italy, which is generally less developed than other parts of the nation.
Canada performs poorly relative to peers, claiming four of the bottom five spots. It is unclear why Canada ranks so low, especially given its entrepreneur-friendly regulatory framework and generally favorable attitude toward entrepreneurship.[38] Germany’s results, despite the government’s emphasis on supporting entrepreneurs, are a little less surprising given the cultural attitudes regarding starting a business and the oft-discouraging regulatory environment.[39]
Table 16: Country performance on TASICI Business Creation indicator
|
Country |
Median Score |
Maximum Score |
Minimum Score |
Standard Deviation |
||
|
Canada |
6.6% |
8.5% |
(Alberta) |
5.2% |
(Newfoundland and Labrador) |
1.1% |
|
Germany |
7.9% |
10.1% |
(Berlin) |
5.2% |
(Thuringia) |
1.2% |
|
Italy |
9.4% |
11.8% |
(Molise) |
7.0% |
(Trentino) |
1.3% |
|
USA |
9.1% |
13.1% |
(Nevada) |
7.0% |
(West Virginia) |
1.4% |
|
ALL |
8.6% |
13.1% |
(Nevada) |
5.2% |
(Thuringia) |
1.6% |
Carbon Efficiency
Why Is It Important?
As the world endeavors to combat climate change, decarbonization is of paramount importance. Regions’ ability to innovate sustainably to achieve a reduction in and the efficient use of carbon and other greenhouse gases will influence their long-term competitiveness, as well as their economic prosperity. This indicator measures carbon dioxide (CO2) and other greenhouse gas efficiency per unit of output (as measured by PPP-adjusted GDP). It is noted that more-developed regions may have a slight advantage in this indicator due to their service-oriented economies. As policymakers look to improve efficiency and reduce overall emissions, they will take their lead from those regions that are devising new solutions and innovative technologies.
Figure 16: Metric tons of greenhouse gas (measured in CO2 equivalents) emitted per $10,000 of PPP-adjusted GDP, 2018[40]
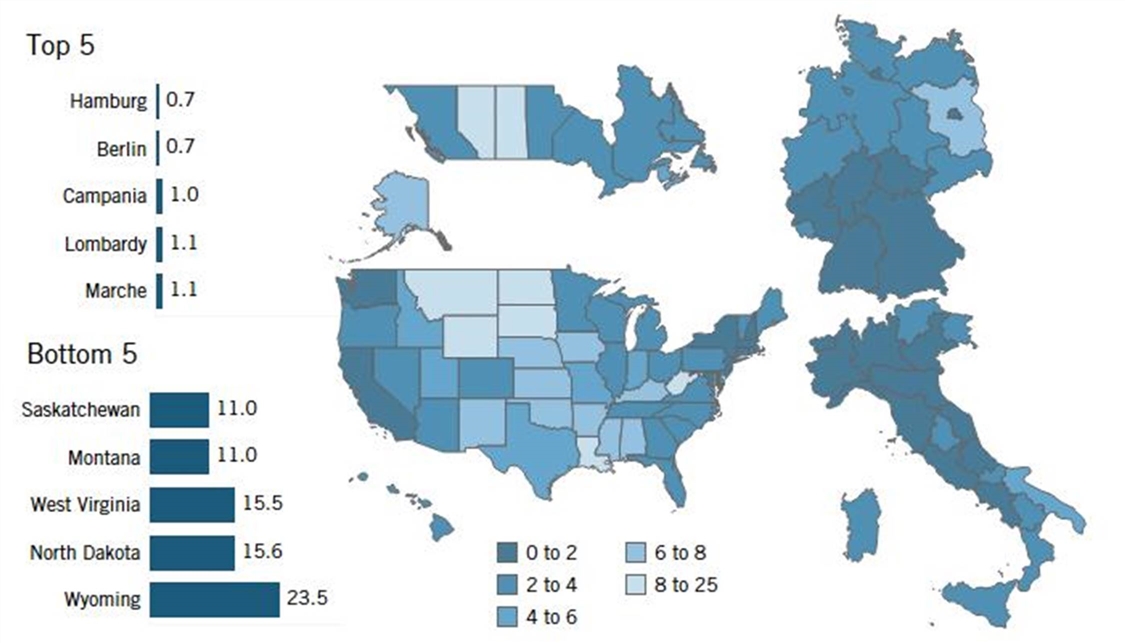
The Rankings
Unsurprisingly, German and Italian regions rank among the highest in carbon efficiency, with Hamburg, Berlin, Campania, Lombardy, and Marche leading in this indicator, while Canada and the United States rank more than a point lower than Germany and two points lower than Italy in median scores. (See Error! Reference source not found..)
Other regions in Italy, especially those with lower GDP (such as Apulia, Molise, and Sardinia) score worse than the overall average and have considerable room for improvement. Overall, Italy’s more-developed northern regions score very well and contribute to Italy’s low-carbon intensity, compared with both nations in this report and EU counterparts. Meanwhile, Canada and the United States likely score poorly in part due to the importance of their oil and gas and transportation sectors.
Table 17: Country performance in TASICI Carbon Efficiency indicator
|
Country |
Median Score |
Maximum Score |
Minimum Score |
Standard Deviation |
||
|
Canada |
3.8 |
2.3 |
(Quebec) |
11.0 |
(Saskatchewan) |
2.9 |
|
Germany |
2.1 |
0.7 |
(Hamburg) |
8.0 |
(Brandenburg) |
1.7 |
|
Italy |
1.9 |
1.0 |
(Campania) |
4.6 |
(Apulia) |
0.9 |
|
USA |
3.7 |
1.2 |
(New York) |
23.5 |
(Wyoming) |
4.1 |
|
ALL |
2.7 |
0.7 |
(Hamburg) |
23.5 |
(Wyoming) |
3.5 |
Venture Capital
Why Is It Important?
This indicator examines a region’s total VC investment (measured as VC-receiving firms) relative to the size of its GDP. VC represents a form of business financing wherein investors provide funds to early-stage companies in exchange for equity in their firms. Given the considerable uncertainty regarding start-ups’ success potential, VC investment assumes higher risk than does other forms of investment. Accordingly, VC investment is often intended for companies with real or perceived high-growth potential, often associated with their innovative technology use or business model design. VC has become increasingly concentrated in a handful of the most innovative industries, with AI technology-based start-ups attracting over 21 percent of the world’s VC in 2020.[41] A region’s receipt of VC investment reflects both the innovativeness of its start-up ecosystem as well as the commitment of its firms to lead in crucial technologies such as AI, biotechnology, clean energy, advanced manufacturing, and robotics. VC has become increasingly concentrated in a handful of the most innovative industries, with AI technology-based start-ups attracting over 21 percent of the world’s VC in 2020. Due to the volatility of VC investment from year to year, this report considers regions’ average scores between 2017 and 2019.
Figure 17: Venture capital investment received as a percentage of GDP, 2017–2019 (average)[42]
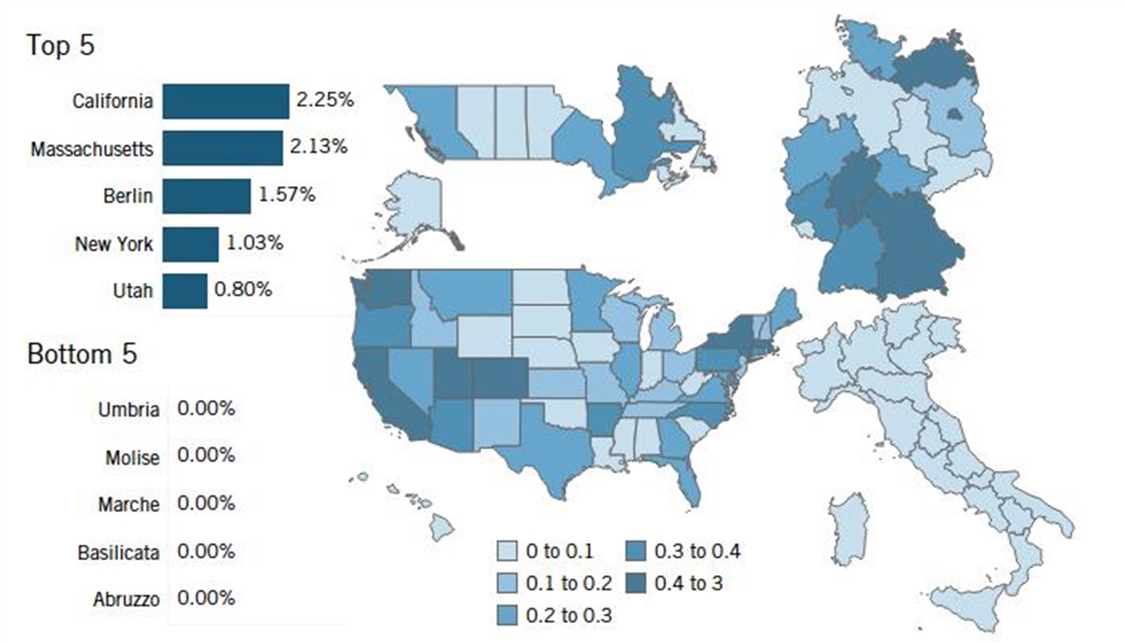
The Rankings
California and Massachusetts (where the amount of VC invested is equivalent to 2.3 percent and 2.1 percent of gross state product, respectively) are leaders in innovation thanks to technological development in Silicon Valley and the outstanding network of research universities in Massachusetts. Berlin (1.6 percent), New York (1 percent), and Utah (0.8 percent) make up the remainder of the top five. (See Figure 17.)
Despite the high performance of California and Massachusetts, the median German state overall has a considerably higher VC investment ratio than the median U.S. state. This result is likely partly due to the increased concentration of VC in the United States, compared with Germany (0.43 and 0.37 percent standard deviation respectively). Arkansas, while ranking 90th in the overall TASICI score, performs outstandingly in VC because of outlier investments in 2018, when the total VC funding provided compared with GDP was nearly 30 times that of the respective VC funding/GDP ratio in the previous year.[43] Italian regions and Canadian provinces generally underperform German and U.S. states in this indicator. Umbria, Molise, Marche, Basilicata, and Abruzzo—Italian regions all—perform weakest in this indicator.
Table 18: Country performance in TASICI Venture Capital indicator
|
Country |
Median Score |
Maximum Score |
Minimum Score |
Standard Deviation |
||
|
Canada |
0.06% |
0.33% |
(Quebec) |
0.04% |
(Newfoundland and Labrador) |
0.10% |
|
Germany |
0.24% |
1.57% |
(Berlin) |
0.01% |
(Saxony) |
0.37% |
|
Italy |
0.00% |
0.07% |
(Lombardy) |
0.00% |
(Abruzzo) |
0.02% |
|
USA |
0.18% |
2.25% |
(California) |
0.00% |
(West Virginia) |
0.43% |
|
ALL |
0.11% |
2.25% |
(California) |
0.00% |
(Abruzzo) |
0.37% |
Policy Recommendations
Some of the following proposed policy recommendations fall under the realm of national-level competencies, and in other cases, regional ones. Regions and municipalities play an essential role in creating business and human capital that empower regional innovation competitiveness.
Canada
Knowledge Economy
Despite a highly general population overall, Canada faces a growing knowledge gap in digital and STEM skills.[44] This shortage carries short-term employment implications, as well as long-term economic growth concerns. To bridge this gap and improve Canada’s professional, scientific, and technical employment levels, policymakers must invest in digital and STEM training and development. In doing so, Canada can further improve R&D personnel levels by increasing the number of Canadians entering research and technical fields.
To begin with, Canadian policymakers should redouble efforts to bolster workforce reskilling and upskilling, while also enhancing retention programs. Closing the gap will also require better recruitment strategies to attract talent to study and work in Canada. Strong national immigration policies are a start, but policymakers could further increase skilled immigration through reforms such as guaranteeing prior-study permit holders’ long-term readmission; improving transferability of foreign work credentials and school credits; and increasing support for immigrants to successfully enter the labor market.[45] Moreover, policymakers should reform digital and STEM education at all levels of the Canadian education system. To that end, policymakers must invest in resources, teachers, and programs to support STEM education. They should also work to improve knowledge exchange through reciprocal university-level programs with peer nations and investment in work-integrated learning programs.
Globalization
Although Canada’s largest provinces perform well in FDI, PTS employment, and skilled immigration, there remains a considerable paucity of high-tech exports out of most Canadian provinces. To avoid falling behind in high-tech export opportunities, Canada should make a greater commitment to innovation and technology investment and strengthen trade agreements and partnerships in cutting-edge technologies to serve its population with high-salary employment opportunities that can lead to greater productivity and sustainable growth.[46] Policymakers should also redouble their efforts to attract technology-intensive FDI inflows.
Innovation Capacity
Compared with peer nations, Canada exhibits impressive broadband adoption levels, despite weak performances in other innovation capacity indicators. In recognition of the need for greater R&D investment, the Canadian federal government recently introduced a budgetary plan to review the Scientific Research and Experimental Development (SR&ED) investment tax credit.[47] Yet, as a tool to enhance innovation output (and the quality thereof) and spur greater investment in R&D, this tax credit has thus far proven largely ineffective. The likely explanation for this is the SR&ED lacks strong enough intellectual property (IP) protections to ensure the benefits of R&D are realized in Canada. Policymakers would be better off supporting improved IP protections and a targeted R&D subsidy. Naturally, these reforms would also boost Canada’s share of R&D personnel—another area in need of improvement.
One reason achieving more R&D efficiency and impact is vitally important for Canada is to boost the nation’s long-sagging productivity levels. In fact, each hour worked by employees contributes $16 less to GDP in Canada than it does in the United States.[48] Canada, and its provinces alike, need to make increasing productivity growth a key component of their broader innovation strategies.
Each hour worked by employees contributes $16 less to the county’s GDP in Canada as compared with the United States.
The United States and Canada lag well behind peers in progress made toward decarbonization and achieving improvements in carbon efficiency. While the U.S. government has recently chosen a path of subsidies and consumer credits for clean energy investments, Canada’s strategy centers on carbon pricing schemes such as carbon taxes and cap and trade, the revenues of which are typically returned to households through rebates.[49] But while the U.S. system will spur greater investment in new technologies and innovation, Canada’s carbon strategy does little in the way of generating clean energy development. Thus, Canadian policymakers should take a cue from their southern neighbor and reform the country’s decarbonization plan by reinvesting some of the carbon tax revenue toward technology and innovation. To offset the use of revenue that would otherwise go to household rebates, Canada should implement its own system of consumer tax credits for carbon reduction.
Germany
Knowledge Economy
Companies in Germany are facing the major challenges of decarbonization, demographics, and digitization. In surveys, companies want the government to invest more in digitization and education, especially in computer science and other STEM subjects, to strengthen innovation in the country.
To achieve greater computer- and information-related competencies, it is first necessary to focus on education and training by ensuring educational institutions are appropriately equipped with the necessary digital infrastructure. Despite some progress made during the COVID-19 pandemic, Germany still has considerable catching up to do in this area. As a second step, teachers' skills in using digital media in the classroom should be further expanded.
Further, to improve students’ IT skills, the school subject “computer science” should be taught in as many grades as possible throughout Germany. In addition, to strengthen STEM education, the entire educational process must be considered. The potential of women for STEM professions can be better tapped through stereotype-free career and study orientation. With the same competencies, girls rate themselves lower than boys in STEM subjects and are also rated lower by their parents. Therefore, unbiased feedback from schools is of particular importance for career and study choices. The importance of STEM skills in supporting climate protection professions should be communicated more clearly.
To attract workers from demographically strong developing countries for a wide range of activities, the potential of the Skilled Workers Immigration Act should be better exploited by simplifying and accelerating administrative processes. Further, the conditions for finding a job in Germany should be made much more attractive. Immigration is important for innovative strength and productivity growth.
In research, according to evaluations of the IW patent database, the share of inventors with foreign roots in all patent applications from Germany has risen sharply. To attract more highly qualified specialists for innovation and transformation from abroad, policymakers should significantly increase capacities for immigration via universities and funds for accompanying international students at German universities.
Globalization
Germany performs well in high-tech exports compared with Italy and the United States, although the United States has a much more-extensive domestic market that allows states to do business and trade internally with other U.S. states, which may adjust the true competitiveness difference between the United States and Germany as a consequence of distinctive globalization levels. Partly due to the single market of the EU, Germany exports four times as much as the United States in general.[50] Nevertheless, the high export ratio and strong presence of technology highlight the innovativeness of German trade, which has also been affected by the industrial policy of Germany—the “Industry 4.0” strategy that supports businesses to accelerate technology adoption for competitiveness in domestic and international markets. Government-industry partnerships are fostering progress toward innovation and productivity growth in engineering and manufacturing especially.[51]
Policies in line with the Industry 4.0 strategy should provide effective technology adoption approaches for the German economy. German policymakers should further develop the initiatives and optimize specific policies for the most-critical technologies and industries. To decrease regional disparities, Germany should consider placing special focus on the northern and eastern regions of the country to boost growth, where there exists potentially higher marginal economic impact from spillover effects of technology trade, as local technology is adopted by smaller businesses in the region as a result of the increased competition of technology vendors.
Companies in Germany are facing the major challenges of decarbonization, demographics, and digitization.
Germany lags behind the United States and Canada in attracting FDI. Therefore, the country should consider policies that specifically incentivize technological FDI, especially in developing regions, as the spillover effects of new technology businesses may increase innovative activities in the technology ecosystem the investment is received in, which can lead to increased productivity and economic prosperity.
Innovation Capacity
Even though the German economy is relatively strong in research thanks to its economic structure, it faces major challenges. Digitization and decarbonization, for example, are changing firms’ business models and mean that more needs to be invested in the innovation process. To this end, public investment in research at universities and research institutions should also be increased, and the transfer of knowledge and technology to industry and the promotion of private-sector research activities should be strengthened.
Regarding the energy transition, it is important to drive it forward through innovation and to support the mobility transition in a way that is open to technology. In terms of digitization, Germany must catch up technologically, for example, in AI. Likewise, investments in digital infrastructure must be strengthened. In response to the demographic challenge, the third priority is to secure skilled labor, particularly in STEM subjects, both through the use of domestic and foreign skilled labor.
To meet major sociopolitical challenges such as decarbonization and digitization, research policy formulates missions that enable and accelerate this transformation process. The German government’s High-Tech Strategy 2025 formulates corresponding missions and goals. Research programs for decarbonization should be expanded, with the goal of nonfossil propulsion technologies broadly defined to enable technology-open solutions. Overall, innovations in promising fields such as AI and climate protection should be promoted more strongly.
Young and smaller innovative companies face greater financing hurdles than do large companies and can be supported by governmental research funding. One instrument for this is the newly introduced research premium, which should be increased and maintained in the long term to create planning security and sufficient financial incentives for companies that want to steer their business models away from sporadic research activities toward continuous research. To achieve the goal of spending 3.5 percent of GDP on R&D, the research allowance provides an effective lever.
Italy
Knowledge Economy
The share of PTS employment is excellent in Italy, making it one of the most important assets for Italy’s innovation ecosystem. However, there are challenges in improving manufacturing labor productivity, and in attracting skilled immigrants.
For the Italian knowledge economy, human capital needs to be bolstered, both in terms of employee know-how and skills uptake, as well as increased management capabilities. Upskilling and reskilling the current workforce, as well as increasing the number of graduates––which is too low compared with international peers, especially in STEM disciplines––should be targeted with coherent policies. Further, more ICT-specialized diplomas are needed to feed specific market requests, especially from large corporations and digitalized enterprises.
Attracting immigrant knowledge workers should be a national government priority, choosing quality over quantity. To this end, ad hoc policies would be useful to feed flows of skilled workers in industrial sectors with greater specialization and growth prospects.
Globalization
Among the areas analyzed, one of Italy’s strengths lies in high-tech exports, although Italy shows weaknesses in terms of attracting FDI.
For globalization, in order to encourage the internationalization of businesses, a mix of instruments aimed at providing adequate skills, tools, and capital is needed. Measures should be introduced to strengthen the capitalization of small to medium-sized enterprises. Further, horizontal industrial policy intervention should be promoted (as well as vertical measures in the most-promising value chains such as clean tech, biotech, and AI) involving the strengthening of physical and digital infrastructures, improving access to credit, developing innovative financial support instruments, and encouraging business cooperation.
Innovation Capacity
Italy exhibits outstanding performance in business creation and the twin green and digital transitions, with policies being adopted to further improve upon them, since these are priorities included in the strategic objectives of the European Union. On the contrary, Italy struggles in investments in innovation, and the production of patents.
In terms of technical progress, the penetration of ICT technologies in the economy must be strengthened. Adoption rates of technologies such as cloud computing, big data applications, enterprise resource planning solutions, customer relationship management, and e-commerce platforms should be sped up.
Many companies, especially smaller and traditionally managed ones, need support and incentives to overcome the challenges posed by the digital transition. In this case too, ad hoc measures have already been launched within the framework of the National Recovery and Resilience Plan, the extraordinary tool activated by the European Union to support economic recovery after the COVID-19 pandemic.
Innovation plays a key role in strengthening the efficiency and productivity of companies. The incentive to invest in tangible and intangible capital and intramural R&D as well as the development and acquisition of licenses and patents cannot be overlooked. For Italian innovation capacity, private investment in R&D must be accompanied by an increase in public spending on basic research and technology transfer, which is currently inadequate in the country compared with European and Organization for Economic Cooperation and Development (OECD) standards.
Overall, a timely and effective investment of funds from the European Recovery and Resilience Facility will be essential for Italy and its regions to make significant progress in the field of innovation and competitiveness.
United States
Many of ITIF’s competitiveness- and innovation-enhancing policy proposals for the United States are laid out in previous reports, including the NASICI and ITIF’s series of State New Economy Indexes.[52] ITIF has also comprehensively documented its recommendations to boost U.S. competitiveness in reports such as “50 Ways to Leave Your Competitiveness Woes Behind: A National Traded Sector Competitiveness Strategy.”[53] Thus, only a few category-relevant, high-level policy recommendations are offered here.
Knowledge Economy
Although the United States performs very well in higher education and manufacturing labor productivity, there exists room for improvement by U.S. states in terms of increasing skilled immigration and levels of scientific, technical, and professional employment. To prevent productivity stagnation, the United States should promote industry-university partnerships supporting both R&D and STEM education efforts.[54] Such partnerships benefit companies by providing a high-skilled workforce specifically attuned to industries’ needs as well as influencing research to make the greatest impact on the economy. The investments corporations make at universities also show moderate effects on VC activity and patents produced by academic institutions.[55]
Globalization
America can do more to facilitate its performance in the globalization indicators by improving its trade policies. The United States needs to implement a free trade agreement with the United Kingdom. While the Biden administration’s advocacy for an Indo-Pacific Economic Framework is laudable, the United States should still join the Comprehensive and Progressive Transpacific Partnership (CPTPP), bringing high-standard trade rules into the agreement where necessary. The United States further needs to continue to advance high-standard digital trade rules across a range of forums that enable global data flows and limit barriers such as data localization policies.
The U.S.-Canada-Mexico (USMCA) free trade agreement laudably implemented stronger digital trade rules; however, some digital trade barriers among the partners persist (e.g., local data storage requirements in certain states, notably Canadian provinces).[56] The United States should take the lead in ensuring that USMCA partners fully adhere to the digital trade provisions of the agreement.[57]
Innovation Capacity
The United States ranks lower than Italy and Germany in R&D personnel, and lower than Germany in R&D intensity. This points to the need for America to arrest its continuing decline in levels of federal R&D investment. For instance, in 23 of the 30 years from 1990 to 2019, federal R&D spending comprised a smaller share of GDP than the year before, sinking to just 0.63 percent of GDP in 2019, which is unprecedented since this measure has been reported, according to data from the National Science Foundation.[58] As ITIF wrote in 2019, to restore America’s R&D-to-GDP ratio to match the levels of the 1980s, funding would need to increase by about 80 percent, or $100 billion per year.[59]
To this end, in July 2022, Congress passed the CHIPS and Science Act of 2022, which authorizes roughly $280 billion in federal investment in R&D, competitiveness, and workforce initiatives over the next 10 years, including roughly $75 billion for semiconductors ($39 billion in grants, $24 billion in tax credits, and $12 billion in R&D) and another $200 billion for R&D, science, workforce, and economic competitiveness programs.[60] However, it’s important to note that funds for only the semiconductor-related aspects of the legislation have been appropriated, and legislators will need to fully appropriate the R&D funding elements of the legislation this fall for the CHIPS and Science Act to truly represent a landmark investment in U.S. innovation and competitiveness. Nevertheless, the package certainly represents a significant attempt to bolster faltering U.S. competitiveness, especially in advanced-technology industries.[61]
The CHIPS and Science Act also authorizes $10 billion over five years to create 20 geographically distributed technology and innovation hubs in areas that are not currently tech leaders. This will mitigate disparities in innovation and economic growth in the United States, creating high-paying jobs in areas falling behind in the innovation economy. A previous ITIF report, which calls for a similar proposal, finds that one-third of U.S. innovation jobs were concentrated in just 14 counties and that 5 metro areas—Boston, San Diego, San Francisco, San Jose, and Seattle—accounted for over 90 percent of the country’s growth in innovative industries between 2005 and 2017.[62]
The United States needs to increase its R&D tax credit generosity, which is quite low by international standards. ITIF has called on Congress to lift the overall R&D subsidy rate to at least 15.5 percent by eliminating the expensing repeal included in the 2017 Tax Cut and Job Creation Act and slightly more than doubling the effective rates for federal R&D credits.[63] Expanding R&D tax credits could also play an important role in increasing U.S. R&D employment levels.[64] Lastly, U.S. states should also develop their own innovation and competitiveness strategies, particularly with regard to Industry 4.0 strategies.[65]
Conclusion
This report assesses transatlantic subnational innovation competitiveness by examining the 96 regions among Canada, Germany, Italy, and the United States. It finds that Germany outscores Canada, Italy, and the United States in innovation competitiveness due to that country’s strong knowledge economy, globally integrated economy, and innovation capacity, partly due to its Industry 4.0 policy. The United States follows Germany in overall performance, followed by Italy and Canada.
Germany should continue to build on its strengths by emphasizing the strengths of its education system, increasing its R&D expenditures, and supporting German enterprises’ adoption of digital technologies. Canada should incentivize R&D more intensively, invite technology-intensive FDI, and focus on bolstering its productivity levels. Italy should improve policies that attract and nurture talent while also utilizing its strengths in R&D personnel, business creation, and high-tech exports. The United States should fully invest in the programs of the CHIPS and Science Act of 2022, increase its R&D tax credit, and reconsider immigration policies in high-demand professions in order to accelerate technology adoption in all states.
Further research could utilize additional measures to capture countries’ innovation economy performance more precisely, as well as add more countries and regions to the analysis to be able to view a broader picture of international regional innovation competitiveness performance. Crucially, government publication of quality, timely data is important for the potential of future research and for policymakers to introduce productivity and innovation policies most effectively.
Appendices
Appendix A: Composite and Category Scores Methodology
For each indicator, regions’ scores were converted to a standardized score, which was capped at ±3 to avoid an outlier performance on a single indicator from too heavily influencing the composite score. For composite and category scores, a weighted-average capped standardized score (WACSS) was calculated for each indicator, wherein the weights used are those listed in the table below (normalized such that an indicator’s applied weight is equal to its listed weight divided by the sum of the listed weights—i.e., applied weights sum to one). For the composite score, this was calculated by including all indicator weights; for the category scores, this was done by including only the weights for the indicators that fall under that category. WACCS are rescaled to a 100-point scale via min-max normalization, in which the “maximum” parameter is the maximum WACCS plus one-quarter standard deviation of WACCS, and the “minimum” parameter is the minimum WACCS minus one-quarter standard deviation of WACCS.
Mathematically, the WACCS of region s is calculated as:
![]()
whereini denotes the indicator, CSSs,i denotes the capped standardized score for region s in indicator i and ωi is the applied weight of indicator i, defined as:
![]()
such that ∑i ωi =1.
The scaled score for region/UT s is then calculated as:
Appendix B: Indicator Methodologies and Weights
Table 19: Indicator weights and descriptions
|
Indicator |
Weight |
Year |
Description |
Category |
|
Broadband Adoption |
0.50 |
2019 |
Share of households subscribing to broadband Internet |
Innovation Capacity |
|
Business Creation |
0.50 |
2016–2018 |
Enterprise birth rate in share of employer enterprises |
Innovation Capacity |
|
Carbon Efficiency |
0.50 |
2018 |
Metric tons of CO2e emitted per $10,000 of PPP-adjusted GDP |
Innovation Capacity |
|
High-Tech Exports |
0.75 |
2017 |
Exports in NACIS codes 333–335 (or equivalent) as a share of GDP |
Globalization |
|
Highly Educated Population |
1.00 |
2019 |
Share of 25–64-year-old population with a bachelor’s degree (or equivalent) or higher |
Knowledge Economy |
|
Inward FDI |
0.75 |
2017–2019 (average) |
FDI inflow as a share of GDP |
Globalization |
|
Manufacturing Labor Productivity |
1.25 |
2019 |
PPP-adjusted GVA per worker in the manufacturing sector |
Knowledge Economy |
|
Patent Applications |
1.25 |
2015 |
PCT patent applications per million residents |
Innovation Capacity |
|
Professional, Technical, and Scientific Employment |
1.25 |
2019 |
Share of employees in professional, technical, and scientific activities sector |
Knowledge Economy |
|
R&D Intensity |
1.50 |
2019 |
R&D expenditures as a share of GDP |
Innovation Capacity |
|
R&D Personnel |
1.50 |
2017, 2018 |
R&D personnel as a share of total employees |
Innovation Capacity |
|
Skilled Immigration |
0.50 |
2019 |
Share of population that is foreign born and has at least some tertiary education (ISEC 5–8) |
Knowledge Economy |
|
Venture Capital Received |
0.75 |
2017–2019 (average) |
Venture capital investments received as a share of GDP |
Innovation Capacity |
Appendix C: Estimation Methodologies
Scores for Trentino, Italy, are estimated as the weighted average of the scores for the regions of Bolzano-Bozen and Trento.
Business Creation
Canadian data is from 2016 (2015 data is used for Newfoundland and Labrador and Prince Edward Island).
Enterprise birth rate is unavailable for the individual German federal states but is reported at the country level starting in 2018. The state-level data is estimated based on German states’ 2017 start-up rates and their number of legal business units in 2019. German states’ enterprise birth rates are calculated such that they are directly proportional to their start-up rates and their weighted average is equivalent to the 2018 country-level rate, wherein the weights are equal to the states’ shares of total legal business units.
Carbon Efficiency
Italian and German greenhouse gas emissions data is not available at the regional level. Instead, each of these region’s CO2 emissions is taken and divided by CO2’s share of greenhouse gas emissions at the country level. This estimate implicitly assumes that CO2’s share of greenhouse gas emissions is equal for all regions of the same country. However, this is likely to have little effect on the results, since CO2 accounts for approximately 90 percent of greenhouse gas emissions in Germany and 85 percent in Italy.
Inward FDI
Canadian FDI data is reported at the province level for 2019 only. However, the specific amounts received by Newfoundland and Labrador, Prince Edward Island, and the territories are not reported. These values are distributed based on their number of employees of foreign multinational enterprises in Canada. Likewise, the FDI received by Canada in 2017 and 2018 is distributed to the provinces based on their number of such employees in those years.
U.S. data is reported at the national level, and state-level inward flows are reported for most states. However, data for some states is not reported to avoid potentially disclosing information about individual companies. The difference between the country-level inflow and the sum of the reported state-level inflows is distributed to the U.S. states for which data is not reported based on the number of employees of majority-foreign-owned U.S. affiliates in those states. This method is used for consistency with this report’s predecessor.
Similarly, Italian inward FDI flows are not reported for the individual regions. The country-level FDI inflow as reported by the United Nations Conference on Trade and Development (UNCTAD) World Investment Report is distributed to the individual regions based on their share of employees of “companies with foreign participation,” though this data comes from 2017.
Data on German FDI inflows is not available at the state level. However, inward FDI stocks are reported at this level. The 2019 country-level FDI inflow as reported by the UNCTAD World Investment Report is distributed to the individual federal states based on their share of the 2019 inward FDI stock. Unfortunately, state-level FDI stocks are only reported starting in 2019. FDI for 2017 and 2018 is distributed to the individual states based on these 2019 shares as well.
R&D Personnel
U.S. R&D personnel data is available at the state level for only business and higher-education R&D personnel (starting in 2018) but is not available with respect to government employees. In an attempt to account for this, the employee count (measured in full-time equivalents) of the national laboratories is added to their respective states’ R&D personnel totals. This only materially affects the results for New Mexico due to the prevalence of Los Alamos and Sandia National Laboratories in that state. The National Energy Technology Laboratory has locations in five states (Alaska, Oregon, Pennsylvania, Texas, and West Virginia) but reports the employee count for all locations combined. The count is distributed among the five states based on their number of total employees.
Venture Capital
The amount of VC invested in Canadian regions comes from the MoneyTree report by PricewaterhouseCoopers and CB Insights, which combines some of the provinces into groups and reports the figure for each group. For example, the report combines Alberta, Manitoba, and Saskatchewan into the “Prairies” region and reports the VC received there as such. In these instances, the reported amount is distributed to the component provinces based on their number of employees in the PTS services and information and communications industries.
Italy’s regions’ shares of VC received come from a 2020 Ernst & Young report on VC investment in the country. The 2020 shares are then used to distribute countrywide VC received in 2017–2019, per OECD data.
Appendix D: Full Dataset and Rankings
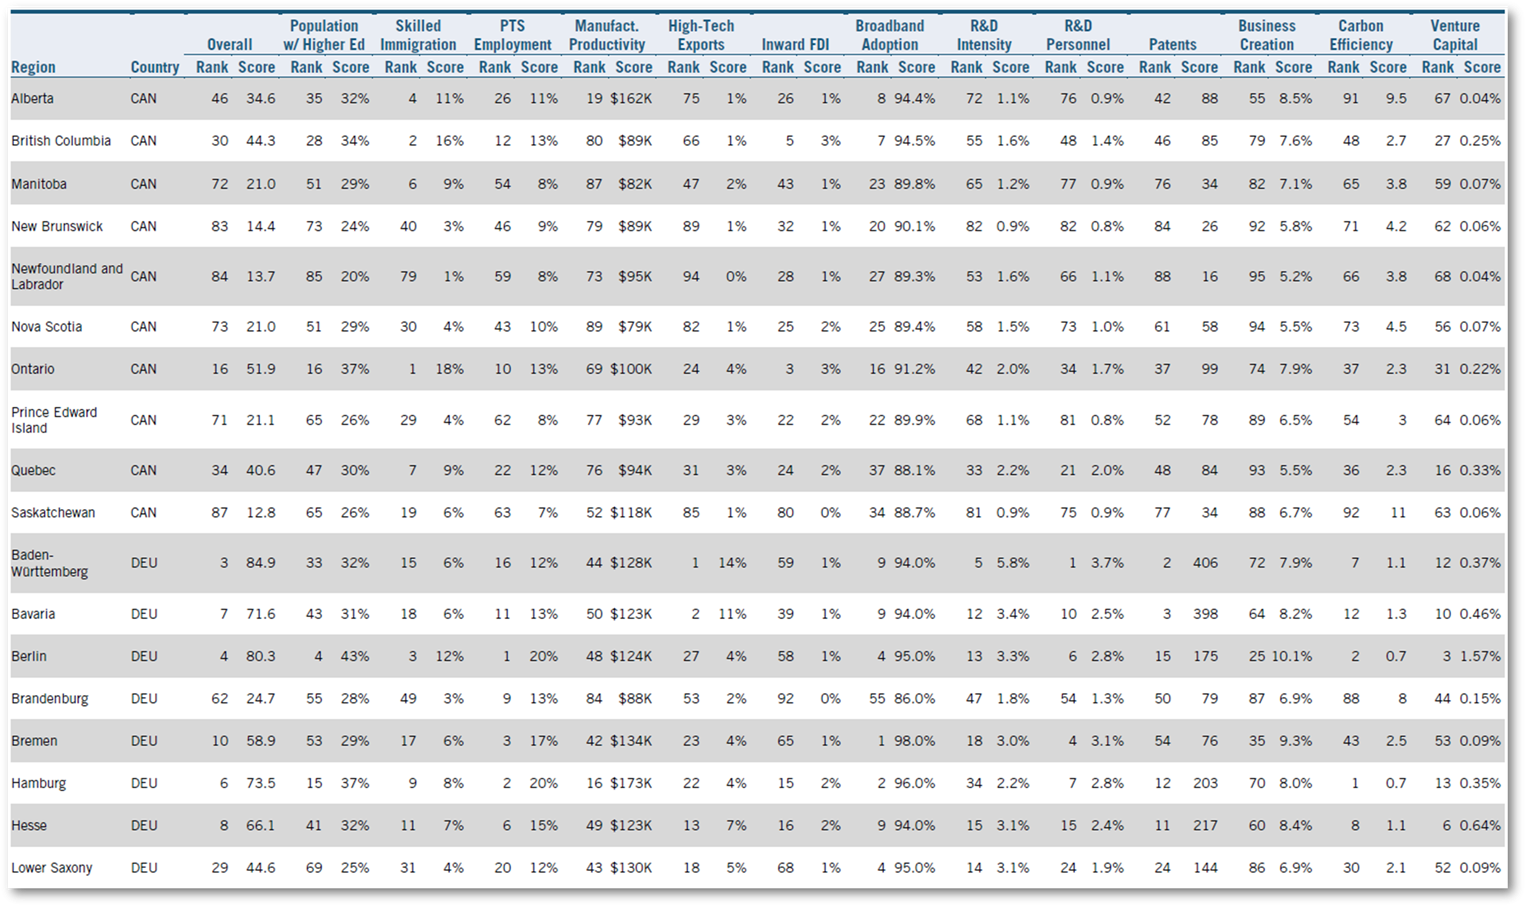
Acknowledgments
The authors would like to thank Dr. Robert D. Atkinson, president of the Information Technology and Innovation Foundation (ITIF), Jessica Dine, research assistant for broadband policy at ITIF, and Shelby Lauter, global innovation policy fellow at ITIF, for their contributions to this report.
About the Authors
Viktor Lazar is a policy fellow for global innovation policy at ITIF.
Ian Clay is a research assistant for ITIF’s global innovation policy team.
Stephen Ezell is vice president for global innovation policy at ITIF and director of ITIF’s Center for Life Sciences Innovation. He also leads the Global Trade and Innovation Policy Alliance.
Axel Plünnecke is head of cluster education, immigration and innovation, at IW.
Stefano da Empoli is president and principal policy analyst at the Institute for Competitiveness (I-Com), a think tank based in Rome and Brussels which he founded in 2005.
Lorenzo Principali is director of the digital area of I-Com.
Michele Masulli serves as director of the energy area at I-Com, where he has been a research fellow since 2017.
Aaron Wudrick is director of the domestic policy program at the Macdonald-Laurier Institute.
About ITIF
The Information Technology and Innovation Foundation (ITIF) is an independent, nonprofit, nonpartisan research and educational institute focusing on the intersection of technological innovation and public policy. Recognized by its peers in the think tank community as the global center of excellence for science and technology policy, ITIF’s mission is to formulate and promote policy solutions that accelerate innovation and boost productivity to spur growth, opportunity, and progress. For more information, visit itif.org.
Endnotes
[1]. Luke Dascoli and Stephen Ezell, “North American Subnational Innovation Competitiveness Index” (ITIF, June 2022), https://itif.org/publications/2022/06/21/north-american-subnational-innovation-competitiveness-index/.
[2]. OECD, Demography and Population (Historical population, 2021; accessed October 18 2022); OECD, National Accounts (GDP current prices and exchange rates, 2021; accessed October 18 2022); The World Bank, GDP (current US$) (World, 2021; accessed October 18).
[3]. Robert D. Atkinson, “Why Federal R&D Policy Needs to Prioritize Productivity to Drive Growth and Reduce the Debt-to-GDP Ratio” (ITIF, September 2019), https://www2.itif.org/2019-federal-rd-productivity.pdf.
[4]. Théo Lepage-Richer, “States of computing: On government organization and artificial intelligence in Canada” (Big Data & Society, 2022), https://journals.sagepub.com/doi/full/10.1177/20539517221123304; J. Mark Munoz and Alka Maurya, “International perspectives on artificial intelligence” (Anthem Press, 2022), Chapter 5; Sophie-Charlotte Fischer, “France: A European pioneer in the geopolitics of technology” (ETH Zürich, April 2022), https://www.research-collection.ethz.ch/bitstream/handle/20.500.11850/540143/CSSAnalyse302-EN.pdf?sequence=2&isAllowed=y; Roberto Saracco, “Perspectives on AI adoption in Italy, the role of the Italian AI Strategy” (Discover Artificial Intelligence, 2022), https://link.springer.com/article/10.1007/s44163-022-00025-5; J. Mark Munoz and Alka Maurya, “International perspectives on artificial intelligence” (Anthem Press, 2022), Chapter 2; Ibid., Chapter 6; Ibid., Chapter 9.
[5]. Stephen Ezell, “Why the House Needs to Pass the CHIPS and Science Act Today” (ITIF, July 2022), https://itif.org/publications/2022/07/27/why-the-house-needs-to-pass-the-chips-and-science-act-today/.
[6]. Dutta et al., “Global Innovation Index 2022: What is the future of innovation-driven growth?” (WIPO, 2022), https://www.wipo.int/edocs/pubdocs/en/wipo-pub-2000-2022-en-main-report-global-innovation-index-2022-15th-edition.pdf.
[7]. Robert D. Atkinson and Caleb Foote, “The 2020 State New Economy Index” (ITIF, October 2020), https://itif.org/publications/2020/10/19/2020-state-new-economy-index/.
[8]. Hugo Hollanders and Nordine Es-Sadki, “Regional Innovation Scoreboard 2021,” European Commission, June 2021, https://op.europa.eu/en/publication-detail/-/publication/b76f4287-0b94-11ec-adb1-01aa75ed71a1/language-en/format-PDF/source-242412276.
[9]. Stephen Ezell and Luke Dascoli, “The North American Subnational Innovation Competitiveness Index” (ITIF, June 2022), https://itif.org/publications/2022/06/21/north-american-subnational-innovation-competitiveness-index/.
[10]. “Essential Skills are in Demand, but Lacking,” Council for Aid to Education, https://cae.org/evidence/.
[11]. Ali Quazi and Majharul Talukder, “Demographic Determinants of Adoption of Technological Innovation,” Journal of Computer Information Systems, no. 51 (March 2011), 38–46, https://www.researchgate.net/publication/285705399_Demographic_determinants_of_adoption_of_technological_innovation.
[12]. I.Stat, “Population 15 years and over by highest level of education” (25–64 years; accessed September 28, 2022), http://dati.istat.it/Index.aspx?QueryId=55981&lang=en; Meike Baas et al., “International Education Indicators in a Country Comparison 2020” (Berlin: Federal and State Statistical Offices, August 2020), https://www.destatis.de/DE/Themen/Gesellschaft-Umwelt/Bildung-Forschung-Kultur/Bildungsstand/Publikationen/Downloads-Bildungsstand/bildungsindikatoren-1023017207004.pdf; Organization for Economic Cooperation and Development (OECD), Regions and Cities (Educational attainment of the population, by age group; accessed September 28, 2022), https://stats.oecd.org/; Statistics Canada, Educational attainment in the population aged 25 to 64 (accessed September 28, 2022), https://www150.statcan.gc.ca/t1/tbl1/en/tv.action?pid=3710011701&pickMembers.
[13]. Adams Nager et al., “The Demographics of Innovation in the United States” (ITIF, February 2016), https://www2.itif.org/2016-demographics-of-innovation.pdf.
[14]. Tina Huang, Zachary Arnold, and Remco Zwetsloot, “Most of America’s ‘Most Promising’ AI Startups have Immigrant Founders” (Georgetown University website, October 2020), https://cset.georgetown.edu/publication/most-of-americas-most-promising-ai-startups-have-immigrant-founders/.
[15]. Vivek Wadhwa, “America’s New Immigrant Entrepreneurs” (Duke School of Engineering and UC Berkely School of Information, January 2007), https://people.ischool.berkeley.edu/~anno/Papers/Americas_new_immigrant_entrepreneurs_I.pdf.
[16]. Giovanni Peri, Kevin Shih, and Chad Sparber, “Foreign STEM Workers and Native Wages and Employment in U.S. Cities” (NBER Working Paper Series, no. 20093, May 2014), https://www.nber.org/system/files/working_papers/w20093/w20093.pdf.
[17]. Dascoli and Ezell, “North American Subnational Innovation Competitiveness Index”; Destatis, Foreign population by Land (accessed June 22, 2022), https://www.destatis.de/EN/Themes/Society-Environment/Population/Migration-Integration/_node.html#265548; I.Stat, Resident foreigners (Balance; accessed June 22, 2022), http://dati.istat.it/Index.aspx?QueryId=12313&lang=en; OECD, Regions and Cities Database (Migrants – education; accessed June 22, 2022); OECD Regions and Cities Database (Population by 5-year age groups, large TL2 regions; accessed June 22, 2022); United States Census Bureau, American Consumer Survey (Table GCT0501; accessed June 22, 2022), https://www.census.gov/acs/www/data/data-tables-and-tools/geographic-comparison-tables/.
[18]. Edana Robitaille, “Canada’s Immigration Pathways for Tech Talent,” CIC News, July 15, 2022, https://www.cicnews.com/2022/07/canadas-immigration-pathways-for-tech-talent-0727951.html#gs.682lgm.
[19]. “The H-1B Visa Program and Its Impact on the U.S. Economy,” American Immigration Council, July 2022, https://www.americanimmigrationcouncil.org/sites/default/files/research/the_h-1b_visa_program_and_its_ißmpact_on_the_us_economy.pdf.
[20]. OECD, Regions and Cities Database (Regional Employment by industry, ISIC rev 4; accessed June 28, 2022). OECD, Regions and Cities Database.
[21]. BLS, “Quarterly Census of Employment and Wages (labor productivity and costs),” http://www.bls.gov/cew/.
[22]. OECD, Regions and Cities Database (Regional GVA per worker; accessed October 20, 2022).
[23]. “2021 Louisiana Manufacturing Facts,” National Association of Manufacturers, https://www.nam.org/state-manufacturing-data/2021-louisiana-manufacturing-facts/; “2021 Wyoming Manufacturing Facts,” National Association of Manufacturers.
[24]. United States Bureau of Labor Statistics, Industries by Supersector and NAICS Code (NAICS 31–33, NAICS 324, NAICS 325; accessed October 18, 2022), https://www.bls.gov/iag/tgs/iag_index_naics.htm.
[25]. “2021 State of the U.S. Semiconductor Industry” (Semiconductor Industry Association, September 2021), https://www.semiconductors.org/wp-content/uploads/2021/09/2021-SIA-State-of-the-Industry-Report.pdf.
[26]. Destatis Genesis Online, Export and import (federal states, years, classification of goods; accessed August 18, 2022), https://www-genesis.destatis.de/genesis//online?operation=table&code=51000-0034&bypass=true&levelindex=0&levelid=1665775886015#abreadcrumb; Government of Canada, Trade Data Online (accessed June 21, 2022), https://www.ic.gc.ca/app/scr/tdst/tdo/crtr.html?productType=NAICS&lang=eng; I.Stat, Import and export by country and commodity (Nace 2007; accessed August 18, 2022), http://dati.istat.it/Index.aspx?QueryId=18257&lang=en; OECD, Regions and Cities Database (Gross Domestic Product, large TL2 regions); OECD, Exchange Rates; OECD, Purchasing Power Parities; USA Trade Online, State Export Data (Origin of Movement, NAICS; accessed June 22, 2022), https://usatrade.census.gov/data/Perspective60/Dim/dimension.aspx?ReportId=6542.
[27]. Eduardo Borensztein, Jose De Gregorio, and Jong-Wha Lee, “How Does Foreign Direct Investment Affect Economic Growth?” NBER Working Paper Series, no. 5057 (March 1995), https://www.sciencedirect.com/science/article/abs/pii/S0022199697000330; W.N.M. Azman-Saini, Ahmad Zubaidi Baharumshah, and Siong Hook Law, “Foreign Direct Investment, Economic Freedom and Economic Growth: International Evidence,” Economic Modelling, no. 27 (2010): 1079–1089, https://www.sciencedirect.com/science/article/abs/pii/S0264999310000635.
[28]. Deutsche Bundesbank, Direct Investment Stocks of Federal States: Reporting Year 2019 (Berlin: Deutsche Bundesbank, June 2022), https://www.bundesbank.de/resource/blob/868846/55ea984eccbae100264da33d747302e1/mL/direktinvestitionen-2019-data.pdf; “FDI Report 2019: Facts and Figures,” Invest Canada, https://fdi2019.investcanada.ca/by-the-numbers; “FDI Report 2021: Facts and Figures,” Invest Canada, https://fdi2021.investcanada.ca/facts-figures; Italian Trade Agency, Data on Foreign Direct Investment (accessed June 24, 2022), https://www.ice.it/it/statistiche/Ide.aspx; OECD, Regions and Cities Database (Gross Domestic Product, large TL2 regions; accessed October 11, 2022); OECD, Exchange Rates (accessed October 11, 2022), https://data.oecd.org/conversion/exchange-rates.htm#indicator-chart; OECD, Purchasing Power Parities (accessed October 11, 2022), https://data.oecd.org/conversion/exchange-rates.htm#indicator-chart; Statistics Canada, Activities of Multinational Enterprises in Canada (Canadian foreign multinationals, by province, sector and industry, enterprise level; accessed October 20, 2022), https://www150.statcan.gc.ca/t1/tbl1/en/tv.action?pid=3610062001; United Nations Conference on Trade and Development (UNCTAD), World Investment Report (WIR) 2018 (New York City: UNCTAD, 2018), https://unctad.org/system/files/official-document/wir2018_en.pdf; UNCTAD, WIR 2019 (New York City: UNCTAD, 2019), https://unctad.org/system/files/official-document/wir2019_en.pdf; UNCTAD, WIR 2020 (New York City: UNCTAD, 2020), https://unctad.org/system/files/official-document/wir2020_en.pdf; United States Bureau of Economic Analysis, International Data (Data on new foreign direct investment in the United States; accessed October 11, 2022), https://apps.bea.gov/iTable/iTable.cfm?reqid=2&step=1&isuri=1; Authors’ calculations.
[29]. Unlike the sources for the other three countries, Canada’s Survey of Household Spending does not differentiate between types of Internet connections (e.g., broadband v dial-up).
[30]. Nina Czernich et al., “Broadband Infrastructure and Economic Growth,” The Economic Journal, no. 121 (May 2011), 505–532, https://doi.org/10.1111/j.1468-0297.2011.02420.x.
[31]. Eurostat, Households with broadband access (accessed November 4, 2022), https://ec.europa.eu/eurostat/databrowser/view/isoc_r_broad_h/default/table?lang=en; Statistics Canada, Dwelling characteristics and household equipment at time of interview (accessed November 4, 2022), https://www150.statcan.gc.ca/t1/tbl1/en/tv.action?pid=1110022801; United States Census Bureau American Consumer Survey, Type of Computer and Internet Subscriptions (Table S2801, 1-year estimates; accessed November 4, 2022), https://data.census.gov/cedsci/table?q=internet&g=0100000US%240400000&y=2019&tid=ACSST1Y2019.S2801.
[32]. Brown H. Hall, Jacques Mairesse, and Pierre Mohnen, “Measuring the Returns to R&D,” NBER Working Paper Series, no. 15622 (December 2009), https://doi.org/10.1016/S0169-7218(10)02008-3.
[33]. Destatis, Expenditure on research and development and its share of GDP by Land (accessed June 22, 2022), https://www.destatis.de/EN/Themes/Society-Environment/Education-Research-Culture/Research-Development/Tables/rd-expenditure-and-gdp-states.html; OECD, Purchasing Power Parity; OECD, Regions and Cities Database (R&D Expenditures by performing sector; June 22, 2022); Statistics Canada, Gross domestic expenditures on research and development (by science type and by funder and performer sector; accessed October 14, 2022), https://www150.statcan.gc.ca/t1/tbl1/en/tv.action?pid=2710027301&pickMembers; Statistics Canada, Gross domestic product (expenditure-based, provincial and territorial, annual; accessed October 20, 2022), https://www150.statcan.gc.ca/t1/tbl1/en/tv.action?pid=3610022201; United States National Science Foundation, National Patterns of R&D Resources: 2019–2020 Data Update (Table 10; accessed October 19, 2022), https://ncses.nsf.gov/pubs/nsf22320.
[34]. Government of Canada, Personnel engaged in research and development (by geography; accessed June 22, 2022), https://open.canada.ca/data/en/dataset/fd1c32a0-aca9-4282-af9d-fa85b3b4c4b5/resource/3409fd31-4e2c-4758-bd63-0538f4a4a083; OECD, Regions and Cities Database (R&D Personnel by Sector; accessed June 22, 2022); “Our Labs,” The National Laboratories, https://nationallabs.org/our-labs/where-we-are/; Statistics Canada, Job vacancies, payroll employees, job vacancy rate, and average offered hourly wage (by provinces and territories, quarterly, unadjusted for seasonality; accessed June 22, 2022); United States Bureau of Economic Analysis, Personal income and employment by major component (accessed October 18, 2022), https://apps.bea.gov/iTable/?reqid=70&step=1&acrdn=4; United States National Science Foundation, Higher Education Research and Development Survey Fiscal Year 2018 (Table 77; accessed October 18, 2022), https://ncsesdata.nsf.gov/herd/2018/; United States National Science Foundation, Business Research and Development: 2018 (Table 61; accessed October 17, 2022), https://ncses.nsf.gov/pubs/nsf21312#data-tables.
[35]. David Castellani et al., “R&D and Productivity in the US and EU: Sectoral Specificities and Differences in the Crisis,” IZA Discussion Paper, no. 9937, May 2016, https://papers.ssrn.com/sol3/papers.cfm?abstract_id=2786021.
[36]. OECD, Regions and Cities Database (Patent Applications in regions, PCT, priority year; accessed June 28, 2022).
[37]. Destatis Genesis Online, Enterprise births and deaths (Germany, years, economic activities; accessed October 14, 2022); Destatis Genesis Online, Local units (Lander, years, economic sections, employee size classes; accessed October 14, 2022), https://www-genesis.destatis.de/genesis/online?language=en&sequenz=statistikTabellen&selectionname=52111#abreadcrumb; Dascoli and Ezell, “The North American Subnational Innovation Competitiveness Index”; OECD, Regions and Cities Database (Employer enterprise demography, large TL2 and small TL3 regions; accessed June 22, 2022); Expert Commission for Research and Innovation 2021, Start-Ups (Abb C 5-4; accessed October 14, 2022), https://www.e-fi.de/fileadmin/Assets/Themenverzeichnis/Inhaltskapitel_2021/EFI_Gutachten_2021_C5.pdf.
[38]. “A Nation of Entrepreneurs: The Changing Face of Canadian Entrepreneurship,” Business Development Bank of Canada, October 2019, https://www.bdc.ca/EN/Documents/analysis_research/bdc-etude-sbw-nation-entrepreneurs.pdf?utm_campaign=Changing-faces-Study-2019--EN.
[39]. Fuerlinger et al., “The role of the state in the entrepreneurship ecosystem: insights from Germany” (Triple Helix, February 2015), https://triplehelixjournal.springeropen.com/articles/10.1186/s40604-014-0015-9.
[40]. Authors’ own calculation based on Statistics Canada (physical flow account for greenhouse gas emissions by provinces and territories, United Nations Framework Convention on Climate Change (UNFCCC), 2018; accessed October 14, 2022), https://www150.statcan.gc.ca/t1/tbl1/en/cv.action?pid=3810009701; United States Environmental Protection Agency (State GHG Emissions and Removals, Total Emissions by state), https://www.epa.gov/ghgemissions/state-ghg-emissions-and-removals; Moran et al., “Estimating CO2 emissions for 108 000 European cities” (Earth Syst. Sci. Data, February 2022), https://essd.copernicus.org/articles/14/845/2022/; OECD, Environment Database (Air and Climate, Greenhouse gas emissions; accessed October 14, 2022); OECD, Regions and Cities Database (Regional Statistics, Regional Economy, Gross Domestic Products, Small regions TL3, Current prices, Current PPP, 2018; accessed October 14, 2022).
[41]. Roland Tricot, “Venture Capital Investments in Artificial Intelligence,” OECD Digital Economy Papers, September 2021, https://doi.org/10.1787/f97beae7-en.
[42]. Authors’ own calculation based on Marco Dividdi and Gianluca Galgano, “EY Venture Capital Barometer 2020: Italy” (EY, February 2021), https://assets.ey.com/content/dam/ey-sites/ey-com/it_it/news/2021/february/ey-vc-barometer2020_final23_02_2021.pdf; “MoneyTree Canada Report 2017” (PwC and CB Insights, January 2018), https://www.cbinsights.com/reports/CB-Insights_MoneyTree-Canada-Q4-2017.pdf; “MoneyTree Canada Report: Q4 and Full Year 2018” (PwC and CB Insights, January 2019), https://www.cbinsights.com/reports/CB-Insights_MoneyTree-Canada-Q4-2018.pdf; “Canada Venture Capital H2 2019” (PwC and CB Insights, February 2020), https://www.cbinsights.com/research/report/canada-venture-capital-h2-2019/; OECD, Exchange Rates; OECD, Purchasing Power Parities; OECD, Regions and Cities Database (Gross Domestic Product, large TL2 regions); OECD, Regions and Cities Database (Regional Employment by industry); Bundesverband Deutscher Kapitalbeteiligungsgesellschaften (BVK), BVK-Statistiken Deutschland, BVK-Statistik 2021 – Tabellen, https://www.bvkap.de/statistiken/bvk-statistiken-deutschland; United States National Science Foundation, Venture Capital Disbursed pre $1 Million of Gross Domestic Product (accessed October 11, 2022), https://ncses.nsf.gov/indicators/states/indicator/venture-capital-per-1-million-state-gdp.
[43]. United States National Science Foundation, Venture Capital Disbursed pre $1 Million of Gross Domestic Product (accessed October 11, 2022), https://ncses.nsf.gov/indicators/states/indicator/venture-capital-per-1-million-state-gdp.
[44]. Parisa Mahboubi, “The Knowledge Gap: Canada Faces a Shortage in Digital and STEM Skills,” C.D. Howe Institute, August 2022, https://www.cdhowe.org/sites/default/files/2022-08/Commentary_626.pdf.
[45]. Ibid.
[46]. Wayner et al., “Several Perspectives on Canada’s Technology Future 2030-35” (National Research Council Canada, Page 26, April 2021), https://nrc.canada.ca/sites/default/files/2021-07/on-the-horizon-e.pdf.
[47]. John Lester, “Tax Support for R&D and Intellectual Property: Time for Some Bold Moves” (C.D. Howe Institute, July 19, 2022), https://www.cdhowe.org/sites/default/files/2022-07/E-Brief_330_0718.pdf.
[48]. Ian Clay, “Fact of the Week: Each Hour Worked Contributes Over $16 More to GDP in the United States Than It Does in Canada,” Innovation Files, July 5, 2022, https://itif.org/publications/2022/07/05/each-hour-worked-contributes-usd16-more-to-gdp-in-us-than-canada/; Sources: Organization for Economic Cooperation and Development, Productivity – GDP per hour worked (US dollars; accessed June 27, 2022); Organization for Economic Cooperation and Development, Productivity – Unit labour costs (accessed June 27, 2022).
[49]. Jack Mintz, “We Need to Keep an Eye on U.S. Carbon Policies,” Financial Post, October 6, 2022, https://financialpost.com/opinion/jack-mintz-we-need-to-keep-an-eye-on-u-s-carbon-policies.
[50]. “Exports of goods and services (% of GDP)” (The World Bank, 2019, Germany, United States), https://data.worldbank.org/indicator/NE.EXP.GNFS.ZS?locations=US.
[51]. Kuo et al., “Industrial revitalization via industry 4.0 – A comparative policy analysis among China, Germany and the USA” (KeAi, March 2019), https://www.sciencedirect.com/science/article/pii/S2589791819300039.
[52]. Robert D. Atkinson and Caleb Foote, “The 2020 State New Economy Index” (ITIF, October 2020), https://itif.org/publications/2020/10/19/2020-state-new-economy-index/; Luke Dascoli and Stephen Ezell, “North American Subnational Innovation Competitiveness Index” (ITIF, June 2022), https://itif.org/publications/2022/06/21/north-american-subnational-innovation-competitiveness-index/.
[53]. Stephen Ezell and Robert D. Atkinson, “50 Ways to Leave Your Competitiveness Woes Behind: A National Traded Sector Competitiveness Strategy” (ITIF, September 2012), https://itif.org/events/2012/09/20/fifty-ways-leave-your-competitiveness-woes-behind-national-traded-sector/.
[54]. Luke Dascoli and Stephen Ezell, “North American Subnational Innovation Competitiveness Index” (ITIF, June 2022), https://itif.org/publications/2022/06/21/north-american-subnational-innovation-competitiveness-index/.
[55]. Cited correlations come from National Science Board, Science & Engineering Indicators 2016 (Arlington, VA: National Science Foundation, 2016), Table 8-48, “Academic Patents Awarded per 1,000 Science, Engineering, and Health Doctorate Holders in Academia,” https://www.nsf.gov/statistics/2016/nsb20161/uploads/1/13/tt08-48.pdf; and Robert D. Atkinson and John Wu, “The 2017 State New Economy Index” (ITIF, June 2017), https://itif.org/publications/2017/11/06/2017-state-new-economy-index; See also: John Wu and Robert D. Atkinson, “How Technology-Based Start-Ups Support U.S. Economic Growth” (ITIF, November 2017), https://www.itif.org/publications/2017/11/28/how-technology-based-start-ups-support-us-economicgrowth.
[56]. Ibid.
[57]. Office of United States Trade Representative, “USMCA: Chapter 17-Financial-Services,” https://ustr.gov/sites/default/files/files/agreements/FTA/USMCA/Text/17-Financial-Services.pdf; “USMCA: Chapter 19-Digital Trade,” https://ustr.gov/sites/default/files/files/agreements/FTA/USMCA/Text/19-Digital-Trade.pdf.
[58]. National Science Foundation (NSF), National Patterns of R&D Resources: 2019–20 Data Update, Table 1-2, https://ncses.nsf.gov/pubs/nsf22320.
[59]. Caleb Foote and Robert D. Atkinson, “Federal Support for R&D Continues Its Ignominious Slide,” Innovation Files, August 12, 2019, https://itif.org/publications/2019/08/12/federal-support-rd-continues-its-ignominious-slide/.
[60]. Stephen Ezell and Stefan Koester, “Three Cheers for the CHIPS and Science Act of 2022! Now, Let’s Get Back to Work,” Innovation Files, July 29, 2022, https://itif.org/publications/2022/07/29/three-cheers-for-the-chips-and-science-act-of-2022-now-lets-get-back-to-work/.
[61]. Robert D. Atkinson, “The Hamilton Index: Assessing National Performance in the Competition for Advanced Industries” (ITIF, June 2022), https://itif.org/publications/2022/06/08/the-hamilton-index-assessing-national-performance-in-the-competition-for-advanced-industries/.
[62]. Robert D. Atkinson, Mark Muro, and Jacob Whiton, The Case for Growth Centers: How to Spread Tech Innovation Across America (ITIF, December 2019), https://itif.org/publications/2019/12/09/case-growth-centers-how-spread-tech-innovation-across-america/.
[63]. John Lester and Jacek Warda, “Enhanced Tax Incentives for R&D Would Make Americans Richer” (ITIF, September 2020), https://www2.itif.org/2020-enhanced-tax-incentives-rd.pdf.
[64]. Luke Dascoli and Stephen Ezell, “North American Subnational Innovation Competitiveness Index” (ITIF, June 2022), https://itif.org/publications/2022/06/21/north-american-subnational-innovation-competitiveness-index/.
[65]. Stephen Ezell, “Policy Recommendations to Stimulate U.S. Manufacturing Innovation” (ITIF, May 2020), https://itif.org/publications/2020/05/18/policy-recommendations-stimulate-us-manufacturing-innovation/.
