


The Hidden Toll of Drug Price Controls: Fewer New Treatments and Higher Medical Costs for the World

When nations implement pharmaceutical price controls, they reduce pharmaceutical revenues, which then reduces investments in further R&D, limiting future generations’ access to new novel treatments needed to fight diseases such as cancer, Alzheimer’s, heart disease, and diabetes.
KEY TAKEAWAYS
Key Takeaways
Contents
Pharmaceutical Price Controls. 3
Price Regulations’ Impact on Revenue. 6
Impact of Reduced revenues On R&D.. 8
Impact of Additional R&D Investment on New Drugs. 10
Impact of New Drugs on Life Expectancy and Savings. 12
Case Study: Europe’s Pharmaceutical Revenue and New Drugs. 14
Introduction
Government-imposed price regulations on the pharmaceutical sector are the health equivalent of not signing the Paris Agreement. When it comes to climate change, 196 parties signed the Climate Accords, agreeing to contribute their fair share, including accepting higher energy prices, to fighting climate change.[1] French President Macron was emblematic when he stated, “We will not sacrifice our commitments to the climate … so all countries must continue to uphold all their commitments,” which include spending more money.[2]
Yet, when it comes to financial solidarity for the health of people around the world, France is happy to pay almost half as much for drugs as the United States pays. Indeed, when it comes to contributing to the development of new drugs to treat diseases, many wealthy countries impose severe price controls, free riding off a few nations such as the United States, and thereby shirk their responsibility to contribute to the health of future generations. According to multiple studies, whereas “US policy discussions of drug pricing issues commonly include their likely effects on the incentives for innovation, that is less common in discussions of pricing in other countries. Indeed, there appear to be fewer concerns expressed by [rest of world] authorities about the future supply of innovative pharmaceuticals.”[3] In contrast to their being good Samaritans on climate, when it comes to drug innovation, countries imposing price controls are selfish free riders.
When wealthy countries impose price regulations on drugs, they fail to balance the welfare of current and future consumers. Price controls reduce current governments’ and consumers’ health expenditures. As such, many wealthy countries are unwilling to abandon them because doing so means their consumer/taxpayer welfare would fall.[4] In other words, these countries choose to act in their own interest while simultaneously forgetting to consider the health of future citizens, both those in their own country and globally. According to one study, drug price controls reduce “R&D, the flow of new products, firm value, and consumer welfare” for the world.[5] This means today’s price controls will reduce the number of new drugs available to future generations in all countries, including to cure diseases such as heart disease, cancer, stroke, and Alzheimer’s. Conversely, lifting price regulations benefits all countries because it would boost biopharmaceutical revenue, leading to an increase in R&D and the development of new drugs.[6]
The health of future generations is just as important as the well-being of the climate in the future. As such, it is deeply troubling that so many governments of wealthy nations are willing to do their part for climate change but not for the development of new drugs that will determine the health of future generations.
This report examines the pharmaceutical price regulations of OECD countries and their impact on revenue and the development of new drugs.
Pharmaceutical Price Controls
A majority of OECD countries implement some form of pharmaceutical price control on manufacturers on the basis that such measures will reduce drug prices for citizens. Despite Frankel et al.’s findings that “novel drug candidates generate more knowledge spillovers than incremental ones,” many countries choose not to foster ecosystems that support investment in the most-innovative drugs.[7]
Using the RAND Corporation’s International Prescription Drug Price Comparison, the Information Technology and Innovation Foundation (ITIF) examined prescription drug price differences between the United States and 32 OECD countries, using data from Table C.1. “Calculated U.S. Versus Other-Country Price Indices” from the report.[8] More specifically, ITIF used the “Main Results” from the indices in our estimates of manufacturer revenue losses, R&D expenditure losses, and additional drugs lost to price controls.[9] The “Main Results” figures are prescription drug price comparisons between the United States and another country, after controlling for the volume and mix of drugs examined.[10] Moreover, these price indices cannot be compared among one another because of the “different number of presentations analyzed for each pairwise comparison of the United States with another country.”[11] It should be noted that these price indices are not adjusted for per capita GDP purchasing power parity (PPP).[12] As a result, our estimates adjust for this difference. The underlying data used for the Table C.1 was 2018 quarterly manufacturer sales for specific drugs extracted from IQVIA.[13] As a result, the data and figures in this study preceded the United States’ introduction of price controls through the 2023 Inflation Reduction Act. Lastly, this RAND Corporation study is one of many studies examining the impact of drug price controls that has found that other countries are consistently paying less for innovative medicines compared with the United States.[14]
Of the 32 OECD countries with available data, all had lower prescription drug prices than the United States, which historically has not imposed price controls on its pharmaceutical sector.[15] Even after adjusting for GDP per capita, 30 countries still had lower prescription drug prices than the United States in 2018.[16] (See table 1.) Luxembourg (403.1 percent lower than the United States), Turkey (246.8 percent lower), and Norway (229.3 percent lower) had the lowest prescription drug prices.[17] In contrast, Chile (25 percent higher than the United States) and Mexico (45.1 percent higher) had the highest prescription drug prices in 2018 on a GDP per capita-adjusted basis (mainly because both nations have relatively lower incomes).[18] In other words, many OECD countries implement some form of drug price controls, leading to lower drug prices compared with an environment without price controls.
Table 1: Assessment of OECD countries’ GDP per capita-adjusted prescription drug price levels using RAND Corporation study (numbers over 100 indicate 2018 prices lower than the United States’)[19]
|
Country |
Price Index: |
Country |
Price Index: |
|
Luxembourg |
503.1 |
Lithuania |
182.7 |
|
Turkey |
346.8 |
Canada |
176.9 |
|
Norway |
329.3 |
Finland |
175.9 |
|
Ireland |
270.6 |
Czech Republic |
167.1 |
|
Australia |
249.9 |
Slovenia |
163.3 |
|
Sweden |
237.4 |
Italy |
158.3 |
|
Netherlands |
222.4 |
Greece |
155.7 |
|
Korea |
200.3 |
Portugal |
154.4 |
|
Belgium |
198.3 |
Spain |
152.8 |
|
Switzerland |
195.6 |
Japan |
150.0 |
|
New Zealand |
191.2 |
Poland |
140.9 |
|
Austria |
188.5 |
Latvia |
140.8 |
|
United Kingdom |
188.0 |
Hungary |
131.7 |
|
Germany |
187.3 |
United States |
100.0 |
|
Slovakia |
186.6 |
Chile |
75.0 |
|
Estonia |
185.3 |
Mexico |
54.9 |
|
France |
183.7 |
Pharmaceutical price controls force drug prices below their market value. For example, Brekke, Grasdal, and Holmas found that Norway’s reference pricing policy reduced prices for brand-name and generic drugs.[20] Historically, the United States and the few countries without stringent price controls have provided a strong baseline for drug prices in an environment without extensive price control measures. As a result, five academic studies find that drug prices in comparison countries with price control measures were at least 30 percent lower than in the United States, suggesting that the average drug price was 30 percent below those drugs’ free market value.[21] According to a more recent RAND Corporation study, pharmaceutical price controls continue to reduce prescription drug prices by an average of 156 percent in 32 OECD countries compared with the United States.[22]
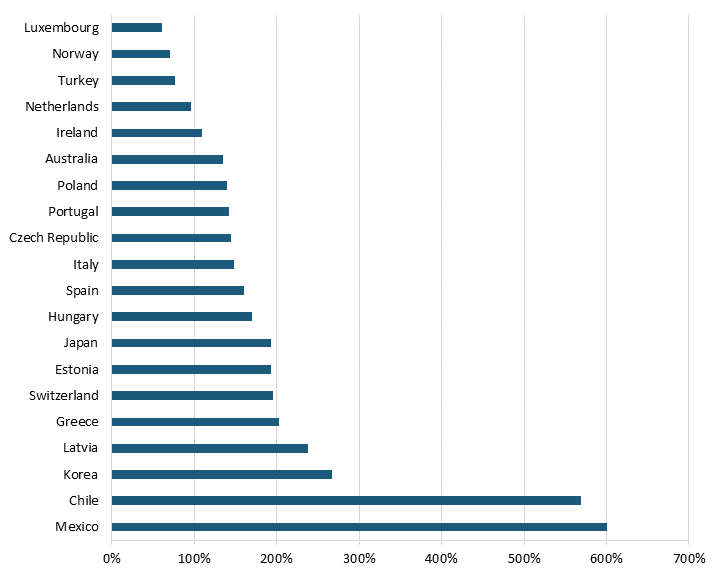
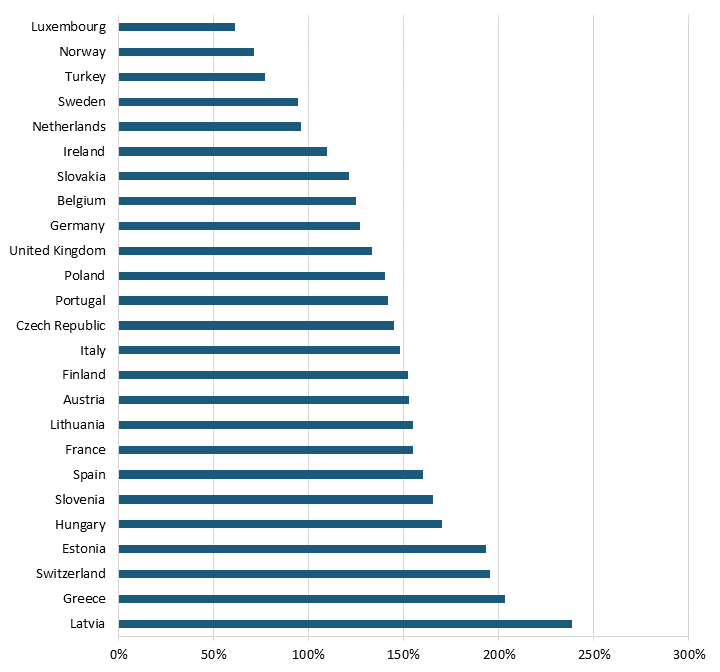
Pharmaceutical price controls tend to lower brand-name originator drug prices while raising the price of generic and brand-name nonoriginator drugs. Even after adjusting for GDP per capita, all 32 OECD countries with available data had lower brand-name originator drug prices than the United States, where there have historically been no drug price controls—although the Biden administration has begun a process of implementing them for Medicare Part D drugs through provisions in the Inflation Reduction Act.[23] (See figure 1 and figure 2.) In other words, the average OECD country likely imposes some form of forced price reduction on brand-name originator drugs. In 2018, the average price of brand-name originator drugs for these 32 countries was 177.9 percent lower than the United States’.[24] In contrast, 26 of 32 OECD countries had higher unbranded generics and brand-name non-originator drug prices than the United States.[25] In 2018, the average price of generics and brand-name non-originator drugs was 26.7 percent higher in these other nations than in the United States.[26] In other words, pharmaceutical price controls disincentivize manufacturers from developing new medicines while incentivizing the production of generics (which, of course, unwittingly endangers the availability of more generic medicines in the future, as fewer new innovative medicines are created and thus, in turn, can’t become future generics.)
Figure 1: Brand-name originator drug prices relative to U.S. prices[27]
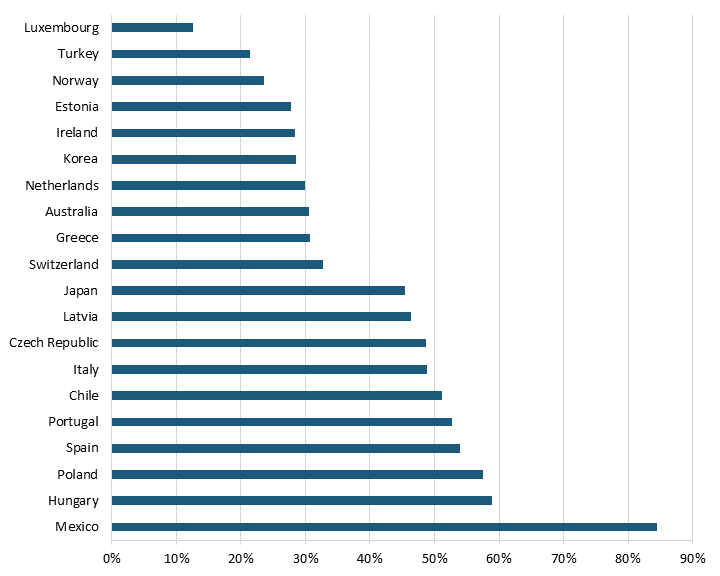
Figure 2: Unbranded generics and brand-name nonoriginator drug prices relative to U.S. prices[28]
Price Regulations’ Impact on Revenue
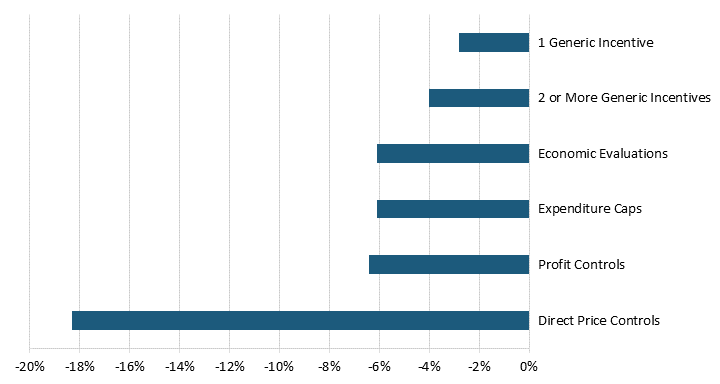
By definition, price regulations reduce global pharmaceutical revenues. According to a 2004 United States Department of Commerce report, drug price regulations in 11 OECD countries reduced pharmaceutical revenues by 25 to 38 percent.[29] A more recent study of 19 OECD countries finds that five out of six broad categories of pharmaceutical price controls reduced revenues.[30] Direct price controls, where regulators directly set drug prices through price negotiations or other means, had the most significant negative impact on pharmaceutical revenues, reducing them by 18.3 percent.[31] Although not as substantial, economic evaluation and budget regulations reduced a country’s pharmaceutical revenue by 6.1 percent.[32] (See figure 3.) In other words, price control measures reduce pharmaceutical revenues and, subsequently, the revenue that drives R&D.
Figure 3: Price regulations’ impacts on revenue[33]
Price control measures reduce pharmaceutical revenues and, subsequently, the revenue that drives R&D.
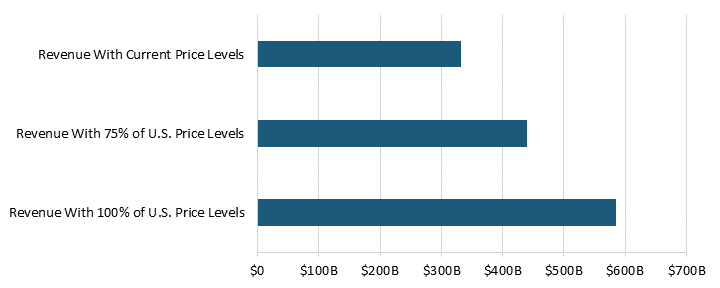
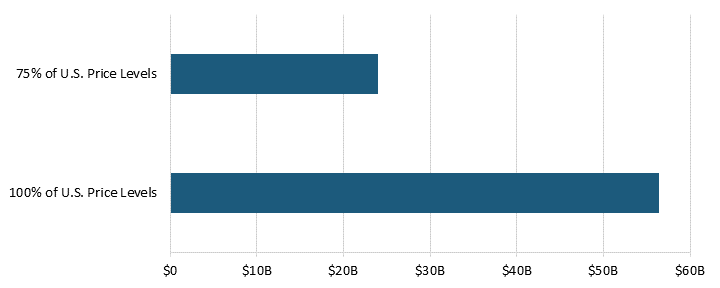
In 2018, pharmaceutical price controls in 32 OECD countries (not including the United States) reduced manufacturer sales revenue by 77 percent, or $254 billion.[34] These countries had a combined pharmaceutical manufacturer sales revenue of $331.3 million at current price control levels.[35] If these OECD countries reduced price controls and raised their prices to 75 percent of U.S. levels, revenue would increase by $108 billion.[36] Without price controls—if countries raised their prices to 100 percent of U.S. levels—the sales revenue would be $585.4 billion.[37] (See figure 4.)
Figure 4: Pharmaceutical manufacturer sales revenue for varying levels of price controls for 32 OECD countries[38]
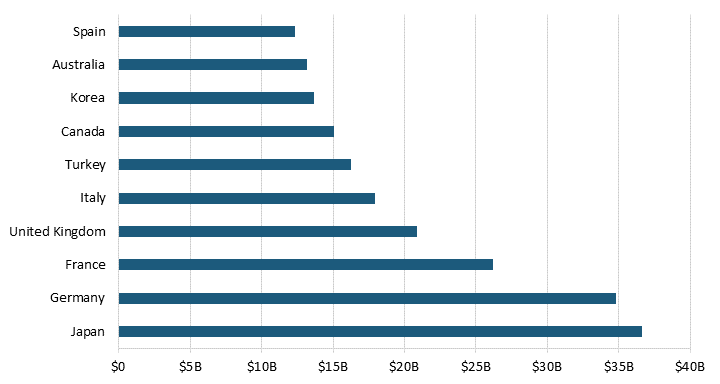
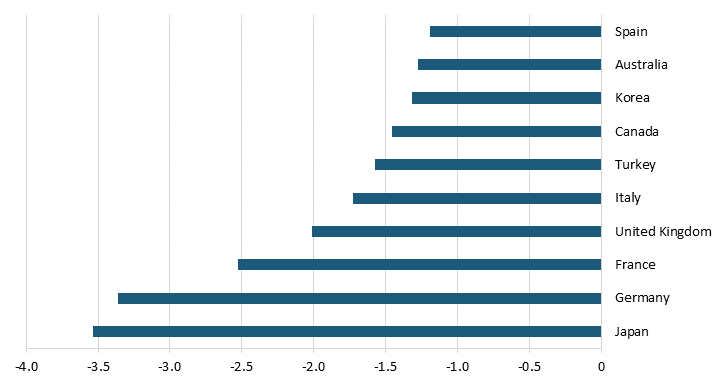
Countries that spend more on prescription drugs and impose extensive forced price reduction on their pharmaceutical sector reduced manufacturers’ revenue the most. The top 10 countries that negatively impact pharmaceutical manufacturers’ revenue the most reduce revenue by $206.9 billion.[39] At the top of the list, Japan’s price controls reduced manufacturers’ revenue by $36.6 billion and Germany’s reduced revenue by $34.8 billion.[40] (See figure 5.) In other words, as a result of countries’ independent and self-interested behavior, the existence of new drugs falls short of the ideal worldwide level.[41]
Figure 5: Manufacturer revenue losses for the top 10 countries with the most extreme price reductions[42]
Impact of Reduced revenues On R&D
Reducing pharmaceutical companies’ revenues disincentivizes them from investing in R&D. According to multiple academic studies, prices and profits are strongly linked to pharmaceutical manufacturers’ investments in R&D.[43] Abbott and Vernon found that price regulations on the sector “significantly diminish the incentive to undertake early stage R&D investment.”[44] They estimated that cutting prices in the United States, a country with few price regulations, by 40–50 percent would lead to between 30 and 60 percent fewer R&D projects.[45] Another study finds that R&D investments increase with real drug prices and estimates an elasticity of 0.6.[46] In other words, an increase of 10 percent in the growth of real drug prices is associated with an increase of 6 percent in the growth of R&D intensity.[47] Moreover, the Congressional Budget Office (CBO) has found that pharmaceutical companies need to “earn a 61.8 percent rate of return on successful new drugs … to see a 4.8 percent after-tax rate of return on their investment” because the drug development failure rate is so high.[48]
Pharmaceutical firms view current drug price regulations as likely to continue, reducing their potential profits while disincentivizing their investment in R&D.[49] According to Lakdawalla, since cash flow “appears to be one of the most empirically important determinants of private R&D spending by private pharmaceutical firms … [even] short term deviations in profitability … predict R&D expenditures.”[50] As a result, the OECD’s “Pharmaceutical Pricing Policies in a Global Market” report finds that “there is a high degree of correlation between sales revenues and R&D expenditure,” while Henderson and Cockburn noted that “R&D expenditures are directly proportional to the amount of sales revenues available to undertake R&D investments.”[51]
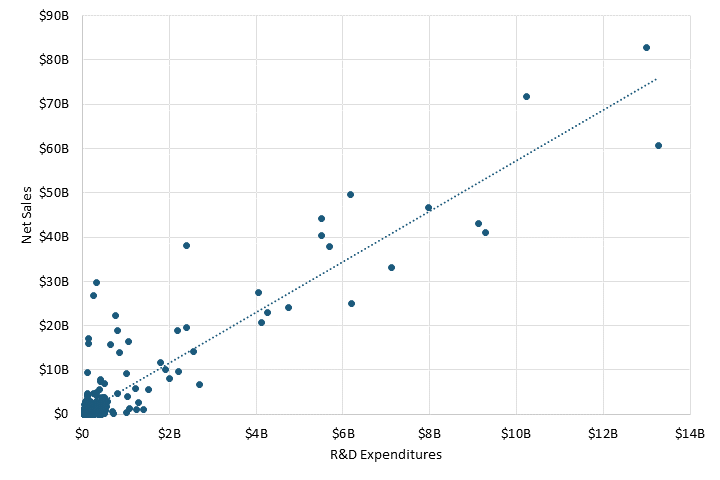
Pharmaceutical sales revenue continues to be associated with investments in R&D. A correlation between net sales and R&D expenditures for 478 pharmaceutical companies in 2021 resulted in a strong coefficient of 0.92.[52] (See figure 6.) In other words, pharmaceutical companies with higher net sales tend to invest more in R&D, meaning revenue is a critical factor in how much a pharmaceutical company invests in R&D.
Figure 6: Net sales and R&D expenditures for large pharmaceutical companies[53]
Revenue lost from price regulations reduces the cash flow available for R&D expenditures. According to the Pharmaceutical Research and Manufacturers of America (PhRMA), the top pharmaceutical companies in the United States invested 22.2 percent of their domestic sales on domestic R&D in 2018.[54] In other words, this suggests that pharmaceutical companies generally invest 22.2 percent in R&D in an environment without price controls. As a result, pharmaceutical companies lost $56.4 billion, or 22.2 percent of the $254.1 billion in revenue losses, in additional R&D expenditures to price regulations in 32 OECD countries.[55] Moreover, even if these countries reduced price controls so that prices rose to 75 percent of U.S. levels, pharmaceutical companies could have increased R&D expenditures by an additional $23.9 billion.[56] (See figure 7.)
Figure 7: Additional R&D expenditures from varying levels of price controls for 32 OECD countries[57]
Defenders of price controls know that they are on the weakest ground when it comes to the argument that controls hurt R&D and, in turn, drug development. As such, many make spurious claims that this relationship is, in fact, not true. For example, a report by Congresswoman Katie Porter (D-CA) asserts that the pharmaceutical sector could still be profitable even if it lost $1 trillion in sales, implying that price controls simply reduce profits.[58] However, the study cited in the Porter report uses return on invested capital as its measure of profitability, which “poorly reflects the profitability of R&D-intensive industry since R&D is not capitalized but expensed.”[59] Others erroneously assert that price controls just limit extraneous expenditures. Yet, Frech et. al. found that the revenues from higher prices “represent an investment in pharmaceutical innovation that delivers large worldwide social returns … [and] are considered as ‘quasi-rents’ rather than monopoly profits in that they incentivize and guide essential sunk costs.”[60]
Impact of Additional R&D Investment on New Drugs
Price regulations reduce the amount of R&D firms would perform in their absence. According to Filson, if the United States adopted pharmaceutical price regulations, firms would conduct less research and, ultimately, reduce the flow of new drugs.[61] In fact, he estimated that price controls in the United States would reduce “the flow of new drugs … by almost 40 percent in the long run.”[62] Another study finds that a pharmaceutical price control regime in the United States would have reduced “over one-third of all actual new drug [or 330 to 365 new drugs] launches brought to the global market” from 1980 to 2001.[63] On the other hand, other studies found that government policies that promote drug profitability increased “new clinical trials, new molecular entities, or new drugs.”[64]
Lower revenue from the price regulations plays a role in reducing the number of new drugs developed. Civon and Malony found that current drug prices are an important determinant of R&D spending, and Giaccotto, Santerre, and Vernon found that prices charged for current drugs are an important determinant of the number of prospective new drugs in the R&D pipeline.[65] Moreover, Acemoglu and Linn noted that “a 1 percent increase in the potential market size for a drug category leads to a 4 to 6 percent increase in the number of new drugs in that category.”[66] Similarly, a study by Precision Economics finds that a conservative 8 percent increase in market size from lifting price controls would lead to a “9 percent increase in the world’s innovation leading to 8 new drugs per year by 2030.”[67] Moreover, the CBO found that a bill that gives the secretary of Health and Human Services the power to negotiate drug prices “would reduce drug companies’ expectations about future revenues,” leading to 8 fewer drugs from 2020 to 2029 and “about 30 fewer drugs in the subsequent 10 years.”[68] In other words, price regulations and lower revenues reduce the incentive for pharmaceutical companies to develop new drugs, hurting future generations’ access to novel treatments while also reducing the current generation’s longevity.[69]
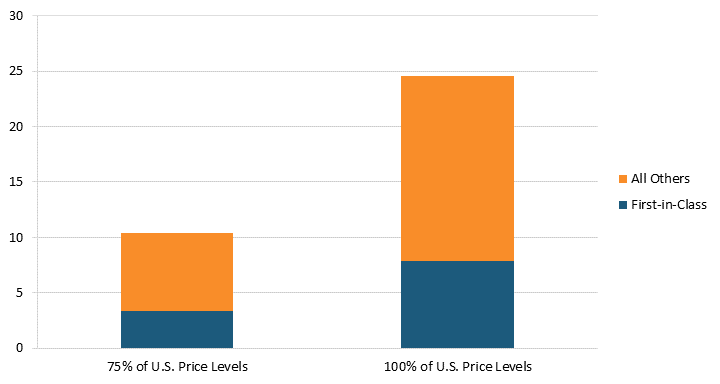
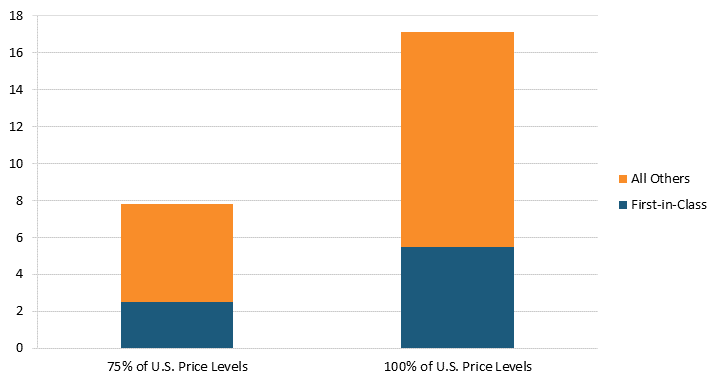
Conversely, lifting price regulations would increase the number of new drugs developed. According to “Deloitte’s 13th Annual Pharmaceutical Innovation Report,” estimates suggest that the average cost of developing a new drug was $2.3 billion in 2022.[70] Our estimates indicate that lifting pharmaceutical price regulations in 32 OECD countries in 2018 would have resulted in an increase of $254.1 billion in global pharmaceutical sales revenue and $56.4 billion in additional R&D expenditures.[71] As a result, the additional R&D expenditure from lifting price controls so that prices are 100 percent of U.S. price levels for a single year could result in an additional 25 new drugs.[72] Even lifting price controls so that prices are 75 percent of U.S. price levels could result in an additional 10 new drugs.[73] Moreover, since the Center for Drug Evaluation and Research identified that 32 percent of novel drugs approved were first-in-class drugs, we estimate that eight new first-in-class drugs were lost to price controls in these 32 OECD countries.[74] If the Center for Drug Evaluation and Research’s 2019 estimates for first-in-class drugs were used, we estimate that 11 new first-in-class drugs would have been lost to price controls.[75] (See figure 8.) In other words, pharmaceutical price controls reduce the number of new drugs developed each year; hence, even lifting some price controls could increase the number of new drugs developed.
Figure 8: Additional new drugs produced when prices are raised to 75 percent or 100 percent of U.S. levels[76]
Of the 25 new drugs lost to price controls, 20 came from these top 10 countries.[77] If Japan paid its fair share instead of free-riding on the United States, an estimated 3.5 additional new drugs would be developed every year globally.[78] Germany’s and France’s price controls led to the loss 3.4 and 2.5 new drugs, respectively.[79] Even smaller countries, such as Spain and Australia, play a role in hindering new drug development, with their price controls reducing new drugs at a pace of 1.3 and 1.2 per year, respectively.[80] (See figure 9.)
Figure 9: Number of drugs lost in the top 10 countries with the most extreme price reductions[81]
Impact of New Drugs on Life Expectancy and Savings
New drugs reduce mortality and increase life expectancy. Cutler et al. found that pharmaceuticals accounted for 35 percent of the 3.3-year increase in life expectancy Americans experienced from 1990 to 2015 (from 75.4 to 78.7 years of age).[82] According to Lichtenberg, the source of a 6.9-year increase in life expectancy between 1960 and 1997 for Americans was partially attributed to the discovery of new pharmaceuticals.[83] He found that the approval of one new drug in the United States resulted in a 0.093-year, or just over a month, increase in life expectancy, totaling a “life-years gained per year from a permanent unit increase in new drug approvals … [to] about 372 thousand.”[84] Another study by Buxbaum finds that “pharmaceuticals were second only to Public Health Measures in importance, and contributed 35 percent of the overall gain.”[85]
However, new pharmaceuticals are not just beneficial to Americans’ life expectancy. A study by Lichtenberg of 27 countries finds that the launch of a new drug in the prior 11 years is estimated to increase life expectancy by 3 percent for those younger than 85 years old, and a new drug launched more than 12 years prior increases life expectancy by 5.5 percent.[86] While there are certainly well-known methodological challenges with calculating quality-adjusted life years, there’s no doubt the estimates are quite significant. For instance, Topel and Murphy estimated that “the average value of a life year is approximately $150,000.”[87] As a result, the increase in life expectancy could be valued at billions for a country.
Moreover, new drugs reduce health expenditures. According to Lichtenberg, the cost of medical care to increase life expectancy by a year is $11,000 in the United States.[88] In comparison, the pharmaceutical R&D expenditure to increase life expectancy by a year is only $1,345, 8.17 times cheaper than medical care.[89] Moreover, Lichtenberg found a positive and highly significant relationship between drug age and the number of hospital stays, “indicating that persons consuming newer drugs had significantly fewer hospital stays.”[90] He estimated that using newer drugs reduced hospital costs by $56 per stay.[91] Another study by Lichtenberg estimates that “the value of reductions in work loss days and hospital admissions attributable to pharmaceutical innovation was three times larger than the cost of new drugs consumed” from 1997 to 2010.[92] In other words, new drugs are cost-effective treatments that reduce health expenditures. Far from being viewed solely or even principally as a cost, medicines (and their prices) should be viewed as a key component of the solution to burgeoning overall health care system costs.
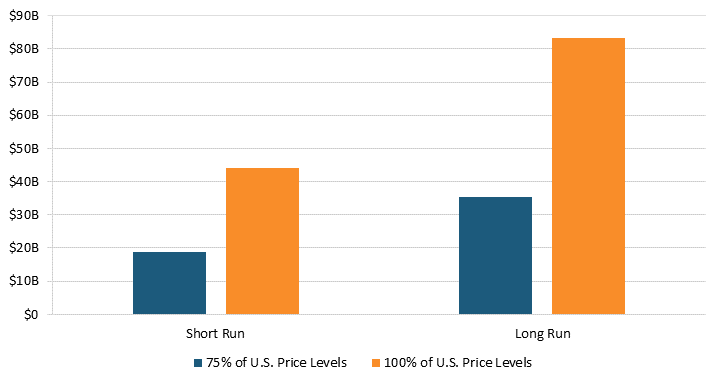
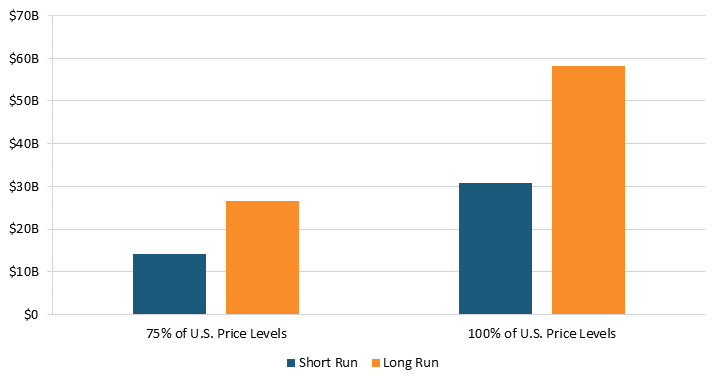
Our estimates suggest that removing pharmaceutical price controls will reduce health expenditures. According to Santerre, one additional new drug reduces medical expenses by approximately $1.8 billion per year in the short run and $3.4 billion per year in the long run.[93] As a result, lifting price regulations in 32 OECD countries would have resulted in at least 25 new drugs and $44.2 billion in health expenditure savings in the short run.[94] In the long run, these 25 new drugs could have reduced health expenditures by $83.4 billion.[95] (See figure 10.) In other words, higher health expenditures in the present from lifting price controls today mean more new treatments for future generations and lower health expenditures tomorrow.
Figure 10: Annual health expenditure savings from new drugs after lifting prices to 75 percent or 100 percent of U.S. prices[96]
Moreover, these health expenditure savings are just the tip of the iceberg: New drugs will also reduce costs in other areas, such as loss of work and home care. For example, an 2016 ITIF study finds that productivity loss from not working on account of mental illnesses was $222 billion, meaning that new drugs to treat mental illnesses can reduce both health expenditures and productivity loss from not working.[97] In other words, new drugs reduce costs in many areas while also providing the next generation with more medicines.
Case Study: Europe’s Pharmaceutical Revenue and New Drugs
Europe was once the global life sciences leader, but stringent price regulation imposed on the sector in the past decades has eliminated that title. In the 1970s, European-headquartered pharmaceutical companies introduced more than twice as many new drugs as U.S. companies (149 to 66).[98] In fact, the industry invested 50 percent more in Europe than it did in the United States in 1990.[99] In other words, Europe was the global innovator of pharmaceuticals, introducing the vast majority of new drugs just a few decades ago.
The decision to impose price regulations ultimately cost Europe its pharmaceutical leadership. According to the European Federation of Pharmaceutical Industries and Associations (EFPIA), “today, 47 percent of global new treatments are of U.S. origin compared to just 22 percent emanating from Europe. It represents a complete reversal of the situation just 25 years ago.”[100] This is because many “European countries have driven prices so low that many new drugs can no longer recoup their development costs before patents expire.”[101] As a result, “these policies, most of which seek only short-run gains, seriously disrupt the functioning of the market and sap the industry’s [and country’s] ability to compete in the long-run.”[102]
All European OECD countries with available data had lower prescription drug prices, even after controlling for GDP per capita, meaning that these countries likely impose some price regulation on their pharmaceutical sector.[103] The average European country had drug prices that were 105.9 percent lower than the United States.[104] For example, if the antidiabetic drug metformin costs $240 a year in the United States, Europe would pay $117 instead due to price controls.[105] One of the reasons these countries cite for their drug price regulations is the potential high public health expenditures the government and citizens will have to pay if prices are not artificially reduced.[106] And studies show that these measures do indeed reduce health expenditure, but they also reduce profitability and R&D intensity. According to Eger and Mahlich, the “higher the share of sales a firm generates in Europe, the lower is its overall profitability and the lower is its R&D intensity…. Beyond a threshold of 33% of sales generated in Europe, a higher presence in Europe is associated with lower R&D investments.”[107]
The decision to impose price regulations ultimately cost Europe its pharmaceutical leadership.
Pharmaceutical price controls also tend to lower brand-name originator drug prices while raising the price of generic and brand-name nonoriginator drugs in Europe. Even after adjusting for GDP per capita, all 25 OECD countries with available data had lower brand-name originator drug prices than the United States, where there were no drug price controls at the time of the study from which this report’s data is taken, meaning that the average European country likely imposes some form of forced price reduction on brand-name originator drugs.[108] (See figure 11 and figure 12.) In 2018, the average price of brand-name originator drugs for these 25 European countries was 188.6 percent lower than in the United States.[109] In contrast, 20 of the 25 European OECD countries had higher unbranded generics and brand-name nonoriginator drugs than the United States.[110] In 2018, the average price of unbranded generics and brand-name nonoriginator drugs for these countries was 21.3 percent higher than in the United States.[111]
Figure 11: Brand-name originator drug prices relative to U.S. prices[112]
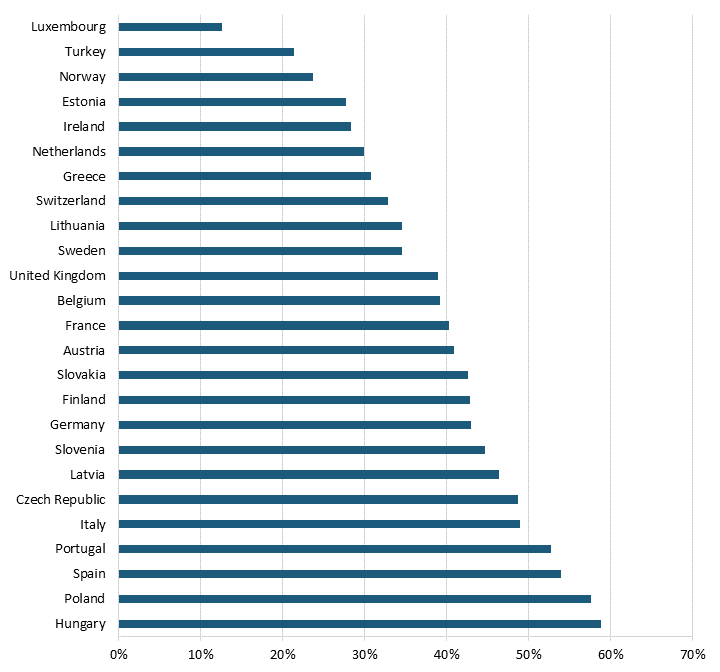
Figure 12: Unbranded generics and brand-name nonoriginator drug prices relative to U.S. prices[113]
Despite the lower price of drugs, European price control regimes significantly reduce pharmaceutical revenues, resulting in fewer novel drugs. In 25 European OECD countries with available data for 2018, the total pharmaceutical manufacturers’ sales revenue without price control would have been $385.7 billion, $177.5 billion more than in an environment with price regulations.[114] This additional $177.5 billion in sales revenue could have resulted in an additional $39.4 billion in R&D expenditures.[115] The additional R&D expenditure could have resulted in 17 new drugs if price controls were lifted so that prices were 100 percent of U.S. price levels.[116] (See figure 13.) Even if prices were raised to just 75 percent of U.S. price levels, the additional R&D expenditure could have resulted in eight new drugs.[117] Moreover, we estimate that 6 of these 17 additional drugs that would be new first-in-class drugs were lost to price controls in these 25 European OECD countries.[118] In other words, price regulations reduce the cost of drugs for the current generation; however, future generations pay the price with fewer treatments for disease.
Figure 13: Additional new drugs when prices for 25 European countries are raised to 75 Percent and 100 Percent of U.S. price levels[119]
While Europe’s drug price controls lead to lower drug prices, one 2004 report shows that Europe’s drug price controls have considerable “social and economic costs in Europe, in the form of delayed access to drugs, poorer health outcomes, decreased investment in research capabilities, and a drain placed on high-value pharmaceutical jobs.”[120] In other words, price regulations decrease consumer costs for medicines but raise them elsewhere, while also severely harming the competitiveness of countries’ biopharmaceutical industries.
The additional R&D expenditure for 25 European countries could have resulted in 17 new drugs if price controls were lifted so that prices were 100 percent of U.S. price levels.
Lifting pharmaceutical pricing controls in European OECD countries would likely lead to reduced health expenditures in the future. For instance, Lichtenberg affirmed that “the value of reductions in work loss days and hospital admissions attributable to pharmaceutical innovation was three times larger than the cost of new drugs consumed” from 1997 to 2010.[121] The additional 17 new drugs developed, had price controls been removed in 2018, for 25 European OECD countries would have reduced health expenditure by $30.8 billion in the short run.[122] In the long run, these European OECD countries could have reduced health expenditures by $58.3 billion by launching these 17 new drugs.[123] (See figure 14.) In other words, price controls may reduce the health expenditures for drugs today, but they increase the health expenditures of tomorrow because fewer new drugs are discovered and available to treat diseases.
Figure 14: Annual health expenditure savings from new drugs after lifting prices to 75 percent and 100 percent of U.S. price levels for 25 European countries[124]
Moreover, more medicines resulting from lifting pharmaceutical price controls in Europe would also benefit the health of Europeans. According to the European Union, “[N]early 600,000 European deaths could be avoided each year if the continent’s healthcare systems simply offered ‘timely and effective medical treatments,’ including access to innovative drugs.”[125]
Price controls may reduce the health expenditures of today, but they increase the health expenditures of tomorrow because fewer new drugs are discovered.
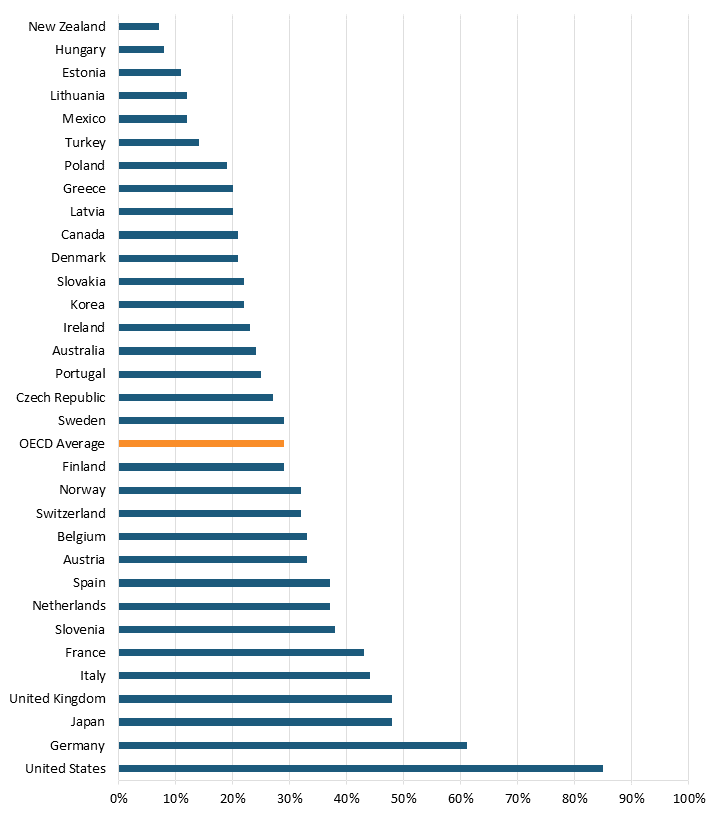
Yet, new drugs take considerable time to enter the European market. For example, 85 percent of 460 new medicines introduced from 2012 to the end of 2021 are now available to U.S. patients.[126] At the same time, only 61 percent are available in Germany, 48 percent in the United Kingdom, and just 21 percent in Denmark.[127] (See figure 15.) Furthermore, eliminating price regulations and promoting pharmaceutical R&D is estimated to increase the longevity of those ages 55 to 59 in 2050 and 2060 more than three times, or 0.3 to 0.4 years of life.[128] In other words, price controls hurt both current and future generations of Europeans with fewer novels drugs and shorter lives.
Figure 15: Percentage of new medicines reimbursed by public insurance plans in OECD countries (of all 460 new medicines launched from 2012 to end of 2021)[129]
Policy Recommendations
There are two paths to the disjuncture in drug pricing between nations. One is that the free-riding nations keep free riding, and the nations living up to their responsibilities of supporting drug development for humanity get fed up and “join the club.” Unfortunately, the Biden administration and Congress have recently succumbed to this impulse and joined the free riders, with the introduction of drug price controls on Medicare Part D drugs in the Inflation Reduction Act. The drug price controls will apply to 10 drugs initially, although this number is scheduled to grow rapidly in subsequent years, meaning that there’s opportunity for a future administration or Congress to reverse or limit the damage these price controls are primed to inflict on both the U.S. biopharmaceutical industry and public health.
The other is that historically responsible nations such as the United States start to “name and shame” the free-riding nations. Just as many nations free ride off the United States’ defense spending and its commitment to NATO and a free world, many nations also free ride off the United States’ historical commitment to driving global drug innovation. The U.S. State Department, the United States Trade Representative’s Office, and others in government need to make it clear to both global “North” and “South” nations that the United States plays an oversized role in ensuring global health through better medicines. It’s time more nations, especially those in the “high-income club” of OECD nations, stopped shirking their responsibilities. As this report shows, there’s a pressing need for other nations to do their part and adequately value, and pay for, innovative medicines. As Frech et al. suggested, for example, “US officials could raise these issues at international negotiations and advocate for higher prices than presently set in high-income ROW countries. A multi-country agreement in this direction would represent a serious effort to support improved world health.” In the absence of that, the United States should file a World Trade Organization case based on the complaint that price controls on the pharmaceutical sector violate intellectual property rights because they enable international arbitrage through parallel trading. In other words, patented pharmaceuticals legally bought in one country are exported to another without the consent of the local owners in the importing market.[130]
In addition, policymakers in OECD countries with price controls should advocate for removing price regulations for the pharmaceutical sector while finding other means to increase access to medicines for the current generation. Stringent price controls on pharmaceuticals reduce the sector’s potential revenue, disincentivizing companies from investing in R&D. Consequently, the next generation of global citizens will suffer from fewer novel drugs. As an additional benefit, price regulations can potentially hamper the competitiveness and innovative capacity of a country’s pharmaceutical sector, as ITIF has highlighted in both the European and Japanese cases.[131]
The United States should reverse the Inflation Reduction Act’s pharmaceutical pricing provisions that force pharmaceutical companies to negotiate prices with the Department of Health and Human Services on the most popular branded drugs that are under Medicare Part B and D.[132] Policymakers should also resist the imposition of broader drug price controls across the U.S. health care system, recognizing the damage this would do to innovation and new drugs in the future.
For instance, in examining the drug price controls proposed in HR 5376 (the Build Back Better Act), Philipson and Durie found that the legislation would reduce revenues by 12.0 percent through 2039, with the reduced revenues meaning R&D spending would fall by about 18.5 percent, or $663 billion. They found that this cut in R&D activity leads to 135 fewer new drugs, while this drop in new drugs is predicted to generate a loss of 331.5 million life years in the United States. Similarly, Vital Transformations has modeled the impacts of the drug pricing provisions of President Biden’s 2024 budget, now proposed by Senator Baldwin (D-MN) as the Smart Prices Act (SPA), which would impose government price setting for selected Medicare drugs at only five years after initial Food and Drug Administration (FDA) approval. They estimated that the expanded government price setting could result in roughly 230 fewer FDA approvals of new medicines over a 10-year period, once the impacts are fully reflected in the pipeline. They further estimates a loss of146,000–223,000 direct biopharmaceutical industry jobs. Moreover, they found that had the drug pricing provisions of the SPA been in place prior to the development of today’s top-selling medicines, 82 of the 121 therapies identified as selected for price setting would likely have not been developed.[133]
Lastly, policymakers must also recognize that less than half of every dollar spent on drugs in the United States goes to the companies actually innovating and manufacturing them.[134] For instance, Brownlee found that from 2013 to 2020, the share of revenues accruing to manufacturers decreased from 66.8 to percent to 49.5 percent.[135] Conversely, the share going to nonmanufacturers increased from 33.2 to 50.5 percent.[136] Further, Brownlee found that brand manufacturers only keep 37 percent of total spending on all prescription medicines, regardless of whether they are brand-name or generic medicines.[137] The work of Neeraj Sood at USC, Brownlee, and others shows that U.S. wholesalers and insurers/pharmacy benefit managers/retailers are at least as—and quite likely much more—profitable than the companies actually innovating and manufacturing drugs. However, the former set of companies aren’t nearly close to reinvesting almost one-quarter of their profits back into R&D, employing nearly one-quarter of America’s R&D workforce, or innovating drugs that exert tremendous impacts on enhancing America’s quality and length of life.[138]
For these reasons, policymakers need to take a much closer look at the role of pharmacy benefits managers (PBMs) in America’s drug payment system. Proposals calling for the imposition of greater fiduciary obligations on the activities of PBMs and increasing drug price transparency (e.g., removal of pharmacy gag clauses and requiring plan sponsors to provide drug price increase information and lower cost-options) should be considered.[139] Moreover, proposals to ensure that the rebates insurers and PBMs negotiate for Medicare Part D drugs are passed through to seniors at the pharmacy counter are crucial. The rebates (averaging nearly 30 percent for Medicare Part D drugs) are usually paid to PBMs in consideration of preferred placement on the insurance plan’s formulary, but the PBMs tend not to share the rebates directly with beneficiaries. Changing this rule change could save older Americans as much as $83 billion at the pharmacy counter over the span of 10 years.[140]
Governments need to balance the well-being of both the current and future generations. Measures need to be taken to ensure access to medicine for the current generation; however, these measures cannot be price controls, because they neglect the well-being of future generations.
Conclusion
Pharmaceutical price regulations in OECD countries reduce the capabilities of bio-pharmaceutical companies to invest in R&D. Pricing regimes reduce the potential revenue pharmaceutical manufacturers receive and their ability to recoup the cost of developing a new drug, disincentivizing them from investing in R&D. When these companies have lower revenues to invest in R&D, fewer new drugs will be introduced in the future. As a result, mortality and morbidity of future generations will be higher than it would be without this free-riding behavior. If nations are willing to pay more for energy to demonstrate their resolve to save the planet from climate change, they should also be willing to pay a bit more for pharmaceuticals to save humanity from the scourge of diseases.
The author would like to thank Robert Atkinson, Stephen Ezell, and Kelli Zhao for their guidance on this report. Any errors or omissions are the author’s responsibility alone.
About the Author
Trelysa Long is a research assistant for antitrust policy with ITIF’s Schumpeter Project on Competition Policy. She was previously an economic policy intern with the U.S. Chamber of Commerce. She earned her bachelor’s degree in economics and political science from the University of California, Irvine.
About ITIF
The Information Technology and Innovation Foundation (ITIF) is an independent 501(c)(3) nonprofit, nonpartisan research and educational institute that has been recognized repeatedly as the world’s leading think tank for science and technology policy. Its mission is to formulate, evaluate, and promote policy solutions that accelerate innovation and boost productivity to spur growth, opportunity, and progress. For more information, visit itif.org/about.
Endnotes
[1]. United Nations Climate Change, The Paris Agreement (Paris: United Nations), https://unfccc.int/process-and-meetings/the-paris-agreement.
[2]. William James, Valerie Volcovici, and Simon Jessop, “At COP 27, climate change framed as battle for survival,” Reuters, November 7, 2022, https://www.reuters.com/business/cop/cop27-were-highway-climate-hell-un-boss-warns-2022-11-07/.
[3]. H. E. Frech, III et al., “Pharmaceutical Pricing and R&D as a Global Public Good” (NBER working paper, May 2023), https://www.nber.org/papers/w31272.
[4]. Darren Filson, “A Markov-perfect equilibrium model of the impacts of price controls on the performance of the pharmaceutical industry,” The RAND Journal of Economics 43, no. 1 (2012), https://www.jstor.org/stable/23209300.
[5]. Ibid.
[6]. Ibid.
[7]. Alexander Frankel et al., “Evaluation and Learning in R&D Investment” (NBER working paper, May 2023), https://www.nber.org/papers/w31290.
[8]. US Health and Human Services, International Prescription Drug Price Comparisons (Appendix C: Table C.1. Calculated US Versus Other-Country Price Indices, 2018), https://aspe.hhs.gov/sites/default/files/documents/ca08ebf0d93dbc0faf270f35bbecf28b/international-prescription-drug-price-comparisons.pdf.
[9]. Ibid.
[10]. Ibid.
[11]. Ibid.
[12]. Ibid.
[13]. Ibid.
[14]. Ibid.
[15]. Ibid.; The World Bank, GDP per capita, PPP (current international $), GDP per capita, PPP for 33 countries), accessed May 23, 2023, https://data.worldbank.org/indicator/NY.GDP.PCAP.PP.CD
[16]. US Health and Human Services, International Prescription Drug Price Comparisons (Appendix C: Table C.1. Calculated US Versus Other-Country Price Indices, 2018; The World Bank, GDP per capita, PPP.
[17]. Ibid.
[18]. Ibid.
[19]. Ibid.
[20]. Darius Lakdawalla, “Economics of the Pharmaceutical Industry,” Journal of Econmic Literature 56, no.2 (2018), https://www.jstor.org/stable/26494193.
[21]. Andrew Mulcahy et al., “International Prescription Drug Price Comparisons” (RAND Corporation, 2021), https://aspe.hhs.gov/sites/default/files/documents/ca08ebf0d93dbc0faf270f35bbecf28b/international-prescription-drug-price-comparisons.pdf.
[22]. Ibid.
[23]. US Health and Human Services, International Prescription Drug Price Comparisons (Appendix C: Table C.1. Calculated US Versus Other-Country Price Indices, 2018; The World Bank, GDP per capita, PPP.
[24]. Ibid.
[25]. Ibid,
[26]. Ibid.
[27]. Ibid.
[28]. Ibid.
[29]. Department of Commerce. Pharmaceutical price controls in OECD Countries: Implications for U.S. consumers, pricing, research and development, and innovation (Washington DC: U.S. Department of Commerce, International Trade Administration, December 2004).
[30]. Neeraj Sood et al., “The effect of regulation on pharmaceutical revenues: experience in nineteen countries,” Health Affairs 28, no. 1 (2009), https://www.ncbi.nlm.nih.gov/pmc/articles/PMC3829766/#R3.
[31]. Ibid.
[32]. Ibid.
[33]. Ibid.
[34]. US Health and Human Services, International Prescription Drug Price Comparisons (Appendix C: Table C.1. Calculated US Versus Other-Country Price Indices and Table 3.1 Prescription Drug Market by Sales and Volume, 2018; The World Bank, GDP per capita, PPP.
[35]. Ibid.
[36]. Ibid.
[37]. Ibid.
[38]. Ibid.
[39]. Ibid.
[40]. Ibid.
[41]. Frech, III et al., “Pharmaceutical Pricing and R&D as a Global Public Good.”
[42]. US Health and Human Services, International Prescription Drug Price Comparisons (Appendix C: Table C.1. Calculated US Versus Other-Country Price Indices and Table 3.1 Prescription Drug Market by Sales and Volume, 2018); The World Bank, GDP per capita, PPP.
[43]. Joe Kennedy, “The Link Between Drug Prices and Research on the Next Generation of Cures” (ITIF, September 2019), https://itif.org/publications/2019/09/09/link-between-drug-prices-and-research-next-generation-cures/.
[44]. Thomas Abbott and John Vernon, “The Cost of US Pharmaceutical Price Regulation: A Financial Simulation Model of R&D Decisions,” Managerial and Decision Economics 28, no. 4/5 (2007), https://www.jstor.org/stable/25151519.
[45]. Ibid.
[46]. Carmelo Giaccotto, Rexford Santerre, and John Vernon, “Drug Prices and Research and Development Investment Behavior in the Pharmaceutical Industry,” The Journal of Law & Economics 48, no. 1 (2005), https://www.jstor.org/stable/10.1086/426882.
[47]. Ibid.
[48]. Stephen Ezell, “Testimony of Stephen J. Ezell, Vice President, Global Innovation Policy at ITIF for Hearing on ‘Prescription Drug Price Inflation: An Urgent Need to Lower Drug Prices in Medicare’” (ITIF, March 16, 2022), https://www2.itif.org/2022-senate-finance-drug-pricing.pdf.
[49]. Kennedy, “The Link Between Drug Prices and Research on the Next Generation of Cures.”
[50]. Lakdawalla, “Economics of the Pharmaceutical Industry.”
[51]. OECD, Key Characteristics of the Pharmaceutical Sector in OECD Economies (OECD, September 2008), 189, http://www.oecd-ilibrary.org/social-issues-migration-health/pharmaceutical-pricing-policies-in-aglobal-market/key-characteristics-of-the-pharmaceutical-sector-in-oecd-economies_9789264044159-2-en.; R. Henderson and I.M. Cockburn, “Scale, Scope, and Spillovers: The Determinants of Research Productivity in the Pharmaceutical Industry” RAND Journal of Economics 27, no. 1 (1996): 32–59.
[52]. European Commission, EU Industrial R&D Investment Scoreboard (World 2500) (R&D spending, sales, profit, capex, and profits for top 2500 companies for 2021/22, accessed February 15, 2023), https://iri.jrc.ec.europa.eu/data.
[53]. Ibid.
[54]. PhRMA, “2022 PhRMA Annual Membership Survey” (industry report, Washington DC: 2022), https://phrma.org/-/media/Project/PhRMA/PhRMA-Org/PhRMA-Refresh/Report-PDFs/P-R/PhRMA_membership-survey_2022_final.pdf.
[55]. US Health and Human Services, International Prescription Drug Price Comparisons (Appendix C: Table C.1. Calculated US Versus Other-Country Price Indices and Table 3.1 Prescription Drug Market by Sales and Volume, 2018); The World Bank, GDP per capita, PPP (current international $) (GDP per capita, PPP; PhRMA, “2022 PhRMA Annual Membership Survey.”
[56]. US Health and Human Services, International Prescription Drug Price Comparisons (Appendix C: Table C.1. Calculated US Versus Other-Country Price Indices and Table 3.1 Prescription Drug Market by Sales and Volume, 2018); The World Bank, GDP per capita, PPP; PhRMA, “2022 PhRMA Annual Membership Survey.”
[57]. US Health and Human Services, International Prescription Drug Price Comparisons (Appendix C: Table C.1. Calculated US Versus Other-Country Price Indices and Table 3.1 Prescription Drug Market by Sales and Volume, 2018); The World Bank, GDP per capita, PPP (current international $) (GDP per capita, PPP; PhRMA, “2022 PhRMA Annual Membership Survey.”
[58]. Robert Atkinson and Stephen Ezell, “Five Fatal Flaws in Rep. Katie Porter’s Indictment of the U.S. Drug Industry” (ITIF, May 2021), https://itif.org/publications/2021/05/20/five-fatal-flaws-rep-katie-porters-indictment-us-drug-industry/.
[59]. Ibid.
[60]. Frech, III et al., “Pharmaceutical Pricing and R&D as a Global Public Good.”
[61]. Filson, “A Markov-perfect equilibrium model of the impacts of price controls on the performance of the pharmaceutical industry.”
[62]. Ibid.
[63]. Giaccotto, Santerre, and Vernon, “Drug Prices and Research and Development Investment Behavior in the Pharmaceutical Industry.”
[64]. Joseph Golec, Shantaram Degde, and John Vernon, “Pharmaceutical R&D Spending and Threats of Price Regulation,” The Journal of Financial and Quantitative Analysis 45, no.1 (2010), https://www.jstor.org/stable/27801481.
[65]. Frech, III et al., “Pharmaceutical Pricing and R&D as a Global Public Good.”
[66]. Daron Acemoglu and Joshua Linn, “Market Size in Innovation: Theory and Evidence From the Pharmaceutical Industry” (working paper, National Bureau of Economic Research, Washington DC, 2003), https://www.nber.org/papers/w10038.
[67]. Taylor Schwartz et al., “The Impact of Lifting Government Price Controls on Global Pharmaceutical Innovation and Population Health” (industry study, Precision Health Economics, Boston, 2018), https://tools.ispor.org/research_pdfs/58/pdffiles/PHP216.pdf.
[68]. Congressional Budget Office, Research and Development in the Pharmaceutical Industry (Washington, DC: Congressional Budget Office, April 2021), https://www.cbo.gov/publication/57126#_idTextAnchor036.
[69]. Frank Lichtenberg, “New Drugs: Health and Economic Impacts,” National Bureau of Economic Research, March 2003, https://www.nber.org/reporter/winter-2002/3/new-drugs-health-and-economic-impacts.
[70]. “Deloitte’s 13th Annual Pharmaceutical innovation Report: Pharma R&D Return on Investment Falls in Post-Pandemic Market,” press release, February 8, 2023, https://www2.deloitte.com/us/en/pages/about-deloitte/articles/press-releases/deloittes-thirteenth-annual-pharmaceutical-innovation-report-pharma-r-and-d-return-on-investment-falls-in-post-pandemic-market.html.
[71]. US Health and Human Services, International Prescription Drug Price Comparisons (Appendix C: Table C.1. Calculated US Versus Other-Country Price Indices and Table 3.1 Prescription Drug Market by Sales and Volume, 2018); The World Bank, GDP per capita, PPP; PhRMA, “2022 PhRMA Annual Membership Survey.”
[72]. US Health and Human Services, International Prescription Drug Price Comparisons (Appendix C: Table C.1. Calculated US Versus Other-Country Price Indices and Table 3.1 Prescription Drug Market by Sales and Volume, 2018); The World Bank, GDP per capita, PPP; PhRMA, “2022 PhRMA Annual Membership Survey”; “Deloitte’s 13th Annual Pharmaceutical innovation Report: Pharma R&D Return on Investment Falls in Post-Pandemic Market.”
[73]. Ibid.
[74]. US Health and Human Services, International Prescription Drug Price Comparisons (Appendix C: Table C.1. Calculated US Versus Other-Country Price Indices and Table 3.1 Prescription Drug Market by Sales and Volume, 2018); The World Bank, GDP per capita, PPP; PhRMA, “2022 PhRMA Annual Membership Survey”; “Deloitte’s 13th Annual Pharmaceutical innovation Report: Pharma R&D Return on Investment Falls in Post-Pandemic Market”; Center for Drug Evaluation and Research, Advancing Health Through Innovation: 2018 New Drug Therapy Approval (U.S. Food and Drug Administration, 2018), https://www.fda.gov/files/drugs/published/New-Drug-Therapy-Approvals-2018_3.pdf.
[75]. US Health and Human Services, International Prescription Drug Price Comparisons (Appendix C: Table C.1. Calculated US Versus Other-Country Price Indices and Table 3.1 Prescription Drug Market by Sales and Volume, 2018); The World Bank, GDP per capita, PPP; PhRMA, “2022 PhRMA Annual Membership Survey”; “Deloitte’s 13th Annual Pharmaceutical innovation Report: Pharma R&D Return on Investment Falls in Post-Pandemic Market”; Center for Drug Evaluation and Research, Advancing Health Through Innovation: 2019 New Drug Therapy Approval (U.S. Food and Drug Administration, 2020), https://www.fda.gov/media/134493/download.
[76]. US Health and Human Services, International Prescription Drug Price Comparisons (Appendix C: Table C.1. Calculated US Versus Other-Country Price Indices and Table 3.1 Prescription Drug Market by Sales and Volume, 2018); The World Bank, GDP per capita, PPP (current international $) (GDP per capita, PPP; PhRMA, “2022 PhRMA Annual Membership Survey”; “Deloitte’s 13th Annual Pharmaceutical innovation Report: Pharma R&D Return on Investment Falls in Post-Pandemic Market”; Center for Drug Evaluation and Research, Advancing Health Through Innovation: 2018 New Drug Therapy Approval.
[77]. US Health and Human Services, International Prescription Drug Price Comparisons (Appendix C: Table C.1. Calculated US Versus Other-Country Price Indices and Table 3.1 Prescription Drug Market by Sales and Volume, 2018), https://aspe.hhs.gov/sites/default/files/documents/ca08ebf0d93dbc0faf270f35bbecf28b/international-prescription-drug-price-comparisons.pdf.; The World Bank, GDP per capita, PPP (current international $) (GDP per capita, PPP for 33 countries, accessed May 23, 2023), https://data.worldbank.org/indicator/NY.GDP.PCAP.PP.CD.
[78]. US Health and Human Services, International Prescription Drug Price Comparisons (Appendix C: Table C.1. Calculated US Versus Other-Country Price Indices and Table 3.1 Prescription Drug Market by Sales and Volume, 2018), https://aspe.hhs.gov/sites/default/files/documents/ca08ebf0d93dbc0faf270f35bbecf28b/international-prescription-drug-price-comparisons.pdf.; The World Bank, GDP per capita, PPP (current international $) (GDP per capita, PPP for 33 countries, accessed May 23, 2023), https://data.worldbank.org/indicator/NY.GDP.PCAP.PP.CD.
[79]. US Health and Human Services, International Prescription Drug Price Comparisons (Appendix C: Table C.1. Calculated US Versus Other-Country Price Indices and Table 3.1 Prescription Drug Market by Sales and Volume, 2018), https://aspe.hhs.gov/sites/default/files/documents/ca08ebf0d93dbc0faf270f35bbecf28b/international-prescription-drug-price-comparisons.pdf.; The World Bank, GDP per capita, PPP (current international $) (GDP per capita, PPP for 33 countries, accessed May 23, 2023), https://data.worldbank.org/indicator/NY.GDP.PCAP.PP.CD.
[80]. US Health and Human Services, International Prescription Drug Price Comparisons (Appendix C: Table C.1. Calculated US Versus Other-Country Price Indices and Table 3.1 Prescription Drug Market by Sales and Volume, 2018), https://aspe.hhs.gov/sites/default/files/documents/ca08ebf0d93dbc0faf270f35bbecf28b/international-prescription-drug-price-comparisons.pdf.; The World Bank, GDP per capita, PPP (current international $) (GDP per capita, PPP for 33 countries, accessed May 23, 2023), https://data.worldbank.org/indicator/NY.GDP.PCAP.PP.CD.
[81]. US Health and Human Services, International Prescription Drug Price Comparisons (Appendix C: Table C.1. Calculated US Versus Other-Country Price Indices and Table 3.1 Prescription Drug Market by Sales and Volume, 2018), https://aspe.hhs.gov/sites/default/files/documents/ca08ebf0d93dbc0faf270f35bbecf28b/international-prescription-drug-price-comparisons.pdf.; The World Bank, GDP per capita, PPP (current international $) (GDP per capita, PPP for 33 countries, accessed May 23, 2023), https://data.worldbank.org/indicator/NY.GDP.PCAP.PP.CD.
[82]. Jason Buxbaum et al., “Contributions Of Public Health, Pharmaceuticals And Other Medical Care to US Life Expectancy Changes, 1990-2015” Health Affairs Vol. 39, No. 9 (2020): 1546-1556, https://www.healthaffairs.org/doi/10.1377/hlthaff.2020.00284.
[83]. Frank Lichtenberg, “Sources of U.S. Longevity Increase, 1960-1997” (working paper, National Bureau of Economic Research, 2002), https://www.nber.org/system/files/working_papers/w8755/w8755.pdf.
[84]. Lichtenberg, “Sources of U.S. Longevity Increase, 1960-1997.”
[85]. Frech, III et al., “Pharmaceutical Pricing and R&D as a Global Public Good.”
[86]. Frank Lichtenberg, “How many life-years have new drugs saved? A three-way fixed-effects analysis of 66 diseases in 27 countries, 2000–2013,” International Health 11, no. 5 (2019), https://academic.oup.com/inthealth/article/11/5/403/5420236.
[87]. Ibid.
[88]. Lichtenberg, “Sources of U.S. Longevity Increase, 1960-1997.”
[89]. Ibid.
[90]. Frank Lichtenberg, “Are The Benefits Of Newer Drugs Worth Their Cost? Evidence From The 1996 MEPS,” Health Affairs 20, no. 5 (2001), https://www.healthaffairs.org/doi/10.1377/hlthaff.20.5.241?url_ver=Z39.88-2003&rfr_id=ori:rid:crossref.org&rfr_dat=cr_pub%20%200pubmed.
[91]. Ibid.
[92]. Frank R. Lichtenberg, “The Impact of Pharmaceutical Innovation on Disability Days and the Use of Medical Services in the United States, 1997–2010,” Journal of Human Capital Vol. 8, No. 4 (Winter 2014): 432–480, https://www.jstor.org/stable/10.1086/679110.
[93]. Rexford Santerre, “National and International Tests of the New Drug Cost Offset Theory,” Southern Economic Journal 77, no. 4 (2011), https://www.jstor.org/stable/23057324.
[94]. US Health and Human Services, International Prescription Drug Price Comparisons (Appendix C: Table C.1. Calculated US Versus Other-Country Price Indices and Table 3.1 Prescription Drug Market by Sales and Volume, 2018); The World Bank, GDP per capita, PPP; PhRMA, “2022 PhRMA Annual Membership Survey”; “Deloitte’s 13th Annual Pharmaceutical innovation Report: Pharma R&D Return on Investment Falls in Post-Pandemic Market”; Santerre, “National and International Tests of the New Drug Cost Offset Theory.”
[95]. Ibid.
[96]. Ibid.
[97]. Adam Nager and Robert Atkinson, “A Trillion-Dollar Opportunity: how Brain Research Can Drive Health and Prosperity” (ITIF, July 2016), https://www2.itif.org/2016-trillion-dollar-opportunity.pdf.
[98]. Neil Turner, “What’s gone wrong with the European pharmaceutical industry,” Thepharmaletter, April 29, 1999, https://www.thepharmaletter.com/article/what-s-gone-wrong-with-the-european-pharmaceutical-industry-by-neil-turner; David Michels and Aimison Jonnard, “Review of Global Competitiveness in the Pharmaceutical Industry” (U.S. International Trade Commission, 1999), 2–3, https://www.usitc.gov/publications/332/pub3172.pdf.
[99]. European Federation of Pharmaceutical Industries and Associations, “The Research Based Pharmaceutical Industry: A Key Actor for a Healthy Europe” (EFPIA, 2006).
[100]. Nathalie Moll, “Would the last pharmaceutical investor in Europe please turn the lights out,” European Federation of Pharmaceutical Industries and Associations blog, January 3, 2020, https://www.efpia.eu/news-events/the-efpia-view/blog-articles/would-the-last-pharmaceutical-investor-in-europe-please-turn-the-lights-out/.
[101]. EFPIA, “The Pharmaceutical Industry in Figures: 2000” (EFPIA, 2000).
[102]. Ibid.
[103]. US Health and Human Services, International Prescription Drug Price Comparisons (Appendix C: Table C.1. Caluculated US Versus Other-Country Price Indices, 2018); The World Bank, GDP per capita, PPP.
[104]. Ibid.
[105]. Single Care Team, “How much is metformin without insurance?” The Checkup by SingleCare, April 12, 2022, https://www.singlecare.com/blog/metformin-without-insurance/.
[106]. Stephan Eger and Jorg Mahlich, “Pharmaceutical regulation in Europe and its impact on corporate R&D,” Health Economics Review 4, no. 23 (2014), https://healtheconomicsreview.biomedcentral.com/articles/10.1186/s13561-014-0023-5.
[107]. Ibid.
[108]. US Health and Human Services, International Prescription Drug Price Comparisons (Appendix C: Table C.1. Caluculated US Versus Other-Country Price Indices, 2018); The World Bank, GDP per capita, PPP (current international $) (GDP per capita, PPP.
[109]. Ibid.
[110]. Ibid.
[111]. Ibid.
[112]. US Health and Human Services, International Prescription Drug Price Comparisons (Appendix C: Table C.1. Caluculated US Versus Other-Country Price Indices, 2018), https://aspe.hhs.gov/sites/default/files/documents/ca08ebf0d93dbc0faf270f35bbecf28b/international-prescription-drug-price-comparisons.pdf.; The World Bank, GDP per capita, PPP (current international $) (GDP per capita, PPP for 33 countries, accessed May 23, 2023), https://data.worldbank.org/indicator/NY.GDP.PCAP.PP.CD
[113]. Ibid.
[114]. Ibid.
[115]. Ibid.
[116]. US Health and Human Services, International Prescription Drug Price Comparisons (Appendix C: Table C.1. Calculated US Versus Other-Country Price Indices and Table 3.1 Prescription Drug Market by Sales and Volume, 2018); The World Bank, GDP per capita, PPP; PhRMA, “2022 PhRMA Annual Membership Survey”; “Deloitte’s 13th Annual Pharmaceutical innovation Report: Pharma R&D Return on Investment Falls in Post-Pandemic Market.”
[117]. Ibid.
[118]. US Health and Human Services, International Prescription Drug Price Comparisons (Appendix C: Table C.1. Calculated US Versus Other-Country Price Indices and Table 3.1 Prescription Drug Market by Sales and Volume, 2018); The World Bank, GDP per capita, PPP; PhRMA, “2022 PhRMA Annual Membership Survey”; “Deloitte’s 13th Annual Pharmaceutical innovation Report: Pharma R&D Return on Investment Falls in Post-Pandemic Market”; Center for Drug Evaluation and Research, Advancing Health Through Innovation: 2018 New Drug Therapy Approval.
[119]. Ibid.
[120]. Jim Gilbert and Paul Rosenberg, “Addressing the Innovation Divide: Imbalanced innovation” (Bain & Company, 2004), https://www.bain.com/insights/addressing-the-innovation-divide-imbalanced-innovation/.
[121]. Lichtenberg, “The Impact of Pharmaceutical Innovation on Disability Days and the Use of Medical Services in the United States, 1997–2010.”
[122]. US Health and Human Services, International Prescription Drug Price Comparisons (Appendix C: Table C.1. Calculated US Versus Other-Country Price Indices and Table 3.1 Prescription Drug Market by Sales and Volume, 2018); The World Bank, GDP per capita, PPP; PhRMA, “2022 PhRMA Annual Membership Survey”; “Deloitte’s 13th Annual Pharmaceutical innovation Report: Pharma R&D Return on Investment Falls in Post-Pandemic Market”; Santerre, “National and International Tests of the New Drug Cost Offset Theory.”
[123]. Ibid.
[124]. Ibid.
[125]. Stephen Ezell, “No, American’s Drug Prices Aren’t Climbing Radically Out of Control,” ITIF, June 17, 2022, https://itif.org/publications/2022/06/17/no-americas-drug-prices-arent-climbing-radically-out-of-control/.
[126]. PhRMA, "Global Access to New Medicines Report," April 2023, https://www.phrma.org/-/media/Project/PhRMA/PhRMA-Org/PhRMA-Refresh/Report-PDFs/A-C/2023-04-20-PhRMA-Global-Access-to-New-Medicines-Report-FINAL-1.pdf.
[127]. Ibid.
[128]. Ibid.
[129]. Ibid.
[130]. Keith Maskus, “Parallel Imports,” The World Economy 23, no. 9 (2000), https://onlinelibrary.wiley.com/doi/10.1111/1467-9701.00329.
[131]. Stephen Ezell, “How Japan Squandered Its Biopharmaceutical Competitiveness: A Cautionary Tale” (ITIF, July 2022), https://itif.org/publications/2022/07/25/how-japan-squandered-its-biopharmaceutical-competitiveness-a-cautionary-tale/.
[132]. Victoria Berquist, “Strengthening The Inflation Reduction Act By Predicting Drugmakers’ Avoidance And Gaming,” Health Affairs, March 2, 2023, https://www.healthaffairs.org/content/forefront/lawmakers-can-strengthen-inflation-reduction-act-predicting-pharmaceutical-companies.
[133]. Daniel Gassull, Harry Bowen, and Duane Schulthess, “The Impact of IRA Policy Expansion Proposals on the US Biopharma Ecosystem” (Vital Transformations, June 2023), https://vitaltransformation.com/2023/06/the-impact-of-ira-policy-expansion-proposals-on-the-us-biopharma-ecosystem/.
[134]. Stephen Ezell and Kelli Zhou, “The Economics of Biopharmaceutical Innovation: Symposium Report” (ITIF, March 2023), https://itif.org/publications/2023/03/20/economics-of-biopharmaceutical-innovation-symposium-report/.
[135]. Andrew Brownlee and Joran Watson, “The Pharmaceutical Supply Chain, 2013-2020” (Berkeley Research Group, 2022), 3, https://www.thinkbrg.com/insights/publications/pharmaceutical-supply-chain-2013-2020/.
[136]. Ibid.
[137]. Ibid.
[138]. Ezell and Zhou, “The Economics of Biopharmaceutical Innovation: Symposium Report.”
[139]. Neeraj Sood, Karen Mulligan, and Kimberly Zhong, “Do companies in the pharmaceutical supply chain earn excess returns?” International Journal of Health Economics and Management Vol. 21, No. 1 (2021), 111, https://doi.org/10.1007/s10754-020-09291-1.; Stephen Ezell, Senate Reconciliation Legislation Fails to Reconcile the Interests of Biomedical Innovation and Drug Price Affordability,” ITIF, August 5, 2022, https://itif.org/publications/2022/08/05/senate-reconciliation-legislation-fails-to-reconcile-the-interests-of-biomedical-innovation-and-drug-price-affordability/.
[140]. Blake Pelzer and Paul Spitalnic, “Proposed Safe Harbor Regulation,” Center for Medicare and Medicaid Services: Office of the Actuary (August 2018), https://aspe.hhs.gov/sites/default/files/private/pdf/260591/OACTProposedSafeHarborRegulationImpacts.pdf.
