


The North American Subnational Innovation Competitiveness Index
The North American innovation ecosystem is increasingly diverse. In collaboration with Macdonald-Laurier Institute, Fundación IDEA, and the Bay Area Economic Council Institute, ITIF compiled this index to identify economic differences among states and provinces and highlight regions needing more federal attention, identify cross-national innovation performance, and track the continent’s overall competitiveness in the innovation-driven global economy.
KEY TAKEAWAYS
Key Takeaways
North America Has a Diversity of Innovation Ecosystems 3
Cross-National Innovation Clusters 28
Appendix A: Composite Index Methodology 36
Appendix B: Indicator Methodologies and Weights 37
Overview
With a population of 500 million, North America—Canada, Mexico, and the United States—represents one of the world’s most economically vibrant regions, accounting for 28 percent of global economic output.[1] The region also forms one of the world’s largest free trade zones, with deeply integrated supply chains. Beyond that, the three nations form a high-wage/low-wage partnership, bringing complementary labor forces, infrastructure, innovation capacities, and industry strengths together to create a highly competitive economic region. This relationship is poised to make North American manufacturing value chains globally cost competitive with Asian ones and thus make North America a leading global innovation and manufacturing powerhouse.
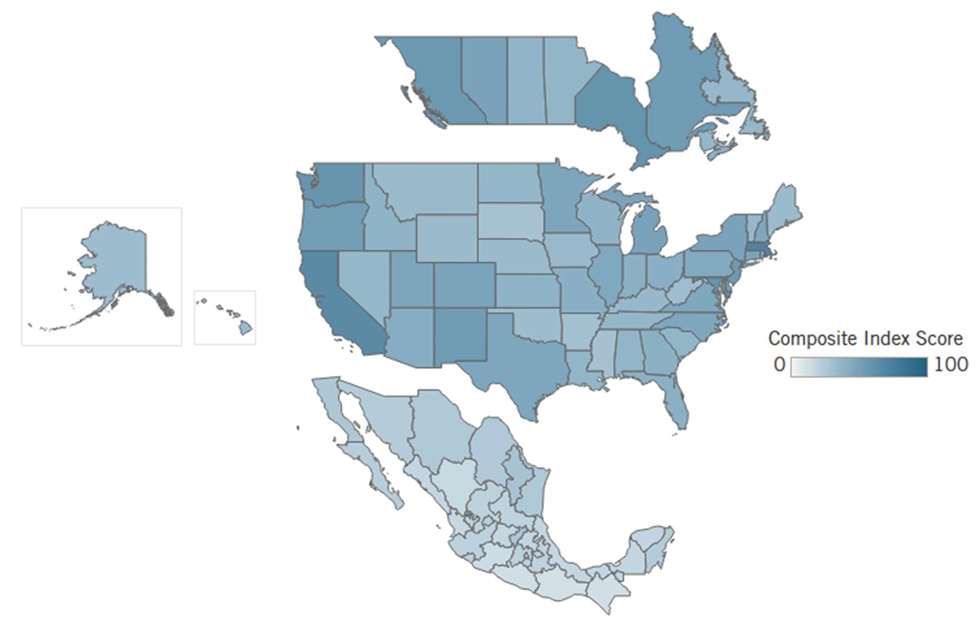
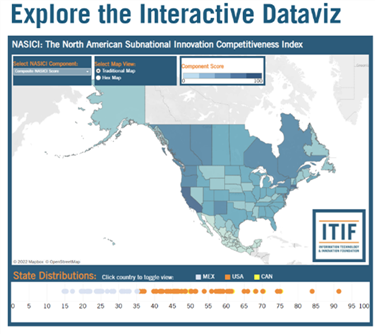 Those capabilities differ not only among the three nations but also among their 92 states and provinces. This report assesses how prepared North American states are to compete in today’s increasingly innovation-driven economy. The North American Subnational Innovation Competitiveness Index (NASICI) uses 13 measures across 3 categories to quantify the extent to which each state’s economy is knowledge based, globalized, and innovation ready and form composite scores (between 0 to 100) that identify each state’s level of performance in the innovation economy.
Following a brief introduction, this report discusses the 13 indicators and presents the scores. It then explores significant regional cross-border economic linkages between U.S. and Mexican states and U.S. states and Canadian provinces. The report concludes with a set of recommendations designed to further deepen innovation, production, and supply chain linkages among North America’s 92 states/provinces.
North America Has a Diversity of Innovation Ecosystems
National innovation measures, such as a country’s per-GDP (gross domestic product) expenditure on research and development (R&D) or its number of patents, show the United States first, Canada second, and Mexico third. However, each nation is governed by federal systems that divide power between the subnational state/province and the national government, enabling states to experiment with a broader range of policy options to pursue different innovation strategies.
Policy discourse on North America’s innovation economy usually overlooks these regional differences, focusing instead on the nations as a whole or on media-favorite tech-hubs such as Silicon Valley, Route 128, or Waterloo Canada. This commentary misses North America’s increasingly diverse innovation ecosystem and misreports innovation only as occurring in a few states and industries. In reality, innovations in technology produce advancements in the productivity of all sectors of an economy, allowing for states with even agriculturally intensive economies to remain competitive in the 21st century.
The Information Technology and Innovation Foundation (ITIF) identifies the “innovation economy,” as other economists have, as increasingly directed by a commitment to technological innovation. A state’s competitiveness in the innovation economy comes from its involvement in the global economy, its capacity for innovation, and its advancement of knowledge-based workforces. To measure the extent to which states/provinces in Canada, Mexico, and the United States are knowledge-based, globalized, and innovation-oriented, ITIF compiled data across 13 indicators to provide a composite index score for each state’s level of competitiveness in the innovation-driven economy. This index, and its basis for identifying the “innovation economy,” is heavily informed by ITIF’s recurring “State New Economy Index” (SNEI) and selects both indicators and weights for a composite index based on work from the SNEI series of reports.[2] Ideally, any contintental subnational index would include a considerable number of indicators, but because of data limitations in some nations, especially Mexico, and difficulties in obtaining comparable data for similar indicators, this index uses 13 indicators to examine 92 North American states: the 10 provinces of Canada, 32 federal entities of Mexico, and 50 states of the United States.
Both U.S. and Canadian territories are excluded from this index due to a lack of corresponding data from statistical agencies. In addition, this report simplifies language by using “states” as a term referring to all federal entities in each country, unless when explicitly referring to a Canadian province.
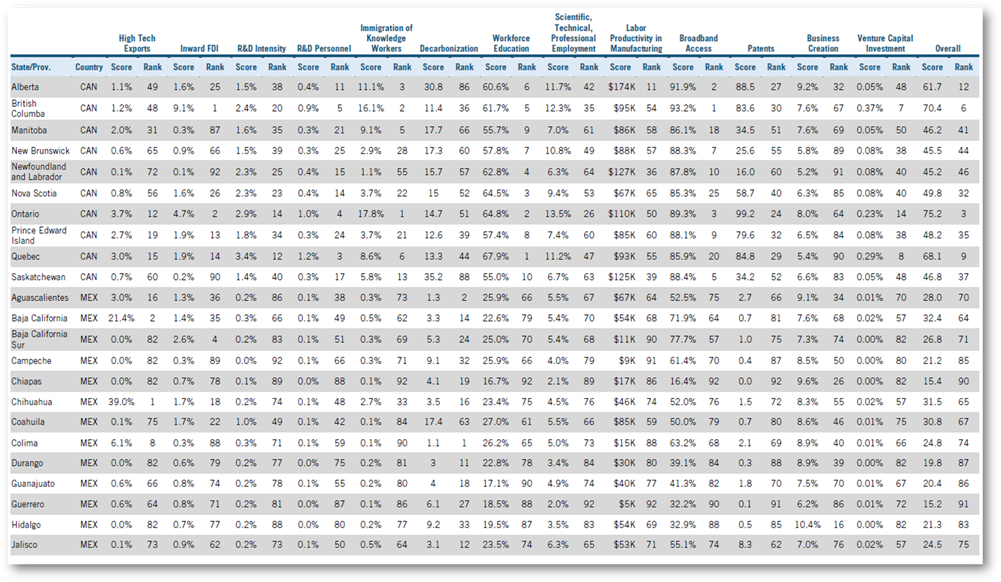
With all measures adjusted for the size of each state economy, NASICI uses 13 indicators divided into 3 categories:
▪ Knowledge-Based Workforce: Indicators measure employment in scientific, technical, and professional activities; the educational attainment of the workforce; immigration of knowledge workers; and manufacturing sector productivity.
▪ Globalization: Indicators measure inward foreign direct investment (FDI) and high-tech goods and services exports.
▪ Innovation Capacity: Indicators measure a state’s share of households subscribing to broadband Internet, venture capital investment, the number of R&D personnel, expenditures on R&D, patents, the extent of movement toward decarbonization, and the creation of new businesses.
Overall Scores
|
Rank |
Country |
Composite Score |
|
|
1 |
Massachusetts |
United States |
91.5 |
|
2 |
California |
United States |
83.9 |
|
3 |
Ontario |
Canada |
75.2 |
|
4 |
Maryland |
United States |
75.0 |
|
5 |
Washington |
United States |
74.2 |
|
6 |
British Columba |
Canada |
70.4 |
|
7 |
New Jersey |
United States |
70.2 |
|
8 |
New Mexico |
United States |
68.3 |
|
9 |
Quebec |
Canada |
68.1 |
|
10 |
Oregon |
United States |
66.0 |
|
11 |
Delaware |
United States |
65.0 |
|
12 |
Alberta |
Canada |
61.7 |
|
13 |
Connecticut |
United States |
61.4 |
|
14 |
New York |
United States |
60.9 |
|
15 |
Michigan |
United States |
60.8 |
|
16 |
Colorado |
United States |
60.3 |
|
17 |
Utah |
United States |
59.2 |
|
18 |
Minnesota |
United States |
59.1 |
|
19 |
New Hampshire |
United States |
58.6 |
|
20 |
Texas |
United States |
58.3 |
|
21 |
North Carolina |
United States |
58.1 |
|
22 |
Virginia |
United States |
57.8 |
|
23 |
Illinois |
United States |
57.2 |
|
24 |
Pennsylvania |
United States |
55.9 |
|
25 |
Arizona |
United States |
53.8 |
|
26 |
Ohio |
United States |
51.5 |
|
27 |
Missouri |
United States |
51.3 |
|
28 |
Georgia |
United States |
50.3 |
|
29 |
Indiana |
United States |
50.2 |
|
30 |
Rhode Island |
United States |
50.2 |
|
31 |
Florida |
United States |
50.2 |
|
32 |
Nova Scotia |
Canada |
49.8 |
|
33 |
Kansas |
United States |
48.7 |
|
34 |
Idaho |
United States |
48.6 |
|
35 |
Prince Edward Island |
Canada |
48.2 |
|
36 |
Wisconsin |
United States |
47.5 |
|
37 |
Saskatchewan |
Canada |
46.8 |
|
38 |
South Carolina |
United States |
46.6 |
|
39 |
Alabama |
United States |
46.3 |
|
40 |
Louisiana |
United States |
46.2 |
|
41 |
Manitoba |
Canada |
46.2 |
|
42 |
North Dakota |
United States |
45.8 |
|
43 |
Tennessee |
United States |
45.6 |
|
44 |
New Brunswick |
Canada |
45.5 |
|
45 |
Nevada |
United States |
45.3 |
|
46 |
Newfoundland and Labrador |
Canada |
45.2 |
|
47 |
Vermont |
United States |
44.5 |
|
48 |
Kentucky |
United States |
43.8 |
|
49 |
Iowa |
United States |
43.3 |
|
50 |
Montana |
United States |
42.3 |
|
51 |
Wyoming |
United States |
42.0 |
|
52 |
Maine |
United States |
41.8 |
|
53 |
Hawaii |
United States |
41.7 |
|
54 |
Nebraska |
United States |
41.5 |
|
55 |
Alaska |
United States |
40.5 |
|
56 |
Oklahoma |
United States |
40.4 |
|
57 |
West Virginia |
United States |
39.8 |
|
58 |
Arkansas |
United States |
37.1 |
|
59 |
Mississippi |
United States |
36.6 |
|
60 |
South Dakota |
United States |
35.9 |
|
61 |
Nuevo León |
Mexico |
35.3 |
|
62 |
Mexico City |
Mexico |
35.1 |
|
63 |
Querétaro |
Mexico |
32.9 |
|
64 |
Baja California |
Mexico |
32.4 |
|
65 |
Chihuahua |
Mexico |
31.5 |
|
66 |
Tamaulipas |
Mexico |
31.1 |
|
67 |
Coahuila |
Mexico |
30.8 |
|
68 |
Sonora |
Mexico |
28.7 |
|
69 |
Quintana Roo |
Mexico |
28.7 |
|
70 |
Aguascalientes |
Mexico |
28.0 |
|
71 |
Baja California Sur |
Mexico |
26.8 |
|
72 |
Mexico |
Mexico |
25.4 |
|
73 |
Morelos |
Mexico |
24.9 |
|
74 |
Colima |
Mexico |
24.8 |
|
75 |
Jalisco |
Mexico |
24.5 |
|
76 |
Tlaxcala |
Mexico |
24.2 |
|
77 |
Zacatecas |
Mexico |
24.2 |
|
78 |
San Luis Potosí |
Mexico |
23.9 |
|
79 |
Puebla |
Mexico |
23.8 |
|
80 |
Yucatán |
Mexico |
22.1 |
|
81 |
Veracruz |
Mexico |
21.6 |
|
82 |
Tabasco |
Mexico |
21.6 |
|
83 |
Hidalgo |
Mexico |
21.3 |
|
84 |
Sinaloa |
Mexico |
21.3 |
|
85 |
Campeche |
Mexico |
21.2 |
|
86 |
Guanajuato |
Mexico |
20.4 |
|
87 |
Durango |
Mexico |
19.8 |
|
88 |
Nayarit |
Mexico |
19.6 |
|
89 |
Michoacán de Ocampo |
Mexico |
17.1 |
|
90 |
Chiapas |
Mexico |
15.4 |
|
91 |
Guerrero |
Mexico |
15.2 |
|
92 |
Oaxaca |
Mexico |
14.8 |
|
|
North American State Average |
43.4 |
|
|
|
Canadian Province Average |
55.7 |
|
|
|
Mexican State Average |
24.6 |
|
|
|
U.S. State Average |
53.0 |
|
Indicator Scores
Summary of Findings
At one level, it is not surprising that the divergence between the top state, Massachusetts, and the bottom, Oaxaca, is considerable. Massachusetts is likely the most innovative subnational region in the world, while Oaxaca still contends with development challenges, from education to infrastructure. Interestingly, low-performing U.S. states South Dakota, Mississippi, and Arkansas actually score closer to the median Mexican state (24.2) than to the median U.S. score (50.2). Further, 14 U.S. states perform below the lowest-ranking Canadian province.
America’s innovation leaders—Massachusetts, California, and Maryland—top the overall ranking at first, second, and fourth, respectively. Massachusetts ranks first due to the state’s massive network of software, hardware, and biotech firms in the Greater Boston area. Boston also holds one of the country’s most densely populated clusters of top-performing research universities, many of which focus on science, technology, engineering, and mathematics (STEM) education. California places second due to its bustling tech economy of Silicon Valley and other southern Californian innovation hubs with access to leading research universities such as Stanford, Caltech, and the University of California, San Diego. Maryland earns its spot due to the state’s abundance of D.C.-commuting knowledge workers employed in scientific, technical, and professional activities, alongside its R&D and innovation activities attributable to a plethora of federal contracts. Washington state ranks fifth because of its high-tech exports, cutting-edge tech businesses bringing in foreign investment, patent generation in areas such as artificial intelligence (AI) and cloud computing, and digitalization of the service sector.
Multiple Canadian provinces place highly as well. Ontario ranks highest among Canadian provinces at third, British Columbia at sixth, and Quebec at ninth. Ontario is the North American runner-up in foreign investment and has attracted national headquarters from tech giants such as Uber, Intel, LG, and Samsung. Ontario also encompasses the Toronto-Waterloo Corridor, Canada’s largest innovation hub harboring more than 15,000 tech companies, over 5,000 start-ups, and a world-leading quantum computing hub.[3] British Columbia ranks high due to its highly educated workforce and attractiveness to migrating knowledge workers. Vancouver remains one of Canada’s most robust tech hubs and is home to almost 100,000 tech workers, helping British Columbia excel in its creation of R&D jobs and its high attraction of FDI.[4]
While Mexico expectedly lags behind U.S. and Canadian states, Nuevo León is the most competitive Mexican state by a very slight margin (ranking 61st out of 92 states), with Mexico City virtually tying. Mexico City, the second-most populous federal entity in Mexico, is home to many professional jobs and burgeoning entrepreneurial activity. As a political and economic door for the United States to the rest of Latin America, many start-ups and larger firms looking to assert their presence in Latin American markets have established second headquarters in Mexico City.[5] These circumstances have allowed Mexico City to attract an exceedingly high volume of foreign-born knowledge workers alongside a rise in foreign investment, each in greater amounts than for many U.S. states. Nuevo León and Mexico City score 10 points higher than the nation’s median state does, and 11 U.S. states score closer to the level of Nuevo León/Mexico City than to the U.S. median. Nuevo León, located just south of Texas, has long been a leading Mexican manufacturing region and has benefited from high levels of FDI due to companies post-North American Free Trade Agreement (NAFTA) seeking out large amounts of affordable, skilled labor. However, the state’s manufacturing value added per worker is very low. Similarly, Jalisco, home to Mexico’s rising tech capital Guadalajara, has more workers and higher total value added in manufacturing and information and communications technology (ICT) sectors than most U.S. states do, yet it maintains few tech jobs as a share of total employment and low per-worker value added in these industries.
While overall index scores strongly correlate with GDP per capita (0.73), wealth is not directly determinant of a state’s competitiveness in the innovation economy. Intra-nationally, these scores correlate far less with wealth. Considering just Canadian provinces, the correlation between index scores and GDP per capita falls to just 0.22. In U.S. states alone, that correlation is 0.46, while it’s 0.51 among only Mexican states. For example, while New York remains one of the wealthiest American states in total and per capita measurements of GDP, it ranks outside the top 10 North American states. Although New York City boasts considerable FDI and a high concentration of venture capital firms plus academic and corporate research labs (including the likes of Microsoft), New York state ranks 14th overall due to a longtime process of bleeding knowledge workers, both in professional services and in advanced manufacturing, across the Hudson to New Jersey and to Connecticut, both of which outrank New York at 7th and
13th, respectively.
Leading competitors in North America’s innovation economy are in the continental Northeast. New England states, alongside New York, Quebec, and Ontario, are characterized by highly educated workforces, a plethora of high-tech exports, extensive broadband access, and a wealth of R&D workers. The Pacific Northwest also prevails as another key regional leader in the innovation economy. The West Coast states of British Columbia, California, Oregon, and Washington excel in economic indicators similar to the American Northeast while attracting leading volumes of FDI. Progress made in both regions is assisted by cross-national innovation clusters and economic interdependence forged between the United States and Canada.
Similarly, at the southern border, more cross-national innovation activity is taking place between U.S. states Arizona, California, Nevada, and Texas with Mexican states Baja California, Jalisco, Mexico City, Nuevo León Queretaro, and Tamaulipas. This emerging innovation cluster between the U.S. Southwest and Mexican North was previously shaped heavily by NAFTA, thereby significantly boosting FDI in Mexico, rapidly creating new businesses, and building a bedrock of North American manufacturing in Mexico.[6] The highest-performing Mexican states in the innovation economy have even found their business cycles synchronizing with the economies of states in the American Southwest.[7]
Mexican states remain concentrated at the low-scoring end of the subnational index (rankings 61–92 are all Mexican states). And while the top-performing Mexican states score on par with the United States’ lowest-performing states, Mexico’s most struggling states—Michoacán de Ocampo (89th), Chiapas (90th), Guerrero (91st), and Oaxaca (92nd)—perform at about one-third the level of Mexico’s innovation leaders.
The following sections assess North American states’ performance across the three main categories of the NASICI: knowledge economy, globalization, and innovation capacity.
Knowledge Economy
Knowledge and skills increasingly drive innovation and competitiveness. States that support a knowledge-based economy create a greater stock of human capital that can be deployed into research and production. Knowledge-based economies are also better positioned to lead in expanding the stock of available knowledge for the rest of the world, thereby improving their competitiveness in today’s innovation-driven economy.
This section uses four indicators: 1) immigration of knowledge workers; 2) workforce education; 3) the share of workers employed in professional, managerial, scientific, or technical activities; and 4) manufacturing gross value added (GVA) per worker.
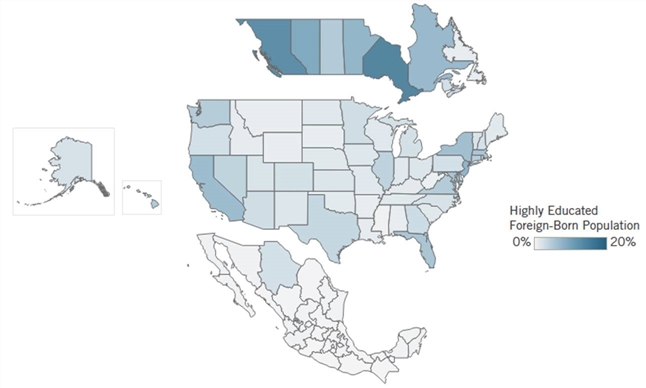
Immigration of Knowledge Workers
Highly Educated Foreign-Born Population as a Share of Total State Population
Why Is It Important?
Knowledge workers from outside the country bring unique research backgrounds and experiential knowledge that helps drive discoveries. This indicator measures a state’s number of highly educated foreign-born residents as a share of total state population. A 2016 ITIF study finds that more than one-third of U.S. scientists and engineers producing meaningful innovations were born outside the country, despite immigrants comprising just 13.5 percent of the national resident population.[8] Likewise, nearly half of Silicon Valley’s AI start-ups have at least one foreign-born founder.[9] States with larger shares of highly educated immigrant populations benefit from a greater stock of human capital to lead in the knowledge economy. At the same time, their presence raises wages for both domestic and foreign-born workers.[10]
The Rankings
Canadian provinces heavily outperform the rest of North America on this knowledge economy indicator. The Organization for Economic Cooperation and Development (OECD) has previously ranked Canada as the most highly educated population of any country in the world. [11] Further, Canada’s points-based immigration system is oriented toward attracting high-skilled workers, placing a great emphasis on potential immigrants’ education levels, language ability, and experience.[12] Canada also permits entry to more new immigrants per year than do the United States or Mexico as a proportion of national population.[13] U.S. states have a far greater educational mix in their immigrant populations.
|
Top 5 |
State/Province |
Highly Educated Foreign-Born Population as a Share of the Population |
|
1 |
Ontario |
17.8% |
|
2 |
British Columba |
16.1% |
|
3 |
Alberta |
11.1% |
|
4 |
New Jersey |
9.4% |
|
5 |
Manitoba |
9.1% |
|
|
Average North American State |
2.7% |
|
|
Average Canada Province |
8.0% |
|
|
Average Mexican State |
0.3% |
|
|
Average U.S. State |
3.2% |
Source: OECD.Stat, Regions & Cities Database, 2019
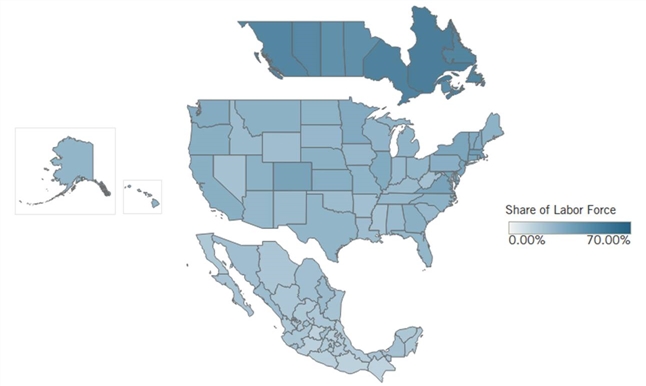
Workforce Education
Share of State Labor Force With a Post-Secondary Education
Why Is It Important?
Many jobs in the 21st century benefit from productivity gains acquired from skills training and higher education. A more-educated workforce means workers are better prepared for knowledge- and technology-intensive labor markets. This indicator measures the share of a state’s total workforce finishing postsecondary education (including universities, trade schools, and colleges). However, a greater number of schooling years may not necessarily equate with a person’s growth in applied knowledge or skills. For example, the Council for Aid to Education found that 44 percent of exiting higher-educated students are not proficient in essential career skills.[14] Even given continuing shortcomings in its higher education system (at least in America), a state workforce’s share of highly educated workers remains a strong positive indicator of human capital, knowledge creation, occupational competence, and digital literacy.
The share of the labor force holding a postsecondary education in U.S. states is nearly half the level found in Canadian provinces: 35 percent compared with 61 percent.
The Rankings
Canadian provinces again notably outperform the rest of North America in indicators on higher education. Canada, internationally ranked as one of the world’s highest-educated nations, accounts for the top-five most highly educated state workforces in North America. Quebec, Ontario, and British Columbia contain the greatest concentration of renowned colleges in Canada. The average highly educated share of the labor force among U.S. states is just over half the share enjoyed on average among Canadian states. U.S. leaders Massachusetts, Maryland, and Connecticut have workforce shares from 43 to 47 percent, juxtaposed by Nevada, Mississippi, and West Virginia (all near 25 percent). Mexico lags behind overall with several highly educated exceptions, including Mexico City, Nuevo León, Sinaloa, and Sonora.
|
Top 5 |
State/Province |
Share of Labor Force With Postsecondary Education |
|
1 |
Quebec |
67.9% |
|
2 |
Ontario |
64.8% |
|
3 |
Nova Scotia |
64.5% |
|
4 |
Newfoundland and Labrador |
62.8% |
|
5 |
British Columba |
61.7% |
|
|
Average North American State |
36.3% |
|
|
Average Canadian Province |
60.8% |
|
|
Average Mexican State |
23.3% |
|
|
Average U.S. State |
35.0% |
Source: OECD.Stat, Regions & Cities Database, 2019
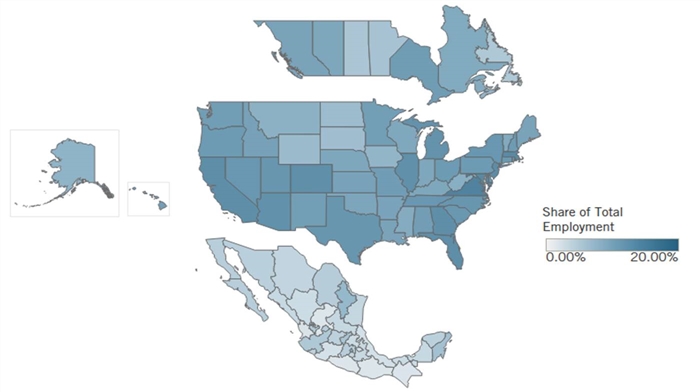
Professional, Scientific, and Technical Employment
Share of Total State Employment in Professional, Scientific, and Technical Activities
Why Is It Important?
This indicator measures a state’s share of total employment enrolled in professional, scientific, and technical activities (North American Industry Classification System [NAICS] 54). Both automation and global value chains make work in professional services increasingly essential in the knowledge-based economy. These occupations are especially knowledge intensive, often requiring training and expertise, and are thus good paying and not easily automated or outsourced. This industry includes scientists and engineers, legal services, accounting, business management and administration, consulting, and computer and technical professional workers.[15] Jobs in these high-skilled services have increased by 20 percent over the last decade in the United States—nearly double the rate of total private-sector employment.
The Rankings
Virginia and Maryland top this indicator, likely due to their proximity to Washington, D.C., and the high number of federal contractors residing across the Washington metropolitan area. Massachusetts ranks highly for its many scientists employed in the Greater Boston area’s world-class research universities and hospitals. New Jersey benefits from having many corporate headquarters, financial services, and high-tech jobs, several formerly in New York City. Canadian provinces lag behind the United States by about 4 percentage points on average, whereas Mexican states trail the United States by an average of nearly 10 percentage points. States with fewer large businesses tend to underperform on this indicator, as these services are often condensed into in-house tasks of small businesses, as exhibited by the lowest performance coming from small Mexican states such as Zacatecas and Guerrero.
|
Top 5 |
State/Province |
Share of Employment in Professional, Scientific, and Technical Activities |
|
1 |
Virginia |
18.4% |
|
2 |
Maryland |
17.0% |
|
3 |
Massachusetts |
16.8% |
|
4 |
New Jersey |
16.5% |
|
5 |
Florida |
16.2% |
|
|
Average North American State |
10.0% |
|
|
Average Canadian Province |
9.6% |
|
|
Average Mexican State |
4.6% |
|
|
Average U.S. State |
13.5% |
Source: OECD.Stat, Regions & Cities Database, 2019
Manufacturing Gross Value Added per Worker
GVA per Worker in Manufacturing
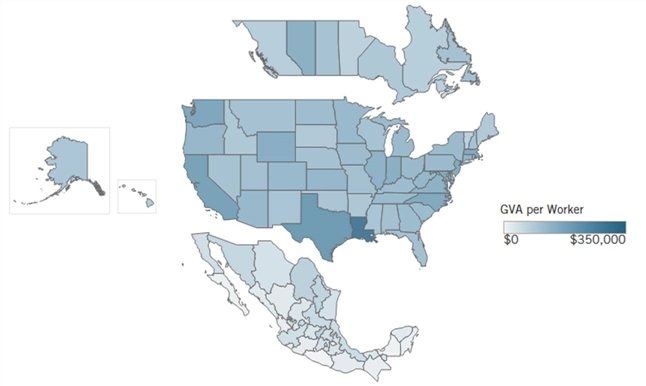
Why Is It Important?
Gross value-added measures the contribution to GDP made by an individual producer, industry, or sector. This indicator measures the average GVA per manufacturing worker. Within manufacturing, high-value-added firms are most often capital intensive, producing more technologically complex products and organizing their work to take better advantage of worker skills. They typically earn higher wages because their workers are more productive, generating greater value for each hour worked. All else being equal, firms with higher-value-added levels can meet competitive challenges both at home and abroad within sectors. Unfortunately, U.S. manufacturing labor productivity is in decline, falling by 1.34 percent between 2012
and 2019.[16]
The Rankings
Value added varies widely among different manufacturing industries. Two of the most valuable manufacturing industries, petrochemicals and computers/electronics, dictate the rankings of this list heavily. In Louisiana and Texas, their petroleum products carry a high value added, and Louisiana’s economy is even more dependent on this sector.[17] States manufacturing other high-value technology goods, such as Washington and Maryland in the aerospace industry, also perform well on this indicator.
|
Top 5 |
State/Province |
GVA per Worker in Manufacturing |
|
1 |
Louisiana |
$346,406 |
|
2 |
Texas |
$238,992 |
|
3 |
California |
$217,058 |
|
4 |
Washington |
$202,281 |
|
5 |
Maryland |
$196,480 |
|
|
Average North American State |
$107,730 |
|
|
Average Canadian Province |
$105,021 |
|
|
Average Mexican State |
$40,381 |
|
|
Average U.S. State |
$150,519 |
Source: OECD.Stat, Regions & Cities Database, 2019
Globalization
Today’s innovation economy increasingly relies on global trade integration and the attraction of international demand. Globalized states—states oriented to engage with international economic activity—grow more competitive in the innovation economy by becoming a more integral part of a larger innovation ecosystem. While the 2020 United States-Mexico-Canada Agreement (USMCA) replaced NAFTA to modernize North America’s global trade architecture, states within North America are also taking individual efforts toward greater global engagement and integration.
The indicators in this section observe two aspects of globalization: 1) the amount of inward
FDI attracted and 2) the share of a state’s total GDP contributed by high-tech goods and
services exported.
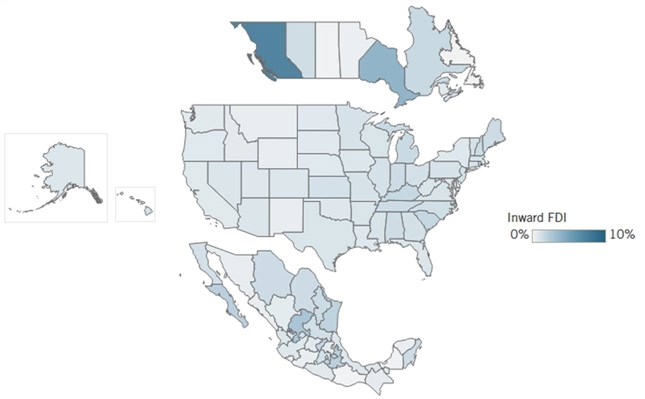
Inward Foreign Direct Investment
Inward FDI as a Share of GDP
Why Is It Important?
Inward FDI represents the flow of funds into a state from foreign-based enterprises to purchase that state’s existing facilities or to develop new ones. This indicator measures states’ amounts of inward FDI relative to their GDP. Domestic economies receiving greater FDI enjoy economic revitalization through foreign businesses expanding domestic output. This foreign-generated economic activity employs increasingly higher amounts of the domestic workforce. FDI creates more high-paying jobs due to the successful innovative habits of majority-owned foreign companies and the upward pressures they exert on wages domestically.[18] FDI as an economic indicator confers a win-win for foreign and domestic parties, as the exchange deepens both parties’ integration in global value chains and is associated with increased international trade, R&D expenditures, and job creation.[19]
The Rankings
Canada receives more inward FDI as a share of its total GDP than the United States does, with most of both total funding and the number of projects directed toward British Columbia and Ontario. The United States, while receiving more total FDI than both Canada and Mexico do, lags behind in inward FDI proportionally to GDP. Canadian inward FDI, while high, may also be inflated by wealthy foreigners buying up real estate in places such as Vancouver for tax-avoidance purposes.[20] However, many Canadian and U.S. states receive less FDI than do some Mexican states. For example, Zacatecas (third), Baja California Sur (fourth), and Tlaxcala (fifth) receive large FDI sums relative to their GDP. These Mexican states attract FDI with large supplies of manufacturing workers at globally competitive wages, whereas leading Canadian and
U.S. states attract investment for their rich energy and mining resources and availability of knowledge workers.[21]
|
Top 5 |
State/Province |
Inward FDI as a Share of GDP |
|
1 |
British Columba |
9.1% |
|
2 |
Ontario |
4.7% |
|
3 |
Zacatecas |
3.4% |
|
4 |
Baja California Sur |
2.6% |
|
5 |
Tlaxcala |
2.5% |
|
|
Average North American State |
1.3% |
|
|
Average Canadian Province |
2.2% |
|
|
Average Mexican State |
1.3% |
|
|
Average U.S. State |
1.2% |
Source: Invest Canada, 2019; Mexico Ministry of Economy, 2019; US Bureau of Economic Analysis, 2019
High-Tech Exports
High-Tech Exports (NAICS 333, 334, & 335) as a Share of GDP
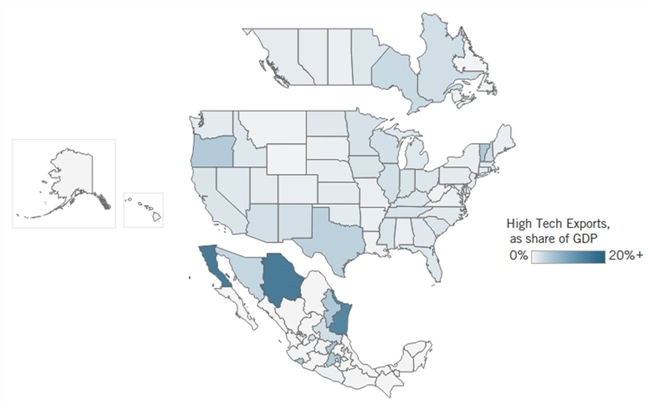
Why Is This important?
As technology comprises ever-larger shares of global trade, the extent of technology exports reflects a state’s readiness for trade of products today and into the future. Such innovative technologies traded internationally are defined here as machinery manufacturing (NAICS 333); computer and electronics products (NAICS 334); and electrical equipment, appliance, and component manufacturing (NAICS 335). This indicator measures a state’s sum of exports within these three 3-digit NAICS codes as a share of GDP. These codes contain technologies such as robotics, ICT goods, and computer components, and are selected because they expend the highest amounts of R&D business expenditure compared with any other manufacturing sector.[22]
Chihuahua, Baja California, and Tamaulipas lead all other North American states in exports of high-tech products relative to GDP.
The Rankings
Chihuahua, Baja California, and Tamaulipas lead all other North American states in exports of high-tech products relative to GDP. These states include the major manufacturing cities of Ciudad Juarez, Tijuana, and Matamoros, which together comprise most of Mexico’s “maquiladora” manufacturing plants. These maquiladoras once accounted for nearly half of all Mexican exports, but as U.S. demand for Mexican exports has changed over time, the content of maquiladoras has shifted more toward technology goods. Maquiladoras in Chihuahua have led this transition, accounting for nearly $90 billion worth of Mexican exports in a single year. Further, automatic data processing machinery and equipment are becoming a greater source of technology exports from Chihuahua.[23] High-tech exports from U.S. and Canadian states are significantly lower, as those countries have relatively smaller industrial economies and larger service economies. Interestingly, Vermont leads the United States in its production of high-tech exports, which stems from a concentrated production in computer component technologies. States with low FDI and R&D commitments lagged behind in their trade of high-tech exports—an indication that they lack firms able to develop high-tech products.
|
Top 5 |
State/Province |
High Tech Exports as a Share of GDP |
|
1 |
Chihuahua |
39.0% |
|
2 |
Baja California |
21.4% |
|
3 |
Tamaulipas |
17.8% |
|
4 |
Querétaro |
6.9% |
|
5 |
Vermont |
6.3% |
|
|
Average North American State |
1.3% |
|
|
Average Canadian Province |
1.6% |
|
|
Average Mexican State |
3.7% |
|
|
Average U.S. State |
1.7% |
Source: Innovation, Science, and Economic Development Canada, 2019; USA Trade Online, 2019; INEGI-EAEF, 2019
Innovation Capacity
A state’s capacity to innovate represents its most sustainable path to long-term economic growth. States more readily able to innovate and produce valuable intellectual property (IP) command a greater competitive position toward shaping future innovations. A strong innovation capacity consists of public and private efforts to drive economic change, whether through state R&D efforts or by the ingenuity of inventors and newly emergent businesses. In today’s innovation economy, a global audience looks toward states with robust innovation capacities to inform their own behavior in domestic policymaking and solve globally shared challenges.
The indicators in this section measure seven aspects of innovation capacity: 1) broadband subscribership; 2) total R&D investment; 3) the share of R&D personnel in the workforce; 4) the number of patents; 5) business creation; 6) responsibility over emissions; and 7) venture capital investment.
Broadband Telecommunications
Share of all Households Subscribing to Broadband Internet
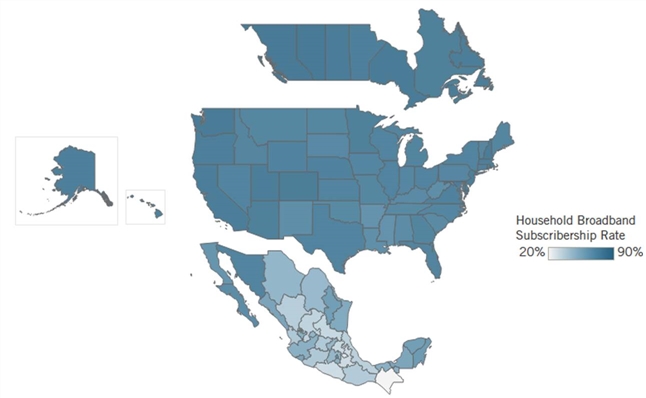
Why Is It Important?
“Broadband” refers to connections that allow the transmission of large data at fast speeds using Internet protocols. This indicator measures the percentage of households in a given state subscribing to a broadband Internet connection. Broadband Internet access allows businesses and households to have faster and more-reliable Internet service and communications. As more households in a state gain access to broadband Internet, the sharing of information, provision of digital services, and e-commerce become more efficient and more widely available. Broadband also expands an economy through improved teleworking, telehealth services, and even remote learning, as a recent study finds that a 10-line increase in a state’s broadband connections per 100 people is associated with cumulative GDP growth of between 0.8 and 1.4 percent.[24]
The Results
Canadian provinces overall outperform U.S. and Mexican states. Canada has one of the highest household penetration rates of any OECD country and has maintained a longstanding set of digitalization policies at the national and provincial levels.[25] The Canadian government projects that, by the end of 2021, 90 percent of households will have access to broadband, which it appears to be well on track to achieve.[26] Mexican states notably trail both U.S. and Canadian ones, likely due to Mexico having a less-developed economy. Expanding Internet access in Mexico only became a national policy priority in 2013, when Mexico first established the federal broadband fund Mexico Conectado.[27]
|
Top 5 |
State/Province |
Percentage of Households Subscribing to Broadband Internet |
|
1 |
British Columbia |
93.2% |
|
2 |
Alberta |
91.9% |
|
3 |
Ontario |
89.3% |
|
4 |
Washington |
89.1% |
|
5 |
Saskatchewan |
88.4% |
|
|
Average North American State |
72.5% |
|
|
Average Canadian Province |
88.4% |
|
|
Average Mexican State |
51.0% |
|
|
Average U.S. State |
82.8% |
Source: OECD.Stat, Regions & Cities Database, 2017
R&D Intensity
Total R&D Investment Relative to GDP
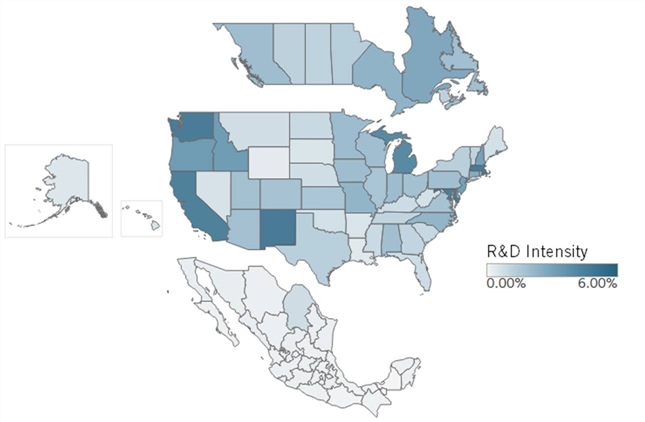
Why Is It Important?
Contributions to R&D come from three main sources: business, government, and academia. Businesses fund R&D to create new products and more-efficient processes, a motivation that has amassed nearly three-fourths of total U.S. R&D.[28] Academic institutions cultivate talent and provide platforms for scientists and engineers to conduct their work. Government can drive innovation in socially valuable areas that may otherwise lack attention. This indicator measures R&D intensity as a state’s total received investment of R&D relative to its GDP. R&D funds invested in a state have a resonating impact on the rest of an economy, as one estimate finds that each dollar allocated by Canadian firms for R&D add another 33 cents to the rest of the economy.[29]
One estimate finds that each dollar allocated by Canadian firms for R&D adds another 33 cents to the rest of the economy.
The Rankings
New Mexico leads North America in R&D intensity due to sizable federal investment in Los Alamos National Laboratories and Sandia Laboratories in Albuquerque. Massachusetts places second in R&D intensity due to a concentration of universities and biotech and software firms in the Greater Boston area performing R&D. Both Washington and California rank highly due to robust R&D intensity among high-tech industries. States containing large federal facilities—especially research organizations—such as Maryland, which includes the National Institutes of Health and the National Institute of Standards and Technology, also rank as more R&D intensive than others.
|
Top 5 |
State/Province |
R&D Intensity as a Share of GDP |
|
1 |
New Mexico |
7.17% |
|
2 |
Massachusetts |
6.36% |
|
3 |
Washington |
5.92% |
|
4 |
Maryland |
5.81% |
|
5 |
California |
5.63% |
|
|
Average North American State |
1.59% |
|
|
Average Canadian Province |
2.11% |
|
|
Average Mexican State |
0.24% |
|
|
Average U.S. State |
2.31% |
Source: Statistics Canada, 2019; INEGI, 2019; National Science Foundation, 2019
R&D Personnel
R&D Personnel as a Share of Total State Employment
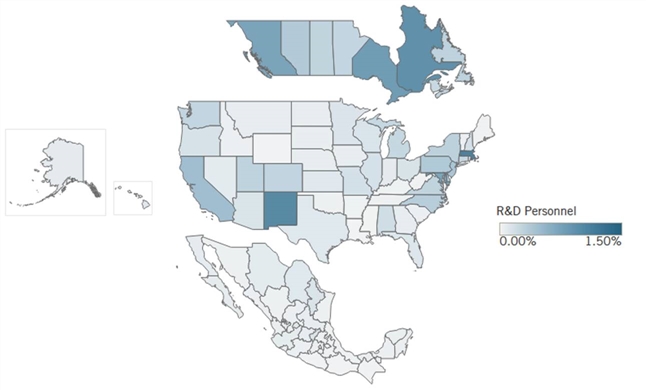
Why Is It Important?
R&D personnel employed by businesses can target valuable research toward productivity-enhancing innovations with spillover effects benefiting the whole economy. More R&D workers also enable a more efficient distribution of highly complex work. One report from the Leibniz Center for European Economic Research estimates that each additional worker employed in R&D contract services raises the likelihood that contracted R&D investments will generate new patents by 2 percentage points.[30] State private sectors themselves also benefit from more privately employed R&D personnel, as states with more private-sector scientists and engineers can better attract other highly skilled workers and fast-growing firms.[31] “R&D personnel” refers to a state’s share of total employment enlisted in R&D services (NAICS code 5417-Scientific Research and Development Services, not distinguishing whether employing firms/institutions receive any government support).
The Rankings
Massachusetts leads North America due to a wide array of research personnel housed in tech-related business R&D universities and medical research at hospitals and labs. The state boasts Mass General Research Institute as the most extensive hospital-based research program in the United States. Canadian provinces, on average, rank highly, namely Quebec, Ontario, and British Columbia, due to national policy factors such as Canada maintaining a more generous R&D tax credit than that provided by the United States or Mexico.[32]
|
Top 5 |
State/Province |
R&D Personnel as a Share of Total Employment |
|
1 |
Massachusetts |
1.40% |
|
2 |
New Mexico |
1.28% |
|
3 |
Quebec |
1.18% |
|
4 |
Ontario |
1.01% |
|
5 |
British Columba |
0.91% |
|
|
Average North American State |
0.22% |
|
|
Average Canadian Province |
0.51% |
|
|
Average Mexican State |
0.10% |
|
|
Average U.S. State |
0.24% |
Source: Statistics Canada, 2019; INEGI, 2019; US Bureau of Labor Statistics, 2019
Patents
PCT Patents Issued per Million Persons
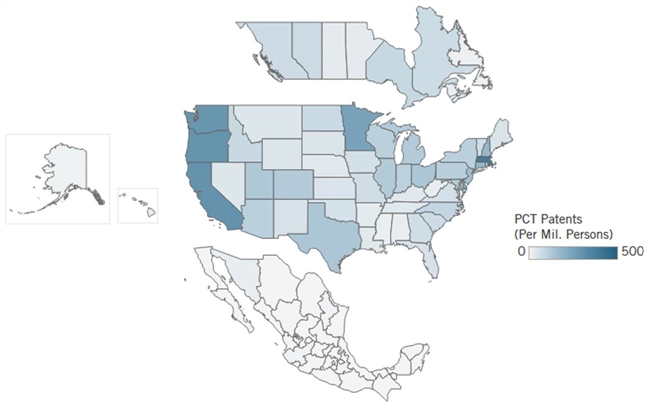
Why Is It Important?
Patenting secures returns on investment toward valuable knowledge creation. Scientific research often is costly and requires multiple attempts from different firms, and in 2016, only about one-third of the top 659 global pharmaceutical companies (one of the world’s most R&D-intensive industries) even made a profit.[33] Patenting helps firms and inventors undertaking risky, complex, and expensive R&D and innovation activities capture a share of the value they create, providing strong incentives for future research investment and innovations. This indicator, measuring the number of Patent Cooperation Treaty (PCT) patents relative to each state’s population, demonstrates states’ abilities to generate valuable inventions and knowledge that are recognized by the global innovation community.
The Rankings
U.S. states on average lead PCT patent applications, with exceptionally high performance observed in states with either many high-tech corporate headquarters or R&D labs, such as Massachusetts’ Route 128 tech corridor or California’s Silicon Valley. Since PCT patents offer globally recognized IP protections, states with higher PCT patents per million persons are expectedly producing innovations that boost global competitiveness in the innovation economy. Oregon, Washington, and Minnesota round out the top-five states on this indicator.
|
Top 5 |
State/Province |
PCT Patents per Million Persons |
|
1 |
Massachusetts |
501 |
|
2 |
California |
381 |
|
3 |
Oregon |
377 |
|
4 |
Washington |
363 |
|
5 |
Minnesota |
308 |
|
|
Average North American State |
75 |
|
|
Average Canadian Province |
60 |
|
|
Average Mexican State |
2 |
|
|
Average U.S. State |
122 |
Source: OECD.Stat, Regions and Cities Database, 2015
Business Creation
Economywide Business Birth Rate
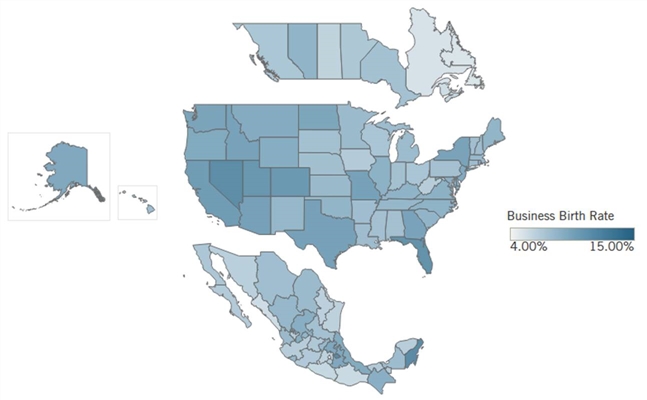
Why Is It Important?
A thriving business ecosystem in today’s innovation-driven economy should experience a high volume of business start-ups willing to enter the market, assume risk, and engage in competition to drive innovation and growth. This indicator measures states’ economy-wide business birth rates. Since more narrow data on business birth rates by industry is not available across states, this indicator is constrained by being too broad. The economy-wide business birth rate includes “mom-and-pop” lifestyle businesses at equal weight with high-tech start-ups, despite the fact that the former won’t experience the potential growth of the latter. Nevertheless, this indicator on business creation lacks a better alternative at the cross-national state level and can be reflective of a state’s economic resilience and regional competitiveness.[34]
The Rankings
Tlaxcala has the highest business birth rate among North American states due to its increased security, which has enabled more businesses to emerge in the state (mostly new mom-and-pop businesses).[35] This developing state in Mexico enjoys high start-up rates due to the prevalence of microenterprises in the country. A 2015 estimate finds that just over 97 percent of businesses in the state were microenterprises, which are far easier to start than traditional small businesses in developed states are.[36] U.S. start-up rates have faltered in recent years, as the annual number of new U.S. start-ups have decreased by nearly 85,000 over the last two decades.[37] Canadian states lag noticeably behind compared with American and Mexican ones on this measure.
|
Top 5 |
State/Province |
Economy-Wide Business Birth Rate |
|
1 |
Tlaxcala |
13.4 |
|
2 |
Quintana Roo |
13.1 |
|
3 |
Nevada |
13.1 |
|
4 |
Florida |
12.5 |
|
5 |
Utah |
11.9 |
|
|
Average North American State |
8.7 |
|
|
Average Canadian Province |
6.8 |
|
|
Average Mexican State |
8.1 |
|
|
Average U.S. State |
9.4 |
Source: OECD.Stat, Regions and Cities Database, 2018.
Decarbonization
Tons of CO2 Emissions per Capita
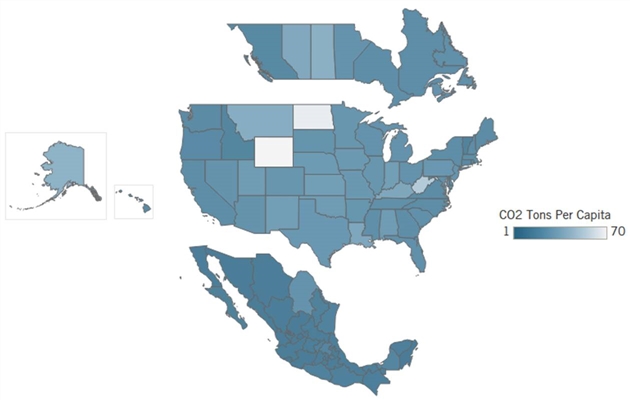
Why Is It Important?
States pursuing long-term competitiveness in today’s economy should ensure their innovation capacity is sustainable. This indicator measures carbon dioxide (CO2) emissions produced per capita. While alarmists may dramatize the carbon footprint of tech companies, the ICT sector accounts for one of the few industries projected by the International Energy Agency to meet its Sustainable Development Scenario based on its 2020 report, Tracking Clean Energy Progress.[38] Further, innovations made by the ICT sector are already reducing carbon emissions at the economy-wide level, as the Global e-Sustainability Initiative estimated that “the IT industry currently abates 1.5 times its own carbon footprint, and that could go up to almost 10 times in 2030.”[39] As the world makes efforts to combat climate change, policymakers will look to leading innovative states to devise new solutions and technologies to reduce carbon emissions.
The Rankings
Mexican states have enacted some (but far from all) of the United Nations (UN) Sustainable Development Goals policy recommendations to lower CO2 emissions by around 477 million tons by 2030. Reaching these goals will help maintain emissions in Mexico as they are today, but with significant GDP and per capita income growth.[40] And given that CO2 emissions among North American states are uncorrelated to both GDP and per capita income, developing Mexican states that have not fully “carbonized”—which already report lower CO2 emissions than those of the developed states that lead decarbonization efforts—are reaching middle-income status without relying on a high-carbon development strategy.[41] Overall, Mexican states score far better than American or Canadian ones do on this indicator.
|
State/Province |
Tons of CO2 Emissions Per Capita |
|
|
1 |
Colima |
1.1 |
|
2 |
Aguascalientes |
1.3 |
|
3 |
Quintana Roo |
1.9 |
|
4 |
Sinaloa |
2.2 |
|
5 |
Michoacán de Ocampo |
2.3 |
|
|
Average North American State |
15.1 |
|
|
Average Canadian Province |
18.4 |
|
|
Average Mexican State |
4.5 |
|
|
Average U.S. State |
20.8 |
Source: OECD.Stat, Regions and Cities Database, 2010.
Venture Capital Investment
Venture Capital Investment Relative to GDP
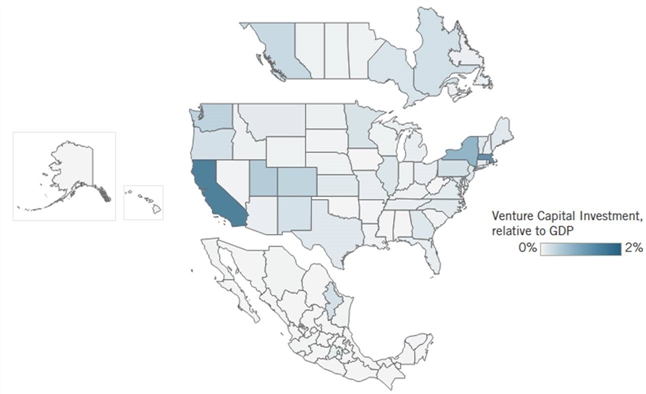
Why Is It Important?
Venture capital (VC) is a form of business financing wherein investors provide funds to early-stage companies in exchange for equity in their firms. Given the high uncertainty of start-ups making them more prone to business failure, VC investment assumes higher risks than other forms of investment do. However, VC investment is often intended for companies seen as having high-growth potential due to their usually being based on an innovative technology or business model. This indicator shows a state’s total VC investment (based on VC-receiving firms located therein) relative to the size of its GDP. VC has become increasingly concentrated in a handful of the most innovative industries, with AI technology-based start-ups attracting over 21 percent of the world’s VC in 2020.[42] A state’s receipt of VC investment reflects both the innovativeness of its start-up ecosystem as well as the commitment of its firms to lead in crucial technologies for the future in areas such as AI, biotechnology, clean energy, advanced manufacturing,
and robotics.
The Rankings
California leads this indicator due to Silicon Valley’s high concentration of tech start-ups and software firms, followed by Massachusetts and New York. VC is geographically concentrated in other countries as well, as Mexico City and Nuevo León attract roughly 50 percent and 29 percent of Mexico’s total receipt of VC investment, respectively.[43] Canada’s VC investment is comparatively less concentrated, although provinces in both the Atlantic and Prairie regions attract far less VC than do British Columbia, Ontario, or Quebec. The United States, however, leads both North America and the rest of the world in its creation and attraction of VC.
|
Top 5 |
State/Province |
Total VC Invested as a Share of GDP |
|
1 |
California |
1.9% |
|
2 |
Massachusetts |
1.6% |
|
3 |
New York |
0.9% |
|
4 |
Utah |
0.6% |
|
5 |
Washington |
0.5% |
|
|
Average North American State |
0.1% |
|
|
Average Canadian Province |
0.1% |
|
|
Average Mexican State |
0.0% |
|
|
Average U.S. State |
0.2% |
Source: PricewaterhouseCoopers Moneytree Report 2019, Statista, 2020.
Cross-National Innovation Clusters
Pacific Northwest
A cluster of exceptionally high scores in the NASICI that are concentrated in the Pacific-Northwest shed new light on the region’s leadership in innovation. Washington, British Columbia, and Oregon rank within the top-10 highest-scoring states on the index, ranking 5th, 6th, and 10th. So what are these states doing right, and what makes this region a hot spot for innovation?
First, the Pacific Northwest has long been a region of collaborative innovation activity. Cross-regional development organizations such as the Pacific Northwest Economic Region (PNWER) and Cascadia Innovation Corridor have been successful in decades-long advocacy for increased investment and activity in cross-border knowledge exchange, transportation development, and human capital enrichment.[44] By building this cross-national economic identity, innovation hubs in Vancouver, Seattle, and Portland have increased economic co-investment, especially in the technology and life sciences industries. For example, the British Columbia Cancer Agency, a Vancouver-based life sciences lab doing groundbreaking cancer research on the BCRA gene, is currently working on codeveloping new isotopes for cancer diagnostics and conducting shared research on mRNA technology with the Seattle-based Fred Hutchinson Cancer Research Center—a partnership made possible through the Cascadia Innovation Corridor’s organizing of enterprise leaders for regional development.[45] This research collaboration is emblematic of the greater innovation cluster taking shape in the Pacific Northwest. Industry-university partnerships are also robust in Seattle and Portland. Oregon alone sports four major universities that operate entrepreneurship centers and programming. Oregon lawmakers have established the University Innovation Research Fund, which provides matching funding of federal investment to Oregon’s research universities from state-level public and private sources.[46] These conditions sustain a vibrant regional innovation cluster and have made Oregon and Washington top exporters in semiconductors (and semiconductor-related tech) and aircrafts, respectively.
U.S.-Mexico Border States
Competitive Manufacturing as a Strategy for Growth
Mexico has become the second-largest exporter of goods to the United States, with more than 11 percent of those exports attributable to the automobile industry. With the passage of NAFTA in 1994, automakers found their global competitiveness improved when doing business inside the United States, as the elimination of tariffs made greater manufacturing investment possible throughout North America. After NAFTA’s implementation, Mexico’s share of U.S. auto imports have grown steadily, with its 1995 share growing by 37 percent over the previous year (compared with 1994’s growth rate over 1993 of just 3 percent). (See figure 1.) With greater incentives for North American production of automobiles and automobile parts, Mexican states can leverage their comparative advantage in wage-competitive manufacturing to attract more investment from Canadian and U.S. businesses. This partnership has created a win-win for both North American companies enhancing their supply chains to build more vehicles affordably and Mexican states to create domestic production jobs while also growing their economy.
Figure 1: Mexico’s share of U.S. auto imports[47]
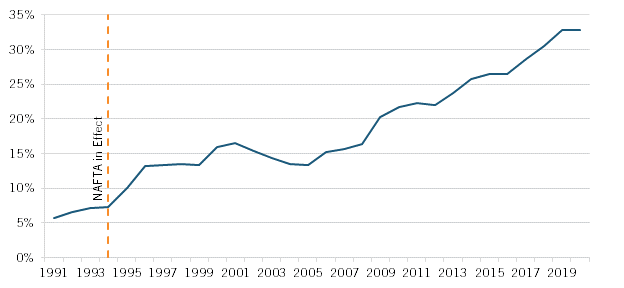
This process of wealth creation shows most success in Nuevo León, one of Mexico’s subnational winners from NAFTA, which ranked the highest of any Mexican state in the NASICI. With more than 200 auto parts manufacturers, Nuevo León has more auto suppliers than does any other Mexican state. This leadership in establishing a crucial U.S. import market has brought invaluable economic gains to Nuevo León.[48] Now the state commands a highly industrialized economy comparable to smaller European countries such as Croatia, Poland, or Slovakia. Nuevo León’s growth is due to its attraction of foreign investment and commitment to North American manufacturing. Such efforts have improved its innovation performance across some indicators observed in the North American innovation competitiveness index, with the state ranking 35th in R&D Personnel, 16th in inward FDI, and 11th in VC investment.
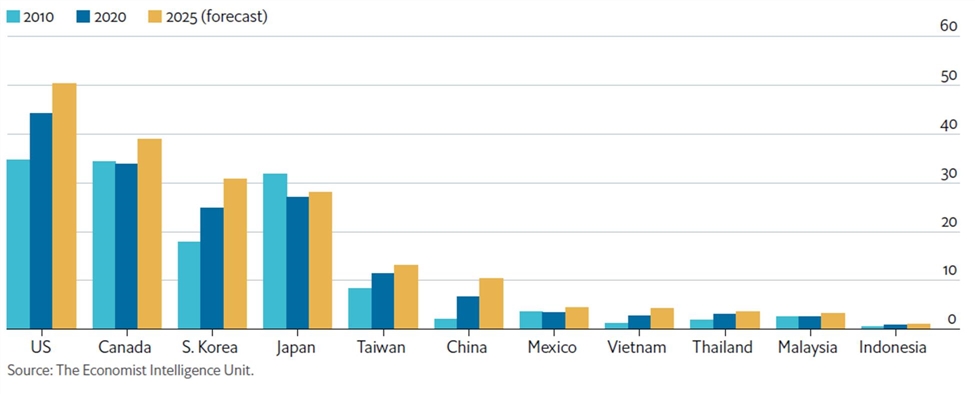
Nuevo León’s growth represents the high-wage/low-wage dynamic that could make North America a far-more significant global manufacturing powerhouse, especially when more cost-efficient labor is needed to support manufacturing efforts. Indeed, Mexico's production costs, in terms of labor cost per hour, have stayed competitive with those of Asian nations, with the gap to the U.S. wage expected to increase to one-tenth the U.S. level by 2025. (See figure 2.)
Figure 2: Average manufacturing labor cost ($US/hour)[49]
Mexico’s Innovation Capital
The state of Jalisco has seen a similar growth trajectory. But while Nuevo León’s growth comes from its involvement in auto manufacturing for North American supply chains, Jalisco’s growth comes from its commitment to new technologies. While its per-worker GVA in the manufacturing and information and communications sectors are $53K and $100K, respectively, Jalisco’s total gross value added in both fields ranks far higher. The state’s total GVA in manufacturing equals $29 billion (just below the total manufacturing GVA of California), and GVA in the information and communications industry totals nearly $20 billion, on par with that of North Carolina.[50] From these statistics, two key questions weigh on Jalisco’s innovation competitiveness: What accounts for the growth in these industries, and why is there such a gap in performance between total GVA and GVA per worker?
The answer to both questions, however, lies in the state’s capital city of Guadalajara, which has become Mexico’s high-tech capital due to a decades-long transformation that started with manufacturing technology components for the most-innovative firms of the latter half of the 20th century. Companies such as IBM, Motorola, and Hewlett-Packard all relied on the manufacturing capacity of Guadalajara to produce semiconductors and other valuable electronic products. This concentration of big tech names helped develop a cadre of Mexican firm managers, programmers, and engineers. Tech companies producing in Guadalajara expanded their investment into Jalisco’s universities to improve STEM education, shaping the way for the next generation of engineers and innovators to be tapped by multinationals with facilities in Mexico’s tech capital.
With a growing stock of STEM-oriented human capital and rising global competitors in technology manufacturing, the city’s economic strategy has evolved in the last two decades away from manufacturing electronics to designing them instead. The city now maintains R&D facilities from global tech giants—including Amazon, Oracle, IBM, and HP—and serves as an innovation hub that attracts entrepreneurs from Silicon Valley seeking an international alternative to California’s tech capital. This growth shows in Jalisco’s total number of workers employed in scientific, technical, and professional activities, reporting about 230,000 workers in the industry in 2019 (more than in several Canadian and U.S. states). Jalisco also sports roughly the same number of R&D personnel found in the state of Delaware. But Guadalajara’s prosperity is primarily why Jalisco’s performance in per capita economic measurements scores surprisingly low. Jalisco’s total population had climbed to nearly 8.5 million by 2020, whereas Delaware’s population is just under 1 million people. Jalisco’s burgeoning capital has drawn in more willing intra-national migrants looking to participate in the urban advancements, higher wages, and safer conditions. But its growing pains from a transitioning economy are nothing new. Economists such as Arthur Lewis have articulated this developmental process of an essentially two-way economy of, on the one hand, rural economic activity akin to subsistence, and on the other, an urban capitalist sector that generates an improved standard of living. Lewis’s problem of the dualistic economy is a problem of fortune that Jalisco will need to navigate in order to complete its transition to that of a higher-income state.
TSMC in Arizona: What the Semiconductor Industry Can Learn From the Auto Industry
Since NAFTA, Canada- and United States-based companies in several sectors have considered “nearshoring” in Mexico as an alternative to completely outsourcing manufacturing and IT services that would lose out to innovation-mercantilist China or “Asian Tiger” economies.[51] In recent years, U.S. nearshoring to Mexico has continued growing handily. A.T. Kearney’s near-to-far trade ratio reports that the ratio of U.S. imports from Mexico to U.S. imports from 14 Asian low-cost nations had increased by 400 basis points in just 2019 alone.[52] In that year, the United States’ increased trade reliance on Mexico relative to emergent Asian economies generated over $320 billion in total Mexican exports to the United States. Mexico is showing its competitiveness with Asian tech producers, and North America shows greater willingness to rely on Mexico, thereby expanding important cross-national innovation activity across North America. As U.S. states lead advanced-technology design and production, North American firms can build up Mexican value chains by utilizing complementary labor forces to support new product development.
Arizona presents a poignant case study in the potential for cross-national innovation activity. In 2020, the state attracted $12 billion worth of investment from the Taiwan Semiconductor Manufacturing Company (TSMC) to develop next-generation chips. With the first foundry under construction, TSMC plans to construct six new facilities in the next 10 to 15 years. Semiconductors have become one of the most essential electronic products to the global economy, with TSMC valued at more than half a trillion dollars. In contrast, the worldwide supply shortage of semiconductor chips, which has crippled many technologically advanced industries, has made the manufacturing company’s investment even more valuable. Arizona’s new facilities will be developing TSMC’s new and enhanced 5 nanometer (nm) semiconductor chips, a product highly demanded by firms creating the next generation of automobiles, smartphones, and other ICTs. TSMC intends to bring as many as 12 of its supplying firms into Arizona to open new facilities to integrate its Arizona-based semiconductor production activities better. And while many complementary firms may hope to land new facilities in Arizona, there is a valuable opportunity to integrate Mexico’s global value chains into U.S. advanced semiconductor manufacturing at the southern border.
The Mexican state of Sonora, which borders Arizona, has made significant contributions in building up the Arizona Innovation and Technology Corridor (AZITC) with its U.S. neighbor. The AZITC refers to the section of Pinal County, Arizona, between Phoenix and Tucson that has attracted a surge of business investment over the last two decades, now most notably containing facilities for electric vehicle companies Lucid Motors and Nikola. These innovative automakers chose AZITC for new facilities for proximity in distributing into key U.S. markets and for direct access to the automotive supply chain in the Arizona-Sonora region.[53] Mexico’s auto parts production for U.S. firms has driven industrial growth in the automotive industry closer to the southern border. Now innovators of next-generation vehicles are finding success in Arizona and the AZITC to host the future of electric vehicles, bringing economic growth to both sides of the southern border. Their economic partnership has seen tremendous growth in Sonora’s three manufacturing cities of Hermosillo, Guaymas, and Empalme, whose production networks generate a constant flow of over 100,000 auto parts shipped across the southern border daily.[54] Now Sonora ranks 68th in the NASICI and 8th among Mexican states, showing particular progress in expanding high-tech exports (11th), broadband access (37th), and PCT patent generation (58th).
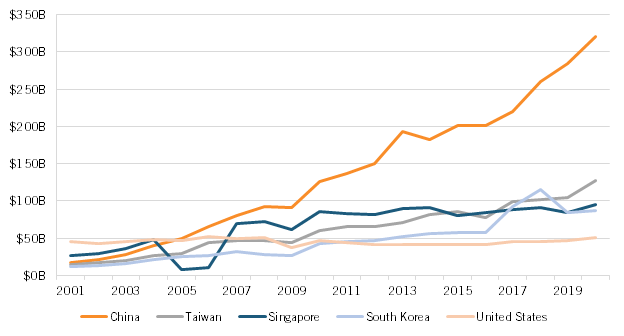
With the success of U.S. and Mexican states integrating supply chains for the automotive market, there is high potential for the same integration in advanced-technology production. TSMC basing new operations in Arizona to produce 5 nm semiconductors will bring more facilities to the region both from TSMC and its suppliers seeking to establish closer operations. Other vertically important production activities toward the development of TSMC’s semiconductor chips would benefit from locating in Mexico for its wage-competitive manufacturing, a large stock of readily available workers, and affordability of industrial space.[55] Nearshoring of these adjacent manufacturing services in the semiconductor industry would significantly improve the vertical organization of North America’s semiconductor supply chains, creating mutual economic gains for the United States and Mexico. U.S.-owned firms still maintain nearly half of the global market share of semiconductors. However, exports of all products titled under the harmonized tariff codes 8541 and 8542 show America’s percentage of semiconductor products domestically made and exported from the United States lagging behind relative to the sum of Asia’s advanced technology-producing countries.[56] Annual exports of U.S. semiconductor products have remained around $50 billion over the last two decades, whereas about $21 billion of that amount in 2020 came from re-exports.[57] (See figure 3.)
Figure 3: Global exports of semiconductor and semiconductor-related products (HS 8541 and 8542)
If North America wishes to become more competitive in semiconductor manufacturing, then it should consider how to leverage the unique capabilities of countries in the region to make that happen. For instance, right now, wafers manufactured in Samsung’s fabs in Austin, Texas, or Intel’s in Arizona, are shipped to Southeast Asian nations for final assembly, testing, and packaging (ATP). Why not have that happen in Mexico? That’s exactly why Sonora is developing an ATP competitiveness strategy for the state. In other words, nearshoring of advanced-technology production in Mexico should be considered a valuable complement to sourcing
from Asia.
Policy Recommendations
Expand the R&D Tax Credit to Be Competitive With Canada
In an indicator of privately employed R&D personnel, the NASICI shows that Canadian provinces on average outperform U.S. states, with the average province employing more than double the share of R&D personnel than the average U.S. state does. This gap is in no small part due to Canada’s enhanced level of R&D tax incentives compared with the United States’. In a previous report comparing U.S. tax incentives for R&D against that of other countries, ITIF found that Canada maintains an overall federal subsidy rate of 19.1 percent on business R&D investment.[58] This level was above the 16.6 percent median among 34 developed countries observed, whereas the United States recorded a sub-median federal-state subsidy rate of 9.5 percent. Even with this comparatively low tax incentive for R&D investment, U.S. states still appear highly competitive in rankings of innovation capacity, especially in total gross expenditures on R&D, where the top-five states are all U.S. ones. Expanding the U.S. federal-state subsidy rate to 15 percent would support more privately employed R&D personnel in U.S. states, make U.S. tax support for R&D on par with the rest of the developed research world, and grow the economy via increased innovation and productivity from an expansion of newly incentivized R&D.
Build Globally Competitive North American Supply Chains
R&D-intensive Canadian provinces and U.S. states that will design the next generation of electric vehicles, semiconductors, and ICTs have a unique opportunity through proximity with Mexico to vertically integrate their complementary workforces and production and innovation capacities. Innovation leaders such as Massachusetts, California, and Ontario—states with heavy concentrations of software, life sciences, and other tech firms—score highly in R&D intensity, R&D workforces, and patenting. These states conduct the R&D, design, and innovation of new technologies in the global economy and provide a bulk of the scientists and engineers comprising the innovation economy’s high-wage research and high value added per-worker manufacturing. Low-tech production states in Mexico such as Nuevo León, Jalisco, Sonora, and Queretaro possess largely available workforces with a comparative advantage over the lower-wage, labor-intensive manufacturing that firms in R&D-intensive states require to produce and administer innovations. U.S.- and Canadian-based technology firms can nearshore their production of innovative goods and the low-tech complementary manufacturing of products in high-tech industries into Mexico. Mexican states would experience economic growth and job creation, and North American states will improve their global competitiveness in high-tech exports and future innovations. This collaboration of complementary labor forces would help North American
supply chains perform as a region that’s globally competitive with the supply chains of Asian
low-cost competitors.
Promote Industry-University Partnerships
Businesses have a clear interest in promoting advancements in STEM education for the universities that surround them. Doing so expands the available human capital of workers able to complete the high-skill jobs of innovative firms. Firms on the cutting edge of new research can benefit from tapping the skills of the next generation of scientists and engineers early on by collaborating with neighboring universities via internships, fellowships, and other resource sharing with academic institutions. As federal funding for intramural research in states/provinces lags behind, industry investment in university research is increasingly important. In Mexico’s tech capital of Guadalajara, the tech industry’s investment in surrounding universities made new courses available in STEM that trained a new generation of engineers and programmers from Jalisco. Those students eventually took management positions in those foreign-based tech firms that invested in the state, leading to greater levels of local R&D performance and entrepreneurship. While middle-income states can grow their economies through business partnerships with high-income states, increased industry funding in university research shows small, modest correlations with VC (0.28), high-tech jobs (0.14), and patents produced by academic sources (0.26).[59] When enterprises invest earlier in state universities, that state’s
stock of human capital rises, supporting a cycle that continuously benefits businesses and academic institutions.
Expand Collaborative Research Between U.S. and Canadian Leaders
Competitiveness in the innovation economy is heavily informed by a state’s creation of IP, as new IP provides protections that incentivize high-value innovations in technology and production. Firms engaging in international research collaboration tend to generate more valuable research than firms not collaborating in research or only collaborating among domestic firms do. One study finds that firms with patents co-owned by international firms earn citations 20 percent more than those with non-co-owned patents. International collaboration provides more prosperous innovations due to a broader pool of advanced human capital that combines different degrees of comparative advancement in scientific research. Further, states diversifying research collaborations with international research partners pool a wider network of knowledge/research/resource linkages and are more effective in the diffusion of innovations.[60] Currently, the United States’ research collaboration network is most heavily concentrated with EU firms, most densely in France and Germany.[61] Firms of U.S. and Canadian states/provinces should thus pursue greater research collaboration and co-patenting, given the proven benefits in international research collaboration and diversifying with new research partners. Doing so would help expand the network of shared research knowledge to drive more frequent and impactful innovations for both U.S. and Canadian states.
Fully Embrace USMCA’s Commitments to Create a Free-Flowing North American Digital Economy
The USMCA, which took effect in July 2020, replaced the 1994 NAFTA agreement to modernize the North American trade framework for the 21st century. The USMCA contains long-overdue provisions on IP protection, digital trade, and labor and environmental standards. Given the value a growing digital economy has brought to North America, all parties have a responsibility to notify national officials of trade barriers they encounter that USMCA provisions are positioned to remedy. Each country has set digital-trade barriers in some fashion, whether by the City of Los Angeles requiring Google to store its data within the continental United States as a condition of its contract with the city, British Columbia and Nova Scotia enacting provincial-level localization requirements for personal data, or Mexico adding consent requirements for cross-border data transfers.[62] Cross-border data flows are an essential component of a vibrant and free-flowing North American economy, so, per the stronger rules governing digital trade established in the USMCA, North American countries should eschew these types of data-localization barriers. USMCA rules provide governance on new digital services across industries such as finance, e-commerce, and software, but its economic benefits in ensuring free trade require communication between subnational and national policymakers to flag instances of digital trade barriers occurring at the local level. These three countries’ mutual agreement to the USMCA’s chapters on financial services and digital trade provide policymakers with a set of tools that can broker a smoother integration of North American digital trade via compliance with commitments on the prohibition of data restriction. [63] Doing so would ensure a free flow of cross-border data throughout North America so firms based in Canada, Mexico, and the United States can utilize the full economic value of data and remain competitive in the global digital economy.[64]
Expand National Place-Based Development Projects
The NASICI is useful for, among other things, identifying intranational innovation disparities. These disparities emerge as regions of states lagging behind in economic development, as composite scores show poorer performance (relevant to the corresponding country’s average performance of states) in the U.S. South, the Atlantic provinces of Canada, and in the southern non-industrialized states of Mexico. National place-based policymaking can help close large gaps in states’ innovation competitiveness through targeted support to lagging subnational regions. For instance, Massachusetts, the state scoring highest on the NASICI, earns a composite score of 91.5, compared with the lowest ranking U.S. state of South Dakota (60th), which earns a score of 35.9. This score is closer to the Mexican states' median (24.2) than the U.S. median (50.2). While the United States historically has extended greater development efforts at the federal level in place-based policymaking through the Economic Development Administration (EDA) and regional commissions such as the Great Plains Authority and Delta Regional Authority, these efforts have since fallen off.[65] If EDA commanded the same share of GDP today as it did in 1979, the agency’s annual budget would be nearly $52 billion.[66] While there will always be some regional disparities and “winners ” and “losers” among states in the innovation-driven economy, federal investment to build up economic attractiveness for underperforming states can improve their competitive edge and reduce economic hardships for the populations of those states.
Improve Economic Indicator Data Availability Among North American States
For the purposes of preparing the NASICI, ITIF and its Canadian and Mexican partners were only able to identify 13 indicators for which data was uniformly and readily available across North America’s 92 subnational regions. Statisticians from Canada, Mexico, and the United States should collaborate to make more such indicators available. In the case of Canada, national statistical agencies should work to expand more of their subnational data to include territories as well, not just provinces. Many indicators used in this report provide no comparable data for Canada’s subnational territories of Nunavut, Yukon, and the Northwestern Territories.
For the purposes of preparing the NASICI, ITIF and its Canadian and Mexican partners were only able to identify 13 indicators for which data was uniformly and readily available across North America’s 92 subnational regions.
Conclusion
Today’s 21st-century economy has different success markers than the post-war economy experienced in the latter half of the 20th century. There are many more global competitors in the space of advanced technology production, R&D, and digital services. A state’s competitiveness in the innovation-driven economy relies on its knowledge-based workforce, global presence, and innovation capacity. The 13 economic indicators presented in this report show subnational performance in the new measures of the innovation economy, which together constitute a state’s overall innovation competitiveness. Scores on this composite index present a common metric for observing innovation competitiveness at the subnational level among North American countries; however, this index could expand to include other countries. A similar model for data acquisition and index-building could also be applied to measure the innovation competitiveness of cities around the world. This index ultimately has utility in realizing innovation leadership among nations with strong and partially autonomous subnational economies and highlights the traits and policy decisions that make those subnational entities successful.
Further, by identifying low-scoring states, this index helps define economic differences among subnational economies. NASICI scores are helpful to bring to light regions needing more federal attention to support innovation competitiveness. Similarly, the North American Innovation Competitiveness Index helps identify cross-national innovation performance and tracks North America’s overall competitiveness in the innovation-driven global economy.
Appendix A: Composite Index Methodology
The purpose of this report is to provide a cross-national tool to quantify competitiveness in the new innovation-driven economy among North American states. NASICI enables direct performance comparisons between states across countries to draw out both regional innovation clusters and to add a frame of reference to innovation progress made at the state level.
Similar to the State New Economy Index (SNEI), this index produces a common set of U.S. innovation leaders both nationally and continentally. This overlap is due to selecting economic indicators to form the composite index covered by the SNEI. However, rankings of U.S. states assigned by this index are not directly comparable to the SNEI rankings. While the NAICS allows for far more direct comparisons of industry data analysis between states of different North American countries, national statistical agencies still vary in their abundancy and frequency of new data, level of granularity in economic measurements, and categorizations of non-NAICS terms (such as R&D personnel). For these reasons, NASICI indicators pay special attention to keeping directly comparable data between the much-larger set of 92 North American subnational entities observed (as opposed to just 50 states). NASICI controls for differences in states' population and economic sizes by using several indicators measured as either share of population/workforce/GDP or per-worker output. As such, the largest economy is not necessarily the most competitive state for the innovation-driven economy. This index also serves as a resource for understanding how states manage intrastate economic disparities.
The composite index discussed in this report is composed of 13 economic indicators that each convey a dimension of competitiveness in the innovation-driven economy. Weights assigned to each indicator are based on selected weights of equivalent variables in ITIF’s recurring report series, “State New Economy Index.” As such, this index controls for the industry-sector mix of states by selecting economic variables concerning business activities such as R&D, patenting, and manufacturing productivity. Yet, while data for a given indicator in one country may be more current than in others, the multinational sampling of this data among North American countries constrains this index to use the latest available data common among all reporting countries. Further, the index is constrained by differences in level of detail at which countries report indicators. Due to these modeling limitations, much of the data to compare the innovation competitiveness of subnational entities across North America is taken from the OECD’s Regions and Cities Database. In order to put indicators of different number formats—dollar amounts, percentages, and scores—into a common scale for weighted averaging, each indicator’s values are standardized (taken as the number of standard deviations away from the mean). Standardizing scores of each indicator also retains magnitude in comparisons of each state’s performance, rather than sheering rankings between 1 and 92. Any state with an indicator’s standardized score greater than 300 percent is capped at 300 percent to avoid outliers skewing indicator weights. After computing a weighted average of these 13 standardized scores for each state, overall scores are rescaled into a 100-point scale via min-max normalization, wherein the maximum possible score a state could earn would be 100, and the lowest possible being 0.
Appendix B: Indicator Methodologies and Weights
|
Indicator |
Weights |
Available Data |
Methodology |
Source |
Category |
|
Broadband Subscription Rate |
0.75 |
2017 |
Share of households subscribing to broadband Internet |
OECD Regions & Cities Database |
Innovation Capacity |
|
Business Creation |
0.50 |
2017 |
Economy-wide business birth rate, as percentage of new businesses created in all firms (same sector, same class size) |
OECD Regions & Cities Database |
Innovation Capacity |
|
Decarbonization |
0.50 |
2010 |
CO2 emission tons per capita |
OECD Regions & Cities Database |
Innovation Capacity |
|
High Tech Exports |
0.75 |
2019 |
Total value added of exports between NAICS 333, 334, and 335 |
Innovation, Science and Economic Development Canada, USA Trade Online, INEGI-EAEF |
Globalization |
|
Immigration of Knowledge Workers |
0.50 |
2019 |
Foreign-born workers with High-Level education (as per OECD rating and categorization), relative to population |
InvestCanada, Mexico Ministry of Economy, US Bureau of Economic Analysis |
Knowledge Economy |
|
Inward FDI |
0.75 |
2018 |
Amount of foreign direct investment received from other countries, relative to GDP |
OECD Regions & Cities Database |
Globalization |
|
Labor Productivity in Manufacturing |
1.25 |
2018 |
Gross value added per worker in manufacturing industry |
OECD Regions & Cities Database, American Communities Survey – U.S. Census Bureau, Statistics Canada, National Institute of Statistics and Geography (INEGI) -ENADID |
Knowledge Economy |
|
Patents |
1.25 |
2015 |
PCT patents per 1,000,000 people |
OECD Regions & Cities Database |
Innovation Capacity |
|
R&D Intensity |
1.50 |
2019 |
Total state expenditure of R&D (Government + Higher Education + Business Enterprise), as share of GDP |
Statistics Canada, INEGI, National Science Foundation |
Innovation Capacity |
|
R&D Personnel |
1.50 |
2019 |
Workers involved in R&D processes, as identified by national agencies, as share of total employment |
Statistics Canada, INEGI, US Bureau of Labor Statistics |
Innovation Capacity |
|
Scientific, Technical, Professional Employment |
1.25 |
2018 |
Percentage of total employment under the category scientific, professional, and technical activities (NAICS 54) |
OECD Regions & Cities Database |
Knowledge Economy |
|
Venture Capital |
0.75 |
2019 |
Total venture capital $ invested in a given state, as share of GDP |
PWC Moneytree Report, SNEI 2020 (ITIF), Statista |
Innovation Capacity |
|
Workforce Education |
1.00 |
2018 |
Share of labor force with postsecondary education, as share of total labor force |
OECD Regions & Cities Database |
Knowledge Economy |
Acknowledgments
The authors would like to thank Robert Atkinson and Alex Key from ITIF; Aaron Wudrick from the Macdonald-Laurier Institute; Daniel Schwanen from the C.D. Howe Institute in Canada; Carolina Agurto from Fundación Idea in Mexico; and Sean Randolph from the Bay Area Council Economic Institute for their assistance with this report. The think tanks are members of the Global Trade and Innovation Policy Alliance (GTIPA).
Any errors or omissions are the authors’ responsibility alone.
About the Authors
Luke Dascoli was an economic and technology policy research assistant at ITIF. He was previously a research assistant in the MDI Scholars Program at the McCourt School of Public Policy’s Massive Data Institute. He holds a B.A. in Political Economy from Georgetown University.
Stephen J. Ezell is vice president for global innovation policy at ITIF focuses on science, technology, and innovation policy as well as international competitiveness and trade policy issues. He is the coauthor of Innovating in a Service Driven Economy: Insights Application, and Practice (Palgrave McMillan, 2015) and Innovation Economics: The Race for Global Advantage (Yale 2012).
About ITIF
The Information Technology and Innovation Foundation (ITIF) is an independent, nonprofit, nonpartisan research and educational institute focusing on the intersection of technological innovation and public policy. Recognized by its peers in the think tank community as the global center of excellence for science and technology policy, ITIF’s mission is to formulate and promote policy solutions that accelerate innovation and boost productivity to spur growth, opportunity, and progress.
For more information, visit us at itif.org.
Endnotes
[1]. “GDP of North America,” Statistics Times, https://statisticstimes.com/economy/north-america-gdp.php; “North American supply chains: Will reshoring actually happen?” (The Economist Intelligence Unit, 2021), https://economistchina.com/wp-content/uploads/North-American-supply-chains-Will-reshoring-actually-happen.pdf.
[2]. Robert Atkinson and John Wu, “The 2020 State New Economy Index” (ITIF, 2020), https://itif.org/publications/2020/10/19/2020-state-new-economy-index.
[3]. Abdulla Snobar, “Why Canada's Largest City Has Become A Heavy-Hitting Global Tech Hub,” Forbes, February 19, 2020, https://www.forbes.com/sites/forbestechcouncil/2020/02/19/why-canadas-largest-city-has-become-a-heavy-hitting-global-tech-hub/.
[4]. Vancouver Economic Commission, “Our Focus, Technology,” https://www.vancouvereconomic.com/focus/technology/.
[5]. Beth Jensen, “Mexico City—Latin America’s Future Tech Hub?” Stanford Graduate School of Business, April 21, 2020, https://www.gsb.stanford.edu/insights/mexico-city-latin-americas-future-tech-hub.
[6]. Andreas Waldkirch, “The effects of foreign direct investment in Mexico since NAFTA” (Colby College, March 2008), https://papers.ssrn.com/sol3/papers.cfm?abstract_id=1115300.
[7]. Pablo Mejía-Reyes and Jeanett Campos-Chávez, “Are the Mexican states and the United States business cycles synchronized? Evidence from the manufacturing production” (Economía Mexicana Nueva Época, December 2009), https://www.academia.edu/53296935/Are_the_Mexican_states_and_the_United_States_business_cycles_synchronized_Evidence_from_the_manufacturing_production.
[8]. Adams Nager et al., “The Demographics of Innovation in the United States” (ITIF, February 2016), https://www2.itif.org/2016-demographics-of-innovation.pdf.
[9]. Tina Huang et al., “Most of America's "Most Promising" AI Startups Have Immigrant Founders - Center for Security and Emerging Technology” (Georgetown University Center for Security and Emerging Technology, October 2020), https://cset.georgetown.edu/publication/most-of-americas-most-promising-ai-startups-have-immigrant-founders/.
[10]. David M. Hart, “Global Flows of Talent: Benchmarking the United States” (ITIF, November 2006), http://www.itif.org/files/Hart-GlobalFlowsofTalent.pdf; Asadul Islam, Faridul Islam, and Chau Nguyen, “Skilled Immigration, Innovation and Wages of Native-Born Americans” (discussion paper, Monash University, 2013), 64, https://onlinelibrary.wiley.com/doi/abs/10.1111/irel.12182; Atkinson and Wu, “The 2020 State New Economy Index.”
[11]. OECD Data, “Education attainment - Adult education level,” 2020, https://data.oecd.org/eduatt/adult-education-level.htm#indicator-chart.
[12]. Hart, “Global Flows of Talent: Benchmarking the United States.”
[13]. Immigroup, “Immigration: The United States of America vs Canada,” https://www.immigroup.com/topics/immigration-united-states-america-vs-canada/
[14]. Council for Aid to Education, “Evidence-Based Practices Supporting College and Career Readiness in High School: Early College High School,” https://ccrscenter.org/products-resources/evidence-based-practices-supporting-college-and-career-readiness-high-school.
[15]. U.S. Bureau of Labor Statistics (BLS), “Industries at a Glance: Professional, Scientific, and Technical Services: NAICS 54,” https://www.bls.gov/iag/tgs/iag54.htm.
[16]. BLS, “Quarterly Census of Employment and Wages (labor productivity and costs),” http://www.bls.gov/cew/.
[17]. Ken Voytek, “Who is #1?: Measuring Manufacturing Value Added per Employee Across the Nation,” National Institute of Standards Manufacturing Innovation Blog, August 16, 2017, https://www.nist.gov/blogs/manufacturing-innovation-blog/who-1-measuring-manufacturing-value-added-employee-across.
[18]. Michael Ferrantino, “The Effects of Foreign Direct Investment on the U.S. Economy,” International Economic Review (March/April 2001), https://ciaotest.cc.columbia.edu/olj/ier/2001_marapr/ier_ma01b.pdf.
[19]. Riccardo Crescenzi, Roberto Ganau, and Michael Storper, “Does foreign investment hurt job creation at home? The geography of outward FDI and employment in the USA,” Journal of Economic Geography (April 2021), http://eprints.lse.ac.uk/109864/4/lbab016.pdf.
[20]. Kathy Tomlinson, “Foreign investors avoid taxes by buying real estate in Canada,” The Globe and Mail, June 2019, https://www.theglobeandmail.com/real-estate/the-market/foreign-investors-avoid-taxes-by-buying-real-estate-in-canada/article26683767/.
[21]. Invest Canada, “By the numbers: Foreign direct investment in Canada,”https://fdi2019.investcanada.ca/by-the-numbers.
[22]. OECD.Stat. “Business enterprise R&D expenditure by industry,” https://stats.oecd.org/Index.aspx?DataSetCode=BERD_INDU.
[23]. Tecma, “Mexican exports from the State of Chihuahua increase,” https://www.tecma.com/exports-from-the-state-of-chihuahua/.
[24]. Pantelis Koutroumpis, “The economic impact of broadband: Evidence from OECD countries,” Technological Forecasting and Social Change (November 2019), https://www.sciencedirect.com/science/article/abs/pii/S004016251930112X.
[25]. Government of Canada, “Building a Better Canada: Universal High-Speed Internet,” https://budget.gc.ca/2019/docs/nrc/infrastructure-infrastructures-internet-en.html.
[26]. Ibid.
[27]. Jack Barry, “Mexico wants internet access for all. Getting everyone online could reduce poverty, too,” The Conversation, November 26, 2018, https://theconversation.com/mexico-wants-internet-access-for-all-getting-everyone-online-could-reduce-poverty-too-104206.
[28]. National Science Foundation, “Science and Engineering Indicators 2020” (Table 4-1),” https://ncses.nsf.gov/indicators/data.
[29]. Myeongwan Kim and John Lester, “R&D Spillovers in Canadian Industry: Results from a New Micro Database” (Centre for the Study of Living Standards August 2019), http://www.csls.ca/reports/csls2019-02.pdf?mc_cid=8bf985bf74&mc_eid=[4589597ff8].
[30]. Leonardo Giuffrida and Emilio Raiteri, “Buyers’ workload and R&D procurement outcomes: Evidence from the US Air Force Research Lab” (Leibniz Centre for European Economic Research, July 2021), https://www.econstor.eu/bitstream/10419/236635/1/1765457327.pdf.
[32]. John Lester and Jacek Warda, “Enhanced Tax Incentives for R&D Would Make Americans Richer” (ITIF, 2020), https://www2.itif.org/2020-enhanced-tax-incentives-rd.pdf.
[33]. SCRIP 100 (In Vivo Informa Pharma Intelligence, 2016), op. cit. 8.
[34]. Williams, Nick, and Tim Vorley. “Economic Resilience and Entrepreneurship: Lessons from the Sheffield City Region.” Entrepreneurship and Regional Development, vol. 26, no. 3-4, Routledge, 2014, 257–81
[35]. Visions of Humanity, “Mexico Peace Index,” accessed at https://www.visionofhumanity.org/maps/mexico-peace-index/#/.
[36]. Grajeda Campos et al., “Analysis Of The Factors That Impact The Competitiveness Of MSMEs In The State Of Tlaxcala,” American Journal of Multidisciplinary Research & Development, July 2020.
[37]. Robert D. Atkinson and Caleb Foote, “Monopoly Myths: Is Concentration Leading to Fewer Start-Ups?” (ITIF, August 2020), https://itif.org/publications/2020/08/03/monopoly-myths-concentration-leading-fewer-start-ups.
[38]. IEA, “Data Centres and Data Transmission Networks – Analysis,” https://www.iea.org/reports/data-centres-and-data-transmission-networks.
[39]. Nicola Jones, “How to stop data centres from gobbling up the world’s electricity,” Nature, September 12, 2018, https://www.nature.com/articles/d41586-018-06610-y.
[40]. UN Sustainable Development, “Low-Carbon Development for Mexico” 2010, https://sustainabledevelopment.un.org/content/documents/851mexico.pdf.
[41]. Author’s own calculations taking correlation of state scores in decarbonization against GDP and GDP per capita.
[42]. Roland Tricot, “Venture Capital Investments in Artificial Intelligence“ (OECD Digital Economy Papers, September 2021), https://doi.org/10.1787/f97beae7-en.
[43]. Mairem Del Río, “Attention entrepreneurs and startups, this is how Corporate Venture Capital invests in Mexico according to study,” entrepreneur.com, November 2021, https://www.msn.com/en-us/money/smallbusiness/attention-entrepreneurs-and-startups-this-is-how-corporate-venture-capital-invests-in-mexico-according-to-study/ar-AAQyLvY.
[44]. Cascadia Innovation Corridor (connectcascadia.com) & PNWER - Pacific NorthWest Economic Region.
[45]. Greggory Scruggs, “Life sciences leaders see big opportunity for more collaboration across Seattle and Vancouver,” GeekWire, 2021), https://www.msn.com/en-us/health/medical/life-sciences-leaders-see-big-opportunity-for-more-collaboration-across-seattle-and-vancouver/ar-BB1drFdw.
[46]. University of Oregon, “University Innovation Research Fund - Business Oregon | Research and Innovation,” https://research.uoregon.edu/apply/apply-internal-funding/university-innovation-research-fund-business-oregon.
[47]. Author’s own calculations using imports data International Trade Center, “Trade Map Database.”
[48]. Oxford Business Group, “Auto parts and metal segments drive innovation in Nuevo León’s manufacturing industry,” https://oxfordbusinessgroup.com/analysis/steel-front-auto-parts-and-metal-segments-continue-drive-innovation-nuevo-le%C3%B3n%E2%80%99s-manufacturing.
[49]. The Economist Intelligence Unit, “North American supply chains: Will reshoring actually happen?” (EIU, June 2021), https://www.eiu.com/public/topical_report.aspx?campaignid=jun21nareshoring.
[50]. Author’s calculations using Index values.
[51]. Ezell et al., “Contributors and Detractors: Ranking Countries' Impact on Global Innovation” (ITIF, 2016), https://itif.org/publications/2016/01/20/contributors-and-detractors-ranking-countries-impact-global-innovation.
[52]. Kearney, “Trade war spurs sharp reversal in 2019 Reshoring Index, foreshadowing COVID-19 test of supply chain resilience,” https://www.kearney.com/operations-performance-transformation/article/?/a/trade-war-spurs-sharp-reversal-in-2019-reshoring-index-foreshadowing-covid-19-test-of-supply-chain-resilience-full-report.
[53]. Leo Lew, “What is The Arizona Innovation and Technology Corridor?” (ArcGIS, August 2021), https://storymaps.arcgis.com/stories/7f209d9afda846bca02142de08af1d1c.
[54]. The ILS Company, “Take advantage of the growing Sonora corridor”, https://www.ilscompany.com/sonoran-corridor/.
[55]. NAPS, “Cost of Industrial Buildings in Mexico vs. U.S.,”https://napsintl.com/mexico-manufacturing-news/cost-of-industrial-buildings-in-mexico-vs-u-s/.
[56]. Semiconductor Industry Association, “2021 Factbook” (SIA, 2021), https://www.semiconductors.org/wp-content/uploads/2021/05/2021-SIA-Factbook-FINAL1.pdf.
[57]. Author’s calculations using ITC, “Trade Map Database” for the total of exports categorized under the HS products titled 8541 and 8542.
[58]. Ibid., 32.
[59]. Cited correlations come from National Science Board, Science & Engineering Indicators 2016 (Arlington, VA: National Science Foundation, 2016), Table 8-48, “Academic Patents Awarded per 1,000 Science, Engineering, and Health Doctorate Holders in Academia,” https://www.nsf.gov/statistics/2016/nsb20161/uploads/1/13/tt08- 48.pdf. and Robert D. Atkinson and John Wu, “The 2017 State New Economy Index” (ITIF, June 2017), https://itif.org/publications/2017/11/06/2017-state-new-economy-index. See also: John Wu and Robert D. Atkinson, “How Technology-Based Start-Ups Support U.S. Economic Growth” (ITIF, November 2017), https://www.itif.org/publications/2017/11/28/how-technology-based-start-ups-support-us-economicgrowth.
[60]. Ronald S. Burt, "Structural Holes and Good Ideas." (American Journal of Sociology, 2004), https://www.bebr.ufl.edu/sites/default/files/Structural%20Holes%20and%20Good%20Ideas_0.pdf.
[61]. Takashi et al., “How Does the Global Network of Research Collaboration Affect the Quality of Innovation?” (RIETI Discussion Paper Series, October 2018), https://www.rieti.go.jp/jp/publications/dp/18e070.pdf.
[62]. Nigel Cory and Luke Dascoli, “How Barriers to Cross-Border Data Flows Are Spreading Globally, What They Cost, and How to Address Them” (ITIF, 2021), https://itif.org/publications/2021/07/19/how-barriers-cross-border-data-flows-are-spreading-globally-what-they-cost.
[63]. Nigel Cory,” Bring USMCA to Life: The United States Should Ensure Mexico Abides by Commitments to Allow the Free Flow of Data” (ITIF, June 2021) https://itif.org/publications/2021/06/17/bring-usmca-life-united-states-should-ensure-mexico-abides-commitments-allow.
[64]. Office of United States Trade Representative, “USMCA: Chapter 17-Financial-Services,” https://ustr.gov/sites/default/files/files/agreements/FTA/USMCA/Text/17-Financial-Services.pdf; “USMCA: Chapter 19-Digital Trade,” https://ustr.gov/sites/default/files/files/agreements/FTA/USMCA/Text/19-Digital-Trade.pdf.
[65]. Congressional Research Service, “Federal Regional Commissions and Authorities: Structural Features and Function“ (CRS, April 2021), https://crsreports.congress.gov/product/pdf/R/R45997.
[66]. Rob Atkinson, “It’s Time to Bring Back Place-Based Policymaking” (American Compass, May 2021), https://americancompass.org/the-commons/its-time-to-bring-back-place-based-policymaking/.
