


Mission Innovation, Phase 2: More Failed Aspirations to Fight Climate Change
Twenty-three countries plus the EU pledged in 2015 to double their investments in clean energy RD&D by 2020. Only one met that goal. Undeterred, they announced a new set of pledges in 2021. Two years later, most are still woefully underinvesting in clean energy RD&D.
KEY TAKEAWAYS
Key Takeaways
Contents
What Happened to Mission Innovation in Phase 1?. 2
What Has Mission Innovation Done in Phase 2?. 8
Appendix 1: Mission Innovation 1.0. 13
Appendix 2: Mission Innovation 2.0. 15
Introduction
In 2015, 23 countries plus the European Union launched Mission Innovation (MI 1.0) to “accelerate the pace of clean energy innovation.”[1] As the Information Technology and Innovation Foundation (ITIF) had previously advocated, MI 1.0’s main goal was to double governments’ investments in clean energy research, development, and demonstration (RD&D) by 2020.[2] But by the end of 2020, only one of MI 1.0’s tracked members met that goal, the United Kingdom. Spain achieved its goal by 2021, as did France by 2022.[3] The others still have not. On the evidence, then, Mission Innovation has mostly been talk with little action.
As ITIF has long argued, transitioning from dirty energy to clean energy will not happen on a global scale until clean energy is affordable and effective, which will require significantly more innovation first and foremost—and that, in turn, is largely dependent on public RD&D funding.[4] Nevertheless, most of the world’s developed nations have invested relatively little.
On the evidence, Mission Innovation has mostly been talk with little action.
With only incremental increases in spending on clean energy innovation among MI members—and in some cases decreases—no one can claim that the problem is being addressed with the requisite level of urgency. While nations at COP28 in the United Arab Emirates will likely make more bold commitments to achieve emissions reductions, it is striking and disturbing that these statements are not backed up by real investments in clean energy innovation. (See box 1.)
Mission Innovation, while still holding great promise, has not lived up to its potential. It’s not too late for member countries to remedy this. But policymakers must understand: Accelerating clean energy innovation remains the single most important step governments can take to help address global climate change.
What Happened to Mission Innovation in Phase 1?
Member countries launched MI 1.0 with much fanfare during COP21 in November 2015. The overarching goal was to accelerate widespread clean energy innovation, and the specific pathway agreed to in MI 1.0 was to double government investment in clean energy innovation.[5] Even in the middle of Phase 1, though, it was already clear that members were not prioritizing their commitments to pursue this goal. Based on the mid-cycle trajectory, ITIF projected that MI would reach only 50 percent of its 2020 target.[6]
Since then, Mission Innovation has touted results on its website, but those funding levels are less than impressive.[7] Moreover, MI neither provides nor cites any sources for the data it reports. Ultimately, 19 members for which data are available increased public RD&D investments by only 16 percent (see figure 1). The United Kingdom was the only country that met MI 1.0’s goal of doubling its investments (+113 percent). Investments actually decreased for six countries.
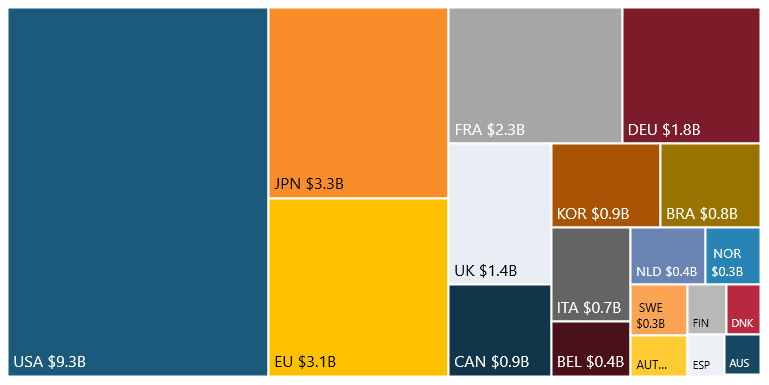
It is striking that while the United States is criticized for not doing enough to fight climate change—in part because President Trump pulled out of the Paris climate accords—it is investing nearly three times more in absolute terms than any other nation that reports data. (See figure 2.)
Figure 1: Change in investments in clean energy public RD&D during MI 1.0 (2015–2020 in 2022 PPP)
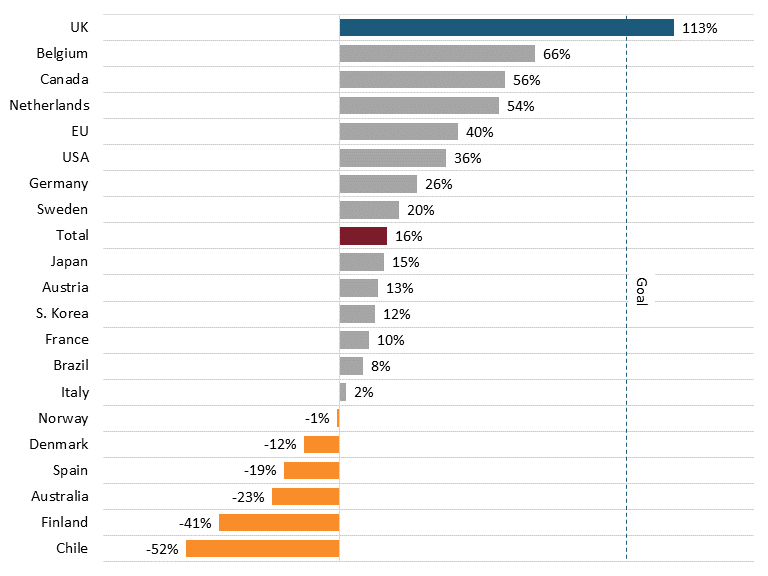
Figure 2: Investments in clean energy public RD&D as of 2020 ($26.8 billion total in 2022 PPP)
However, the real measure should not be doubling funding, but doubling funding as a share of GDP, as increased GDP gives nations more financial headroom to expand investments, and it controls for inflation. As a share of GDP, public clean energy RD&D investments increased even less (see figure 3).
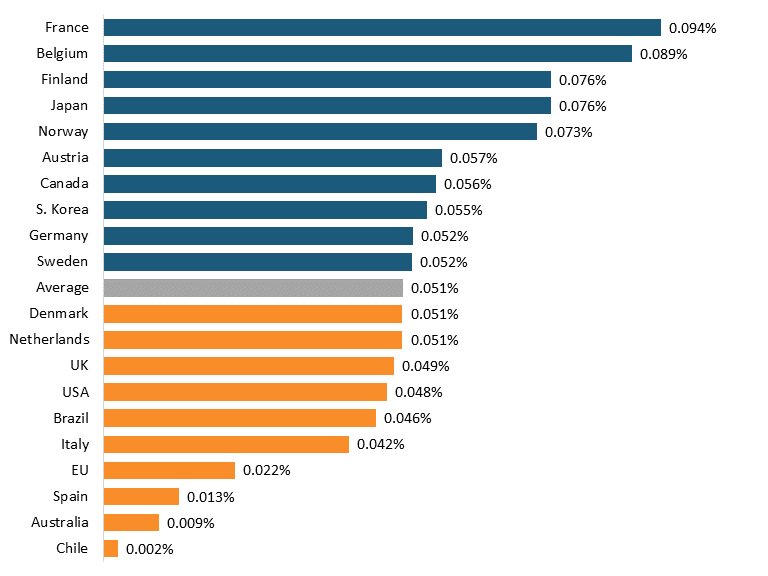
Although the United Kingdom successfully doubled its percentage share from 2015 to 2020, it started from such a low place (0.022 percent in 2015) that it still finished 13th among MI countries in 2020 (0.049 percent). (See figure 4.) Moreover, while the northern European countries ranked among the top nations during the entirety of MI 1.0, Denmark, Finland, and Norway’s RD&D all fell as a share of GDP from 2015 to 2020. The United States remains a middling performer reaching 0.048 percent of GDP in 2020. And six countries saw declines. Overall, spending increased as share of GDP by just 14 percent.
Figure 3: Change in clean energy public RD&D investment as a share of GDP during MI 1.0 (2015–2020)
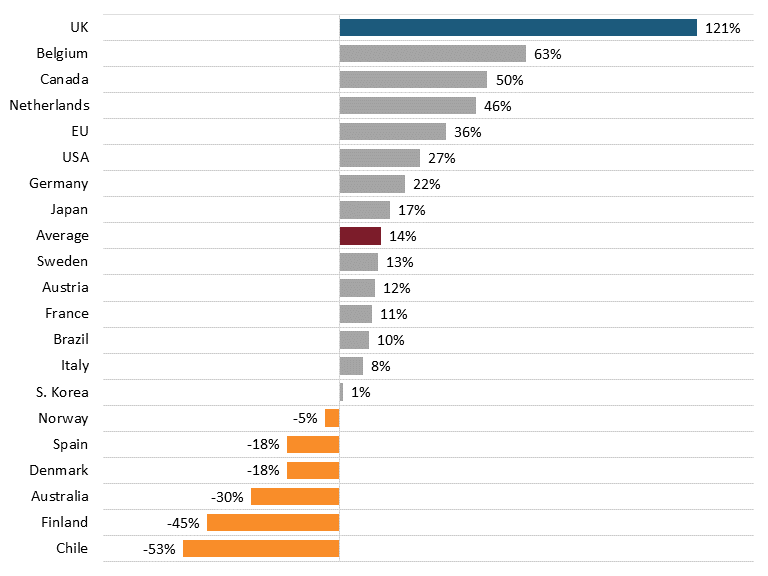
Figure 4: Investment in clean energy public RD&D as a share of GDP, 2020
Box 1: Public Statements on Climate Change and Clean Energy R&D Funding
Australia:
§ Statement: “Climate change is a primary economic and security challenge for our region—and an existential threat to the Blue Pacific continent.”[8]
§ Action: Climate energy RD&D as a share of GDP fell from 0.0135 percent in 2015 to 0.0094 percent in 2020, a decline of approximately 30 percent.
Austria
§ Statement: “The most vulnerable countries in the Global South are suffering particularly badly from the consequences of the climate crisis—and are rightly demanding more support from industrialized countries… Austria is taking responsibility.”[9]
§ Action: Climate energy RD&D as a share of GDP rose from 0.0513 percent in 2015 to 0.0573 percent in 2020, an increase of approximately 12 percent.
Chile
§ Statement: “Chile’s climate change law came into force in June, making it one of 18 countries to legally bind itself to achieving carbon neutrality by 2025. It requires key government ministries to have climate and adaptation plans, and for sectoral greenhouse gas emissions limits to be set, with sanctions for non-compliance. The law will make a very important change to the entire state at the central level and then in all regions and municipal districts.”[10]
§ Action: Climate energy RD&D as a share of GDP fell from 0.0052 percent in 2015 to 0.0024 percent in 2020, a decline of approximately 53 percent.
Denmark
§ Statement: “If we do not act immediately, we will not meet the Paris Agreement goal of limiting global temperature rise to 1.5°C.”[11]
§ Action: Climate energy RD&D as a share of GDP fell from 0.0617 percent in 2015 to 0.0506 percent in 2020, a decline of approximately 18 percent.
Finland
§ Statement: “Climate change is the biggest global security challenge we face.”[12]
§ Action: Climate energy RD&D as a share of GDP fell from 0.1370 percent in 2015 to 0.0758 percent in 2020, a decline of approximately 45 percent.
France
§ Statement: “It’s a strategy that will rely heavily on energy sobriety, on the accelerated development of renewables and solutions enabling us to do without fossil fuels in the long term, and on speeding up nuclear energy.”[13]
§ Action: Climate energy RD&D as a share of GDP rose from 0.0848 percent in 2015 to 0.0943 percent in 2020, an increase of approximately 11 percent.
Norway
§ Statement: “To ensure a fair and just transition, we must cut emissions—not jobs. We must invest in renewables and new technology.”[14]
§ Action: Climate energy RD&D as a share of GDP fell from 0.0774 percent in 2015 to 0.0734 percent in 2020, a decline of approximately 5 percent.
South Korea
§ Statement: “That 100% renewable energy doesn’t make any sense.”[15]
§ Action: Climate energy RD&D as a share of GDP barely rose from 0.0541 percent in 2015 to 0.0548 percent in 2020, an increase of approximately 1 percent.
Spain
§ Statement: Speaking to the Guardian before this year’s summit in Sharm El-Sheikh, [Teresa Ribera Rodríguez, Minister for the Ecological Transition of Spain] said Europe needed to be strategic, transparent and purposeful—especially in the wake of a report that found temperatures on the continent have increased at more than twice the global average in the past 30 years.[16]
§ Action: Climate energy RD&D as a share of GDP fell from 0.0154 percent in 2015 to 0.0127 percent in 2020, a decline of approximately 18 percent.
Undeterred by these failures, Mission Innovation countries in June 2021 once again promised to increase clean energy RD&D as they launched MI 2.0 to, “mobilize and connect global RD&D efforts” by setting up a technical advisory group, and by having member countries each submit national innovation pathways and participate with other members in at least one major MI initiative and the annual ministerial conference.[17] In addition, MI replaced its Innovation Challenges (which did not sufficiently represent some harder-to-decarbonize sectors) with Missions, which are new public-private innovation alliances between countries, corporations, investors, and research institutions.[18]
What Has Mission Innovation Done in Phase 2?
For MI 2.0, members promised to step up their collective ambition and cooperation by actively participating in the annual ministerial conference, strengthening international cooperation in areas of mutual interest, and reporting on the national innovation pathways.[19] Nevertheless, MI 2.0 backed off from MI 1.0’s goals, and did not specify doubling RD&D investments as before. It only recognized the International Energy Agency’s (IEA’s) assessment that “at least USD $90 billion of public funding is needed by 2026 to demonstrate the technologies necessary to decarbonize global energy systems by 2050.”[20] Two years into MI 2.0, most MI member countries are still woefully underinvesting in clean energy RD&D.
Changes in Public RD&D From MI 1.0 to MI 2.0
Among MI member countries reporting to the International Energy Agency (or in the case of the United States, the U.S. Energy Information Administration), clean energy public RD&D totaled $27 billion in 2021, while 2022 data is still too incomplete to give a meaningful total. (See table 3 in the second appendix.) This data does not include figures for China, India, Morocco, Saudi Arabia, or the UAE, which have not reported during MI1.0 or MI2.0, nor does it include Brazil or Italy since 2020.
Notably:
▪ Chile, Australia, and the EU were underinvesting significantly in clean energy RD&D relative to GDP compared to other members at both the end period of MI 1.0 and in 2021/2022. (See figure 7.)
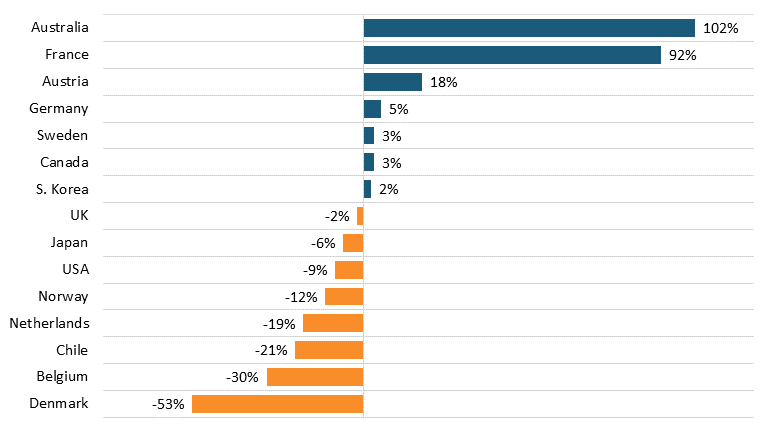
▪ Chile, Denmark, Finland, Norway, and Spain all saw clean energy public RD&D fall as a share of GDP between 2020 and 2021/2022. (See figure 8 and figure 9.)
▪ The United States alone accounted for around 37 percent of clean energy RD&D spending in 2022. (See table 3 in the appendix.)
Figure 5: Reported change in clean energy public RD&D investment, 2020–21 in 2022 PPP
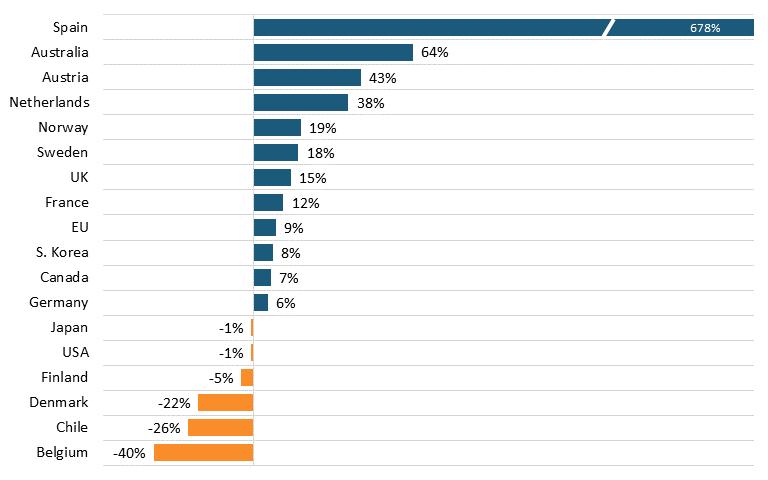
Figure 6: Reported change in clean energy public RD&D investment, 2020–22 in 2022 PPP
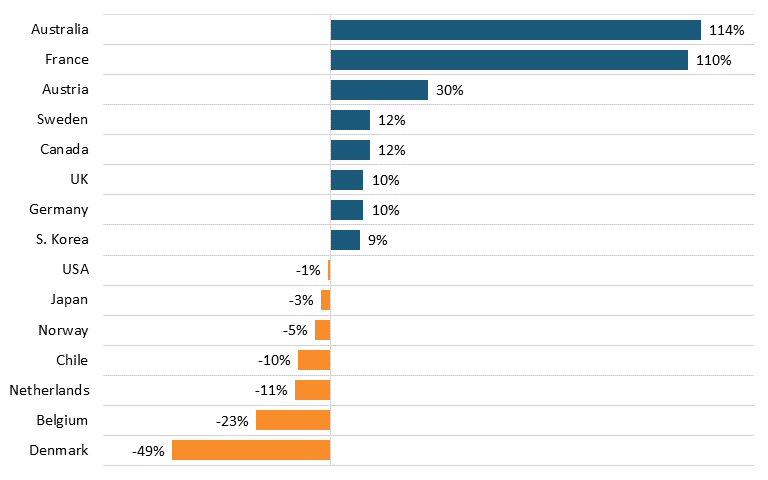
Figure 7: Clean energy public RD&D investment as a share of GDP since MI 1.0
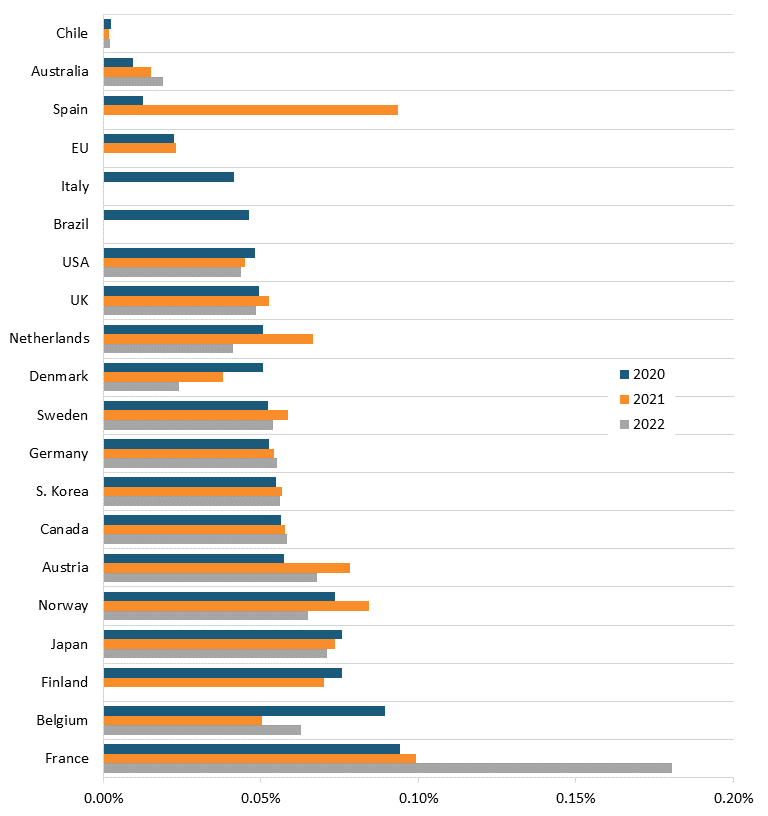
Figure 8: Change in clean energy public RD&D investment as a share of GDP, 2020–21
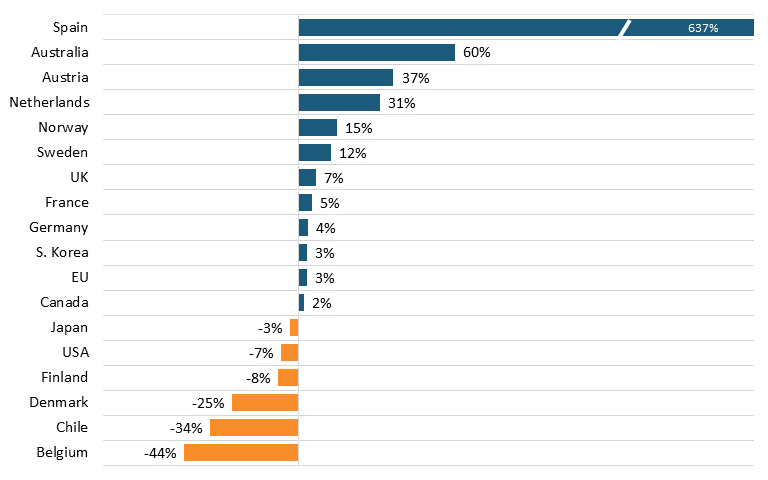
Figure 9: Change in clean energy public RD&D investment as a share of GDP, 2020–22
Conclusion
Most Mission Innovation member countries are failing to deliver on the RD&D commitments they made in COP26. If Mission Innovation is to regain credibility, it must impose two new conditions upon its members:
1. They must report reasonably accurate, timely, and transparent data.
2. They must increase clean energy RD&D at least twice as fast as GDP growth until they achieve funding levels equal to 0.1 percent of GDP.
Nations that refuse to do this should not be allowed to be members. Mission Innovation needs to put real resources behind its promises. Otherwise, the grandiose aspirations to achieve net zero emissions by 2050 will be just that: goals that remain unmet.
Appendix 1: Mission Innovation 1.0
Table 1: Investment in clean energy public RD&D during MI 1.0 ($US millions, 2022 PPP)[21]
|
Country |
2015 |
2020 |
Change 2015–20 |
|
Australia |
$182 |
$140 |
-23% |
|
Austria |
$196 |
$222 |
13% |
|
Belgium |
$253 |
$419 |
66% |
|
Brazil |
$754 |
$811 |
8% |
|
Canada |
$583 |
$907 |
56% |
|
Chile |
$13 |
$6 |
-52% |
|
Denmark |
$187 |
$165 |
-12% |
|
EU |
$2,219 |
$3,100 |
40% |
|
Finland |
$321 |
$189 |
-41% |
|
France |
$2,069 |
$2,275 |
10% |
|
Germany |
$1,442 |
$1,815 |
26% |
|
Italy |
$707 |
$724 |
2% |
|
Japan |
$2,874 |
$3,311 |
15% |
|
Netherlands |
$265 |
$409 |
54% |
|
Norway |
$300 |
$297 |
-1% |
|
S. Korea |
$794 |
$891 |
12% |
|
Spain |
$185 |
$149 |
-19% |
|
Sweden |
$234 |
$281 |
20% |
|
UK |
$652 |
$1,390 |
113% |
|
US |
$6,854 |
$9,297 |
36% |
|
Totals |
$21,083 |
$26,798 |
16% |
Table 2: Investment in clean energy public RD&D as a share of GDP during MI 1.0[22]
|
Country |
2015 |
2020 |
2015 Rank |
2020 Rank |
Change 2015–20 |
|
Australia |
0.0135% |
0.0094% |
19 |
19 |
-30% |
|
Austria |
0.0513% |
0.0573% |
8 |
6 |
12% |
|
Belgium |
0.0548% |
0.0894% |
6 |
2 |
63% |
|
Brazil |
0.0419% |
0.0461% |
11 |
15 |
10% |
|
Canada |
0.0374% |
0.0563% |
14 |
7 |
50% |
|
Chile |
0.0052% |
0.0024% |
20 |
20 |
-53% |
|
Denmark |
0.0617% |
0.0506% |
5 |
11 |
-18% |
|
EU |
0.0164% |
0.0223% |
17 |
17 |
36% |
|
Finland |
0.1370% |
0.0758% |
1 |
3 |
-45% |
|
France |
0.0848% |
0.0943% |
2 |
1 |
11% |
|
Germany |
0.0429% |
0.0524% |
10 |
9 |
22% |
|
Italy |
0.0385% |
0.0415% |
12 |
16 |
8% |
|
Japan |
0.0647% |
0.0758% |
4 |
4 |
17% |
|
Netherlands |
0.0346% |
0.0506% |
15 |
12 |
46% |
|
Norway |
0.0774% |
0.0734% |
3 |
5 |
-5% |
|
S. Korea |
0.0541% |
0.0548% |
7 |
8 |
1% |
|
Spain |
0.0154% |
0.0127% |
18 |
18 |
-18% |
|
Sweden |
0.0462% |
0.0522% |
9 |
10 |
13% |
|
UK |
0.0222% |
0.0492% |
16 |
13 |
121% |
|
USA |
0.0376% |
0.0480% |
13 |
14 |
27% |
|
Averages |
0.0469% |
0.0507% |
14% |
Appendix 2: Mission Innovation 2.0
Table 3: Investment in clean energy public RD&D since MI 1.0 (US $millions, 2022 PPP)[23]
|
Country |
2020 |
2021 |
2022 |
2020 Rank |
2021 Rank |
2022 Rank |
Change 2020–21 |
Change 2020–22 |
|
Australia |
$140 |
$229 |
$300 |
19 |
15 |
11 |
64% |
114% |
|
Austria |
$222 |
$317 |
$288 |
15 |
13 |
12 |
43% |
30% |
|
Belgium |
$419 |
$250 |
$323 |
11 |
14 |
9 |
-40% |
-23% |
|
Brazil |
$811 |
... |
... |
9 |
... |
... |
... |
... |
|
Canada |
$907 |
$974 |
$1,017 |
7 |
8 |
6 |
7% |
12% |
|
Chile |
$6 |
$4 |
$5 |
20 |
18 |
15 |
-26% |
-10% |
|
Denmark |
$165 |
$129 |
$85 |
17 |
17 |
14 |
-22% |
-49% |
|
EU |
$3,100 |
$3,376 |
... |
3 |
2 |
... |
9% |
... |
|
Finland |
$189 |
$179 |
... |
16 |
16 |
... |
-5% |
... |
|
France |
$2,275 |
$2,553 |
$4,773 |
4 |
4 |
2 |
12% |
110% |
|
Germany |
$1,815 |
$1,930 |
$1,996 |
5 |
5 |
4 |
6% |
10% |
|
Italy |
$724 |
... |
... |
10 |
... |
... |
... |
... |
|
Japan |
$3,311 |
$3,277 |
$3,204 |
2 |
3 |
3 |
-1% |
-3% |
|
Netherlands |
$409 |
$563 |
$365 |
12 |
10 |
8 |
38% |
-11% |
|
Norway |
$297 |
$355 |
$282 |
13 |
11 |
13 |
19% |
-5% |
|
S. Korea |
$891 |
$958 |
$972 |
8 |
9 |
7 |
8% |
9% |
|
Spain |
$149 |
$1,157 |
... |
18 |
7 |
... |
678% |
... |
|
Sweden |
$281 |
$332 |
$314 |
14 |
12 |
10 |
18% |
12% |
|
UK |
$1,390 |
$1,593 |
$1,527 |
6 |
6 |
5 |
15% |
10% |
|
USA |
$9,297 |
$9,190 |
$9,174 |
1 |
1 |
1 |
-1% |
-1% |
Table 4: Investment in clean energy public RD&D as a share of GDP since MI 1.0[24]
|
Country |
2020 |
2021 |
2022 |
2020 Rank |
2021 Rank |
2022 Rank |
Change 2020–21 |
Change 2020–22 |
|
Australia |
0.009% |
0.015% |
0.019% |
19 |
17 |
14 |
60% |
102% |
|
Austria |
0.057% |
0.078% |
0.068% |
6 |
4 |
3 |
37% |
18% |
|
Belgium |
0.089% |
0.050% |
0.063% |
2 |
13 |
5 |
-44% |
-30% |
|
Brazil |
0.046% |
... |
... |
15 |
... |
... |
... |
... |
|
Canada |
0.056% |
0.058% |
0.058% |
7 |
9 |
6 |
2% |
3% |
|
Chile |
0.002% |
0.002% |
0.002% |
20 |
18 |
15 |
-34% |
-21% |
|
Denmark |
0.051% |
0.038% |
0.024% |
11 |
15 |
13 |
-25% |
-53% |
|
EU |
0.022% |
0.023% |
... |
17 |
16 |
... |
3% |
... |
|
Finland |
0.076% |
0.070% |
... |
3 |
6 |
... |
-8% |
... |
|
France |
0.094% |
0.099% |
0.181% |
1 |
1 |
1 |
5% |
92% |
|
Germany |
0.052% |
0.054% |
0.055% |
9 |
11 |
8 |
4% |
5% |
|
Italy |
0.041% |
... |
... |
16 |
... |
... |
... |
... |
|
Japan |
0.076% |
0.073% |
0.071% |
4 |
5 |
2 |
-3% |
-6% |
|
Netherlands |
0.051% |
0.066% |
0.041% |
12 |
7 |
12 |
31% |
-19% |
|
Norway |
0.073% |
0.084% |
0.065% |
5 |
3 |
4 |
15% |
-12% |
|
S. Korea |
0.055% |
0.057% |
0.056% |
8 |
10 |
7 |
3% |
2% |
|
Spain |
0.013% |
0.093% |
... |
18 |
2 |
... |
637% |
... |
|
Sweden |
0.052% |
0.059% |
0.054% |
10 |
8 |
9 |
12% |
3% |
|
UK |
0.049% |
0.052% |
0.048% |
13 |
12 |
10 |
7% |
-2% |
|
USA |
0.048% |
0.045% |
0.044% |
14 |
14 |
11 |
-7% |
-9% |
About the Author
Dr. Robert D. Atkinson (@RobAtkinsonITIF) is the founder and president of ITIF. His books include Big Is Beautiful: Debunking the Myth of Small Business (MIT, 2018), Innovation Economics: The Race for Global Advantage (Yale, 2012), Supply-Side Follies: Why Conservative Economics Fails, Liberal Economics Falters, and Innovation Economics Is the Answer (Rowman Littlefield, 2007), and The Past and Future of America’s Economy: Long Waves of Innovation That Power Cycles of Growth (Edward Elgar, 2005). He holds a Ph.D. in city and regional planning from the University of North Carolina, Chapel Hill.
About ITIF
The Information Technology and Innovation Foundation (ITIF) is an independent 501(c)(3) nonprofit, nonpartisan research and educational institute that has been recognized repeatedly as the world’s leading think tank for science and technology policy. Its mission is to formulate, evaluate, and promote policy solutions that accelerate innovation and boost productivity to spur growth, opportunity, and progress. For more information, visit itif.org/about.
Endnotes
[1]. These members were: Australia, Austria, Brazil, Canada, Chile, China, Denmark , European Union, Finland, France, Germany, India, Italy, Japan, Morocco, Netherlands, Norway, Saudi Arabia, South Korea, Spain, Sweden, United Arab Emirates, United Kingdom, United States. Mission Innovation (MI), http://mission-innovation.net/.
[2]. MI Joint Launch Statement, November 2015, http://www.mission-innovation.net/wp-content/uploads/2015/11/Mission-Innovation-Joint-Launch-Statement.pdf.
[3]. Hoyu Chong, “Mission Critical: The Global Energy Innovation System Is Not Thriving” (ITIF, January 2022), https://itif.org/publications/2022/01/10/mission-critical-global-energy-innovation-system-not-thriving/. Annual public RD&D spending data is only available on nineteen of those members, and not China, India, Morocco, Saudi Arabia, or the UAE. Moreover, the United States stopped reporting to the International Energy Agency after 2015, although some information is available through the United States Energy Information Administration here: https://www.eia.gov/analysis/requests/subsidy/pdf/subsidy.pdf#page=28.
[4]. Robin Gaster, Robert D. Atkinson, and Ed Rightor, “Beyond Force: A Realist Pathway through the Green Transition” (ITIF, July 2023), https://itif.org/publications/2023/07/10/beyond-force-a-realist-pathway-through-the-green-transition/.
[5]. MI Joint Launch Statement, November 2015.
[6]. Colin Cunliff, “Omission Innovation: The Missing Element in Most Countries’ Response to Climate Change” (ITIF, December 2018), https://itif.org/publications/2018/12/10/omission-innovation-missing-element-most-countries-response-climate-change/.
[7]. “MI’s First Phase,” http://mission-innovation.net/about-mi/first-phase/
[8]. National Statement to COP27, November 15, 2022, https://minister.dcceew.gov.au/bowen/speeches/national-statement-cop27.
[9]. Kate Abnett, “COP27: Austria commits $50 mln for climate ‘loss and damage’,” Reuters, November 8, 2022, https://www.reuters.com/business/cop/cop27-austria-commits-50-mln-climate-loss-damage-2022-11-08.
[10]. “Chile progresses with climate goals ahead of Cop 27,” Argus, October 26, 2022, https://www.argusmedia.com/en/news/2384480-chile-progresses-with-climate-goals-ahead-of-cop-27.
[11]. “Denmark at COP26,” statement by Prime Minister Mette Frederiksen, https://denmark.dk/cop-26-english.
[12]. Prime Minister of Finland Sanna Marin’s statement at the United Nations Climate Change Conference in Sharm el-Sheikh on 7 November 2022, July 11, 2022, https://valtioneuvosto.fi/en/-//10616/prime-minister-of-finland-sanna-marin-s-statement-at-the-united-nations-climate-change-conference-sharm-el-sheikh-7.11.2022.
[13]. Speech delivered by the President of the Republic on the occasion of the COP27, Monday November 7th 2022 in Sharm el-Sheikh, Egypt, https://sanfrancisco.consulfrance.org/cop27-speech-by-mr-emmanuel-macron-president-of-the-republic.
[14]. Statement by Prime Minister Erna Solberg at the UN General Assembly General Debate, 22 September 2021, https://www.norway.no/en/missions/un/statements/general-assembly-plenary/2021/unga-general-debate---national-statement-of-norway/.
[15]. “How Climate Change Is Unfolding in South Korea,” Earth.org, July 27, 2023, https://earth.org/how-climate-change-is-unfolding-in-south-korea/
[16]. Sam Jones, “Spanish minister urges Sunak to commit to climate crisis fight,” The Guardian, November 3, 2022, https://www.theguardian.com/environment/2022/nov/03/absurd-debate-in-the-uk-spanish-minister-urges-rishi-sunak-to-commit-to-climate-crisis-fight
[17]. Joint Member Statement on the Launch of Mission Innovation 2.0, May 2021. http://mission-innovation.net/wp-content/uploads/2021/05/MI-2.0-Launch-Statement-FINAL.pdf.
[18]. MI, Missions, http://mission-innovation.net/missions/.
[19]. Ibid.
[20]. MI, MI-7 (Global Clean Energy Action Forum: CEM 13/MI-7), http://mission-innovation.net/events/seventh-mission-innovation-ministerial/.
[21]. International Energy Agency (IEA), Energy Technology RD&D Budgets, May 2023, https://www.iea.org/data-and-statistics/data-product/energy-technology-rd-and-d-budget-database-2. Italy’s latest submission was 2020/2021 in which the latest available data is 2019.
[22]. The World Bank Group, GDP database, https://data.worldbank.org/indicator/NY.GDP.MKTP.PP.CD; International Energy Agency (IEA), Energy Technology RD&D Budgets.
[23]. International Energy Agency (IEA), Energy Technology RD&D Budgets.
[24]. The World Bank Group, GDP database, https://data.worldbank.org/indicator/NY.GDP.MKTP.PP.CD; International Energy Agency (IEA), Energy Technology RD&D Budgets, October 2023, https://www.iea.org/data-and-statistics/data-product/energy-technology-rd-and-d-budget-database-2; IEA’s database does not include estimates of 2022 spending for Brazil, Finland, Italy, Spain, and the European Union. For these countries, 2021 is the latest year available. 2020 is the last years when estimates were available for Brazil and Italy. Mexico is not an MI member country but an observer country.
