


Closing the Gap: Priorities for the U.S. Department of Energy’s Building RD&D Portfolio
The building sector is not on track to reach net-zero emissions by 2050. Federal RD&D investments have been disproportionately low, while national strategies that address the key hurdles of decarbonizing the building sector have been lacking.
KEY TAKEAWAYS
Key Takeaways
Contents
Slow Progress in Decarbonizing the Building Sector 4
DOE’s Buildings RD&D Portfolio Is Lacking in Both Funding and Scope. 7
Limited Scope for Other Appliances 10
Near Absence of Waste Management Activities 10
Need for Life Cycle Perspective 11
Introduction
In 2021, President Biden set a national goal of net-zero greenhouse gas (GHG) emissions by 2050, signaling a new era in which the United States must step up to tackle climate change with decisive actions.[1] Clean energy innovation is central to this fight. The U.S. Department of Energy (DOE) funds the bulk of federal energy research, development, and demonstration (RD&D) programs. This briefing is the first of a series that examines how well DOE’s RD&D portfolio aligns with the president’s bold goal, which must be achieved across all emission sectors.
Residential and commercial buildings (known collectively as “the building sector”) account for an increasingly large share of U.S. GHG emissions. While total emissions have fallen, direct emissions from the building have risen. Direct emissions (not counting electricity use) from this sector accounted for 14 percent of the national total in 2019, while the sector’s total emissions were 34 percent, including indirect emissions from electricity use.
These increases have been driven particularly by the growing use of substitutes for ozone-depleting substances, which release hydrofluorocarbons (HFCs), a group of fluorinated gases that are widely used in air conditioning and refrigeration and have very high global warming potentials (GWPs). GHG emissions per unit of energy consumed in buildings have declined only marginally, indicating that efficiency levels have stagnated in the United States’ largest energy-consuming sector. Building electrification and efficiency retrofits have not progressed much, either.
The building sector, therefore, is far from being on track to reach net-zero emissions by 2050. Even more unfortunately, the current DOE buildings RD&D portfolio is not on track to help the sector change direction. Key RD&D challenges include:
▪ chronic underfunding;
▪ failure to address rising emissions of HFCs, which stem from heating, ventilating, air conditioning, and refrigerating (HVAC&R) activities;
▪ failure to cover the full scope of fossil fuel combustion emissions from appliances;
▪ lack of programs that address emissions from major waste disposal activities other than wastewater treatment, such as landfills, composting, and anaerobic digestion; and
▪ lack of a life cycle approach to embodied carbon—carbon emissions that occur before and after the operational phase of buildings.
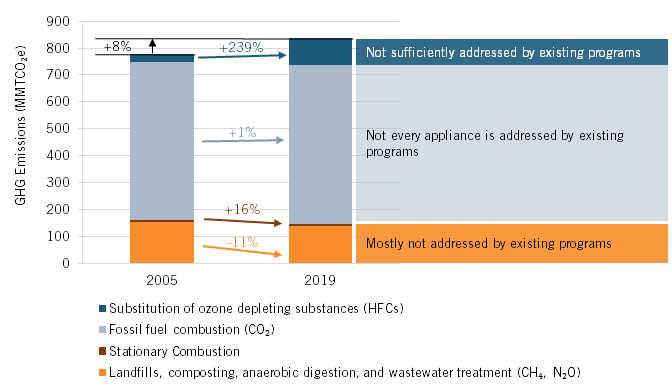
Figure 1 illustrates U.S. building-sector GHG emissions from HFCs, fossil fuel combustion, and waste disposal activities. Each segment suffers from gaps in DOE’s current RD&D effort. What figure 1 does not illustrate is the challenge that goes beyond a building’s emissions from operations to embodied carbon—emissions released up front in the manufacturing, production, and transportation of building materials as well as their demolition and disposal at end of life.
Figure 1: Greenhouse gas emissions of the building sector[2]
This brief explains why the nation needs a robust RD&D portfolio to tackle emissions from the building sector and discusses where it is falling short. It begins with an overview of the building sector’s GHG emissions and energy consumption. The subsequent section discusses DOE’s current RD&D portfolio and describes its strengths and deficiencies. The concluding section provides recommendations that address these deficiencies and would help put the building sector on a path toward net zero. To address these deficiencies:
1. the United States should significantly ramp up investment in building technologies RD&D;
2. DOE should accelerate RD&D efforts to electrify buildings, integrate them into the power grid, and retrofit them;
3. DOE should gradually aim to increase funding for GWP-free projects under its Building Technologies Office (BTO);
4. DOE should phase out RD&D that aims to advance fossil-fuel-fired appliances, expanding support for RD&D on appliances currently not covered, and improving the energy efficiency of these appliances; and
5. DOE should initiate, scope, and expand collaborative RD&D efforts across offices within DOE and between DOE and other agencies on topics not addressed by existing programs and subprograms, such as waste activities and embodied carbon.
Slow Progress in Decarbonizing the Building Sector
The residential and commercial sectors (collectively “the building sector”) account for an increasingly large share of GHG emissions, primarily driven by emissions from HFCs. Buildings represented 14 percent of total GHG emissions (31 percent including indirect emissions from electricity) in 2019.[3] While total GHG emissions fell 12 percent from 2005, GHG emissions in the building sector rose 8 percent between 2005 and 2019 (figure 1) from 776 million metric tons of carbon dioxide equivalents (MMTCO2e) to 836 MMTCO2e. Besides agriculture, the building sector is the only sector bucking the trend, underscoring the substantial challenges in decarbonizing it.
GHG emissions from the building sector come from fossil fuel combustion, stationary combustion from sources such as boilers and burners (but makes up less than 1 percent of the sector’s direct emissions), waste-related activities (including landfills, composting, anaerobic digestion, and wastewater treatment—which emit methane and nitrous oxide gases), and substitutes for ozone-depleting substances, which emit HFCs (figure 1). HFCs have very high GWP and are used in air conditioning, refrigerants, aerosols, fire suppression, foam blowing, sterilants, and solvents. While fossil fuel combustion activities, such as space and water heating, account for the largest share of buildings’ GHG emissions, emissions from HFCs are the main drivers of growth in the sector’s emissions.
The building sector is the largest energy-consuming sector in the United States, representing 39 percent of total energy consumption and 75 percent of electricity use. Excluding electricity, energy consumption per capita declined slightly (-4.5 percent), while GHG emission per unit of energy consumed declined marginally (-0.9 percent) between 2005 and 2019 (table 1). Similarly, energy consumption per square foot also declined slightly (-2.6 percent) between 2005 and 2019. These slight decreases in consumption per capita and per square foot indicate either modest energy efficiency improvements, some degree of building electrification, or both.
Table 1: Energy consumption and GHG emissions of the buildings sector[4]
|
2005 |
2019 |
Change |
|
|
Total energy consumption (trillion Btu) excluding electricity† |
10,937 |
11,893 |
8.7% |
|
Energy consumption per capita: |
|||
|
Population (thousands) |
288,378 |
328,240 |
13.8% |
|
Energy consumed per capita (million Btu) |
37.9 |
36.2 |
-4.5% |
|
Energy consumption per floor area: |
|||
|
Floor area (billion square feet) |
276.7 |
308.8 |
11.6% |
|
Energy consumed per floor area (thousand Btu) |
39.5 |
38.5 |
-2.6% |
|
GHG emission/energy consumption (MTCO2e/thousand Btu) |
71.0 |
70.3 |
-0.9% |
† Energy consumption is based on end-use sectors (transportation, industrial, commercial, and residential) whereas GHG emission is based on economic sectors, which include electricity. However, electricity is ultimately fed into the four end-use sectors. Therefore, when comparing end-use energy consumption and emissions, electricity consumption and electrical system energy losses are excluded. Emissions from electricity generation will be discussed separately (forthcoming).
Table 2: Change in energy consumption by fuel and activity (quadrillion Btu) from 2005 to 2021, the building sector[5]
|
Activity/Appliance |
Electricity |
Fossil fuel sources† |
Total |
|
Space Heating |
0.25 |
0.15 |
0.40 |
|
Space Cooling |
0.04 |
0.06 |
0.10 |
|
Water Heating |
0.07 |
-0.22 |
-0.15 |
|
Refrigeration†† |
0.32 |
-- |
0.32 |
|
Ventilation†† |
0.31 |
-- |
0.31 |
|
Cooking |
-0.01 |
-0.01 |
-0.02 |
|
Clothes Dryers |
-0.03 |
-0.03 |
-0.06 |
|
Lighting†† |
-1.20 |
-- |
-1.20 |
|
Other Uses††† |
1.03 |
-0.30 |
0.74 |
|
Total |
0.80 |
-0.34 |
0.45 |
† Fossil fuel sources include natural gas, distillate fuel oil, and propane.
†† These activities are powered by electricity only. The increase in electricity consumption from refrigeration and ventilation is due to an increase in demand while the decrease in electricity consumption from lighting is the result of increased adoption of energy-efficient light-emitting diodes (LED) products, which led to a saving of about 5 percent of total electricity use from buildings in 2018 according to a recent DOE study.[6]
††† Other uses include freezers, clothes washers, dishwashers, televisions and related equipment, computers and related equipment, furnace fans and boiler circulation pumps, computer, office equipment; electric and electronic devices, heating elements, and motors; appliances such as outdoor grills, natural gas-fueled lights, pool heaters, spa heaters, and backup electricity generators; transformers, medical imaging and other medical equipment, elevators, escalators, off-road electric vehicles, laboratory fume hoods, laundry equipment, coffee brewers, and water services; emergency generators, combined heat and power in commercial buildings, and manufacturing performed in commercial buildings.
Table 2 shows that from 2005 to 2021, consumption of fossil fuels in the building sector declined slightly while electricity use increased, implying that building electrification is slowly occurring. Space heating and water heating are the major activities that consume fossil fuels, followed by space cooling, cooking, and using clothes dryers. However, space cooling is likely to become an increasingly important determinant of the building sector’s future emissions profile as temperatures warm because of climate change.
Further evidence of the slow pace of building electrification is the stagnant share of electricity in end-use energy consumption in the building sector, which hovered around 23–24 percent between 2005 and 2019.[7] Efforts to accelerate building electrification should focus on space heating, space cooling, and water heating. Space heating was responsible for 65 percent of the sector’s fossil fuel energy consumption in 2021 (up from 61 percent in 2005). Space heating from fossil fuel energy actually grew in commercial buildings (+0.48 quadrillion Btu between 2005 and 2021), outpacing the projections of the U.S. Energy Information Administration (EIA), even as it declined in residential buildings (-0.32 quadrillion Btu) during the same period.[8] Lighting is the one bright spot: The development and commercialization of light-emitting diode (LED) and organic light-emitting diode (OLED) lighting technologies reduced electricity consumption by 62 percent (1.2 quadrillion Btu) from 2005 to 2021.
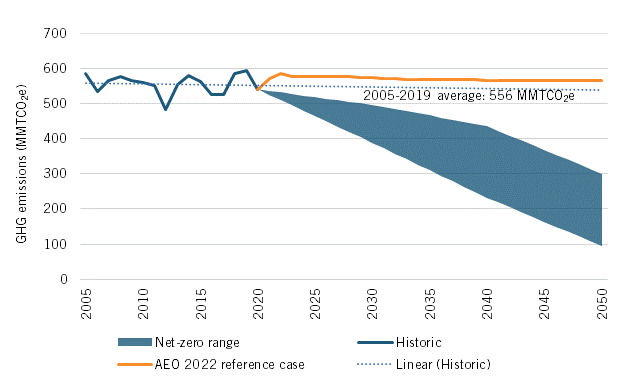
These trends—increasing emissions (figure 1), modest efficiency gains (table 1), increasing energy consumption, and slow electrification (table 2)—mean the buildings sector is far from on track to reach net zero by 2050. Carbon dioxide (CO2) emissions from fossil fuel combustion in buildings flatlined between 2005 and 2019 (averaging 555 MMTCO2e). The U.S. Long Term Strategy to reach net zero calls for this figure to fall to between 95 MMTCO2e and 300 MMTCO2e (figure 2). The only way to approach this goal is to electrify the major end uses while simultaneously reducing carbon emissions from the electric grid. Yet, the 2022 Annual Energy Outlook (AEO) forecast, which already assumes improvements in known energy production, delivery, and consumption technologies, projects a flattening trend that ends at slightly above the 2005–2019 historical average level (555 MMTCO2e) by 2050 (564 MMTCO2e) in the reference case.[9]
Figure 2: Direct CO2 emissions from energy-related (fossil fuel combustion) activities, historical, net-zero range, and reference case forecast[10]
To increase and accelerate building electrification, DOE should phase out RD&D on fossil-fuel-fired appliances and prioritize RD&D investments in technologies such as thermal energy storage that foster integration of renewables into the grid and building retrofits by supporting cross-office collaboration. Meanwhile, expanding investment in advanced airflow, air sealing, ventilation controls, and high-performance windows would improve building energy efficiency and reduce fossil fuel energy consumption for space heating, cooling, and ventilation.
Finally, the department has neglected mitigation strategies for GHGs other than CO2 (e.g., HFCs, methane, and nitrous oxide.) The U.S. Long-Term Strategy acknowledges these challenges and assumes only modest technological and cost improvements over time. Achieving more significant long-term emission reductions will require major technological advances and new—or more effective—backstop mitigation options.
DOE’s Buildings RD&D Portfolio Is Lacking in Both Funding and Scope
DOE’s BTO oversees innovations in technologies such as building envelopes, HVAC&R, thermal energy storage, lighting, appliances, and equipment. As it undergoes a substantial shift in strategic direction to align with the goal of net-zero emissions by 2050 set forth by the Biden administration, BTO must address chronic underfunding, failure to sufficiently address emissions from building operations, and a lack of focus on embodied carbon.
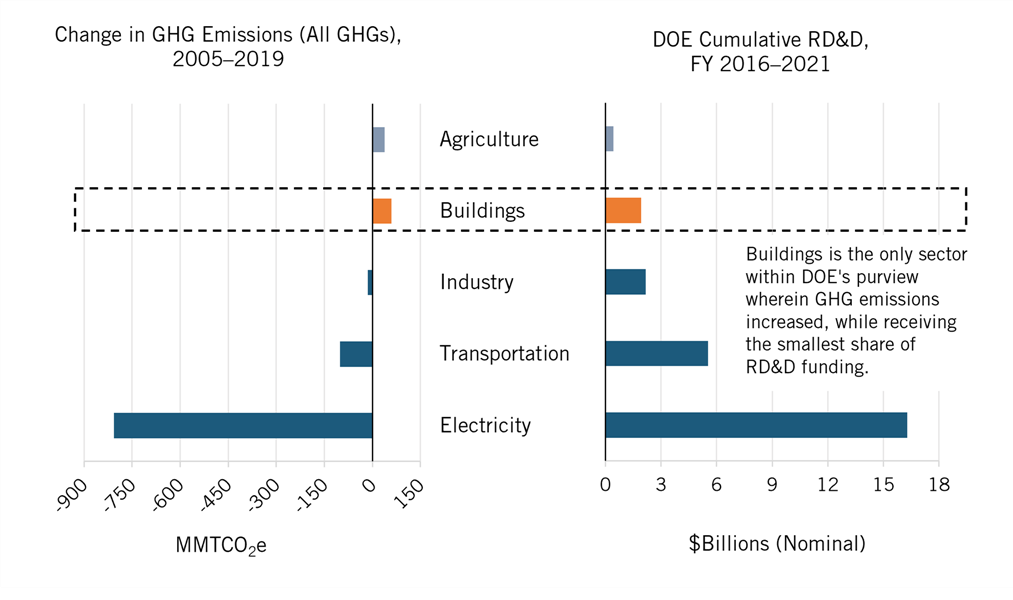
Figure 3: Change in GHG emissions (2005 to 2019) and DOE cumulative RD&D investments (FY2016 to FY2021) in the building sector[11]
Chronic Underfunding
Relative to technologies for other sectors, RD&D investments in building technologies (mostly by BTO) have been disproportionately low given the sector’s contribution to GHGs. The building sector is the only sector within DOE’s purview in which GHG emissions increased from 2005 to 2019, yet it received the smallest share of RD&D funding (figure 3.) Historically, the building sector receives 7 percent of DOE’s RD&D investments, even though the sector makes up 14 percent of GHG emissions. Furthermore, of the nine offices within the Office of Energy Efficiency and Renewable Energy (EERE), BTO is one of only two that did not receive RD&D-related funding from the Infrastructure Investment and Jobs Act (IIJA).
Unfortunately, the final FY 2022 and the proposed FY 2023 budget will not change the situation. BTO’s enacted RD&D budget for FY 2022 is $250 million, which represents just 7 percent of EERE’s RD&D programs (this excludes the Equipment and Building Standards subprogram, as it is not considered to be RD&D). In addition, it also grew by only $14.5 million compared with FY 2021—lower than other offices in EERE except for the Bioenergy Technologies Office (table 3). Similarly, BTO received one of the smallest funding increases in the administration’s proposal for FY 2023, just $82 millionover FY 2021.
Table 3: DOE Energy RD&D programs summary, EERE, FY 2021 enacted through FY 2023 President’s Budget request, in millions of dollars[12]
|
EERE Office |
FY21 Enacted |
FY22 Final |
FY23 WH |
FY21 vs. FY22 Change |
FY22 vs. FY23 Change |
FY21 vs. FY23 % Change |
|
Sustainable Transportation |
805 |
839.5 |
1,128.7 |
34.5 |
323.7 |
40% |
|
Vehicle Technologies (VTO) |
400 |
420.0 |
602.7 |
20.0 |
202.7 |
51% |
|
Bioenergy Technologies (BETO) |
255 |
262.0 |
340.0 |
7.0 |
85.0 |
33% |
|
Hydrogen & Fuel Cell Tech (HFTO) |
150 |
157.5 |
186.0 |
7.5 |
36.0 |
24% |
|
Renewable Energy |
646 |
715.5 |
1,272.5 |
29.5 |
626.5 |
97% |
|
Solar Energy (SETO) |
280 |
290.0 |
534.6 |
10.0 |
254.6 |
91% |
|
Wind Energy (WETO) |
110 |
114.0 |
345.4 |
4.0 |
235.4 |
214% |
|
Water Power (WPTO) |
150 |
162.0 |
190.5 |
12.0 |
40.5 |
27% |
|
Geothermal (GTO) |
106 |
109.5 |
202.0 |
3.5 |
96.0 |
91% |
|
Energy Efficiency |
586 |
665.5 |
845.0 |
79.5 |
259.0 |
44% |
|
Advanced Manufacturing (AMO) |
351 |
416.0 |
528.0 |
65.0 |
177.0 |
50% |
|
Building Technologies (BTO) |
235 |
249.5 |
317.0 |
14.5 |
82.0 |
35% |
Furthermore, while most EERE offices received some to a substantial amount of IIJA funding for RD&D activities such as renewable energy RD&D and clean hydrogen electrolysis, BTO received no IIJA funding for RD&D purposes (funding for BTO is for building energy codes implementation [Sec. 40511. Cost-effective Codes Implementation for Efficiency and Resilience]).
Gaps in HVAC&R Technologies
DOE’s proposed budget for FY 2023 represents a notable departure from the recent past. In addition to focusing on energy intensity reduction, DOE added GHG emission reductions and cross-cutting initiatives to BTO’s office-wide priorities. However, attaining these new goals requires swift actions that can be easily undermined, especially if RD&D investments in the building sector continue to be underfunded.
BTO has identified innovation in HVAC&R and lower-GWP refrigerant technologies as one of its main goals. Common refrigerants used in residential and commercial HVAC&R systems (e.g., r-32 and r-410A), which release HFCs, have a far more potent climate impact than does CO2. Their GWP, a measure of how much energy the emissions of one ton of a gas will absorb over a given period, can be thousands of times that of CO2 over a 100-year horizon, as table 4 shows. The shift in BTO’s RD&D agenda revives and extends a prior effort during the Obama administration to move beyond energy efficiency.[13] The earlier work brought refrigerant GWPs down somewhat, but future work to push toward even lower levels is of the utmost importance and deserves unwavering support.
Table 4: Commonly used refrigerants and select lower-GWP alternatives to r-22 and r-410A refrigerants evaluated[14]
|
Refrigerant |
Commercial or Common Name |
GWP (100-yr Horizon, AR4 Values) |
|
Commonly Used Refrigerants |
||
|
r-22† |
Freon |
1,810 |
|
r-32†† |
(by Daikin) |
675 |
|
r-134A |
1,430 |
|
|
r-404A |
3,922 |
|
|
r-407C |
1,774 |
|
|
r-410A |
Puron |
2,088 |
|
r-454B |
Puron Advance |
465 |
|
r-466A |
Solstice N41 |
734 |
|
Select Lower-GWP (GWP <300) Alternatives Evaluated in Previous RD&D Projects |
||
|
r-290 |
Propane |
3 |
|
r-444B |
(by Honeywell) |
295 |
|
r-454A |
(by Chemours) |
239 |
|
CO2 |
1 |
|
|
DR-3 |
148 |
|
|
ARM-20B |
(by Arkema) |
251 |
† R-22 refrigerant (Freon) is a hydrochlorofluorocarbon (HCFC), which depletes the ozone layer. The EPA has phased out r-22 along with r-142B in January 2020. The most common alternative to r-22 is r-410A, a non-ozone-depleting HFC.[15]
†† R-32 refrigerant is the only alternative to r-410A refrigerant evaluated in past DOE RD&D projects that have both better coefficient of performance (COP) and cooling capacity than r-410A. Subsequently, r-32 has become an increasingly commonly used refrigerant since 2015.
Limited Scope for Other Appliances
Outside of HVAC&R technologies and heat pumps, water heating and cooking are the next-largest fossil fuel consuming activities in the building sector. BTO proposed to phase down RD&D on these gas-fired appliances, which is another step in the right direction. It is vital that this initiative extend beyond HVAC&R to water heaters, cooking equipment, as well as other appliances such as clothes dryers, which collectively consumed 11.7 percent of energy from fossil fuel sources in 2021. But so far, only a few RD&D projects on water heaters and clothes dryers have been conducted relative to HVAC&R, while no RD&D projects exist for cooking equipment and other appliances.
Water Heaters
Water heating accounted for about 17.7 percent of all building site fossil fuel energy use in 2021, down from 19.3 percent in 2005. Although overall energy consumption by water heaters decreased (table 2), gas-fired water heaters (1.72 quadrillion Btu in 2021) still consume significantly more energy than do electric ones (0.63 quadrillion Btu in 2021). DOE’s FY 2023 Congressional Budget Justification repeatedly emphasizes RD&D on heat-pump water heaters as a priority, and its recent projects at BTO have focused on them.[16] This thrust should be complemented by additional RD&D on water heater energy conservation and efficiency improvements, with potential focus areas including smart controls and waste heat recovery. Finally, although air-to-water heat pumps, which extract heat from the air and use it to heat water, are commercially available, integrated air-to-water heat pumps with storage for heating and cooling are only in the early prototype stage.[17] As the transition to building electrification takes place, integrated storage to the grid will become more essential.
Cooking Equipment
Cooking is the next-largest energy consuming activity after HVAC&R activities and water heating, accounting for about 5 percent of all building site fossil fuel energy use in 2021. Cooking consumes about three times as much fossil fuel (0.46 quadrillion Btu) as it does electricity (0.14 quadrillion Btu). Yet, BTO has no RD&D projects on cooking appliances.[18] Low-carbon cooking appliances such as induction cooktops are widely available and cost-competitive for household kitchens, but the situation is far less promising when it comes to larger-scale equipment (e.g., fryers, griddles, ovens, and broilers) for commercial kitchen operations. DOE’s Better Building Challenge recently launched the Better Buildings Low Carbon Pilot (jointly with The Wendy’s Company) that seeks innovative ways to reduce the energy and emissions intensity of commercial kitchens.[19] Future RD&D efforts should focus on cost reduction and smart designs in this product segment.
Other Appliances
Finally, there have been no RD&D projects on other appliance technologies (see “Other Uses” in table 2), yet these collectively consumed 1.1 quadrillion Btu in fossil fuel energy (11 percent) in 2021. Although focusing on an exhaustive list of appliances may be infeasible, EIA’s energy consumption survey data suggests clothes dryers, outdoor grills, pool heaters, spa heaters, and backup electricity generators are the next-largest energy consuming appliances.[20]
Near Absence of Waste Management Activities
While it may not be intuitive, GHG accounting classifies waste management and treatment activities, which release methane and nitrous oxide, within the building sector. This important set of sources lies outside BTO’s purview. As a result, DOE has few programs pursuing climate solutions for that which accounted for one-sixth of the building sector’s emissions in 2019. Indeed, after falling for decades, emissions from municipal landfills (which alone comprised 12 percent of the sector’s GHG emissions in 2019), started to increase in 2016. Meanwhile, GHG emissions from wastewater treatment—the next-largest category—have stayed level. Overall, emissions from waste activities rose 4 percent from 2016 to 2019.
Congress should significantly expand RD&D funding on water and wastewater treatment plant energy efficiency technologies and allot additional funding, based on joint findings and recommendations from DOE and the U.S. Environmental Protection Agency (EPA), on technologies that prevent, mitigate, and capture emissions from landfills. So far, modest funding ($20 million annually nominally, not adjusted for inflation) supports RD&D on water and wastewater treatment plant energy efficiency technologies, and no comparable investments exist to tackle landfill emissions. The FY 2022 budget directs DOE, through EERE and the Office of Fossil Energy and Carbon Management (FECM) and in coordination with EPA, to describe the opportunities and challenges for technologies that capture—and recommendations for better utilizing and preventing—GHGs from municipal landfills.[21]
Need for Life Cycle Perspective
So far, the discussion of the RD&D portfolio and challenges in addressing the building sector’s emissions has been limited to its operational phase. Beyond these recurring activities that generate emissions, RD&D efforts to address embodied carbon (figure 4)—the carbon released up front in the manufacturing, production, and transportation of building materials as well as their demolition and disposal at end of life—have received relatively little support. Yet, embodied carbon comprises at least one-fourth of a building’s life cycle carbon footprint.[22]
Figure 4: Life cycle GHG emissions of buildings[23]
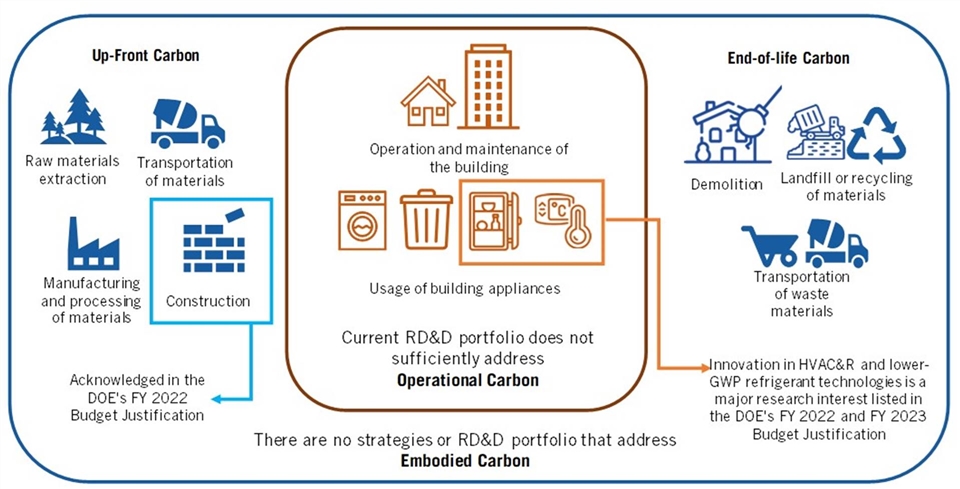
There are no federal directives on embodied carbon RD&D, and no mention of the subject was made in the final FY 2022 budget or the president’s FY 2023 proposal. The few RD&D projects studying the topic focus primarily on up-front carbon. For example, Advanced Research Projects Agency–Energy (ARPA-E) recently awarded two projects (on a parametric life cycle assessment framework and on carbon-negative materials assessment) under its new Harnessing Emissions into Structures Taking Inputs from the Atmosphere (HESTIA) Exploratory Topic.[24] Outside DOE, the U.S. Army Corp of Engineers (USACE) has been conducting RD&D on cement alternatives. Its Research and Development Center (ERDC) has been researching solutions for alternative cementitious materials.[25] These observations suggest an urgent need for both Congress and the White House to promote and increase the awareness of embodied carbon as well as expand development of a coherent, coordinated, and comprehensive portfolio that seeks solutions to embodied carbon across the building life cycle.
Recommendations
The United States does not have a robust RD&D portfolio to combat emissions from the building sector. The sector is underfunded, which impedes DOE’s ability to execute a strategic pivot. This is likely leading the building sector to underperform in emissions reductions relative to the economy generally. Existing RD&D programs and subprograms exclude a considerable portion of the building sector’s GHG emissions. Here are five key recommendations for DOE to tackle the building sector’s emissions:
1. The U.S. government should significantly ramp up investment in building technologies RD&D. Energizing America recommends a 200 percent increase by FY 2026 relative to FY2020 for the Building Technologies Office.[26] However, this recommendation does not include RD&D investments that would target emissions from waste disposal activities (especially landfill emissions) and embodied carbon, which are virtually nonexistent. The federal government should appropriate at least $300 million, in additional annual investment on top of Energizing America’s FY 2026 recommendation, to fully tackle GHG emissions in the building sector.
2. DOE should accelerate RD&D efforts to electrify buildings, integrate them into the power grid, and retrofit them by:
a. ensuring collaboration among offices such as BTO, the Solar Energy Technologies Office (SETO), and Office of Electricity (OE) for building electrification and renewables integration;
b. supporting RD&D on innovative techniques that enable faster, affordable, and scalable retrofit solutions; and
c. expanding investment in advanced airflow, air sealing, ventilation controls, and high-performance windows to improve building energy efficiency.
3. To effectively address emissions from building appliances, BTO should gradually aim to increase funding for GWP-free projects including:
a. focusing on zero-emission alternatives to HFCs;
b. supporting the development of refrigerant-free air conditioning technologies such as solid-state cooling;
c. investing in advanced heat pumps such as cascading systems, geothermal systems, and nonvapor compression cycles that would improve performance, efficiency, and initial costs; and[27]
d. fostering collaboration, including with EPA on alternatives to HFCs and with DOE's Geothermal Technologies Office (GTO) on geothermal heat pumps.
4. DOE should phase out RD&D that aims to advance fossil-fuel-fired appliances while expanding support for RD&D on cooking appliances, outdoor grills, pool heaters, spa heaters, backup electricity generators, and other appliances. In addition, DOE should include RD&D that would improve the energy efficiency of these appliances.
5. DOE should initiate, scope, and expand collaborative RD&D efforts across offices within DOE and between DOE and other agencies, such as EPA and state and regional collaboratives, on topics not addressed by existing programs and subprograms, such as waste activities and embodied carbon. In particular, DOE should implement the existing directive to collaborate with EPA on reducing emissions from landfills such as capturing and reusing renewable natural gas.
Acknowledgments
The author wishes to thank David Hart, Rob Atkinson, Dorothy Robyn, and Stefan Koester for providing input to this report. Any errors or omissions are the author’s alone.
About the Author
Hoyu Chong is a senior policy analyst for clean energy innovation at the Information Technology and Innovation Foundation. Prior to joining ITIF, she worked as a practice area lead for Beacon Economics, focusing on clean energy, sustainability, and development. She holds a master’s degree in economics from the University of Southern California.
About ITIF
The Information Technology and Innovation Foundation (ITIF) is an independent, nonprofit, nonpartisan research and educational institute focusing on the intersection of technological innovation and public policy. Recognized by its peers in the think tank community as the global center of excellence for science and technology policy, ITIF’s mission is to formulate and promote policy solutions that accelerate innovation and boost productivity to spur growth, opportunity, and progress.
For more information, visit itif.org.
Endnotes
[1]. U.S. Department of State and the Executive Office of the President, “The Long-Term Strategy of the United States: Pathways to Net-Zero Greenhouse Gas Emissions by 2050” (November 2021), https://www.whitehouse.gov/wp-content/uploads/2021/10/US-Long-Term-Strategy.pdf.
[2]. U.S. Environmental Protection Agency (EPA), “US EPA Inventory of U.S. Greenhouse Gas Emissions and Sinks: 1990–2020,” https://www.epa.gov/ghgemissions/inventory-us-greenhouse-gas-emissions-and-sinks-1990-2020.
[3]. EPA, Inventory of U.S. Greenhouse Gas Emissions and Sinks: 1990–2020, https://www.epa.gov/ghgemissions/inventory-us-greenhouse-gas-emissions-and-sinks-1990-2020.
[4]. Energy Information Administration (EIA), State Energy Data System, https://www.eia.gov/state/seds/; U.S. Census Bureau, American Community Survey 1-Year Estimates Table S0101, https://data.census.gov/cedsci/table?q=population&tid=ACSST1Y2019.S0101; EPA, Inventory of U.S. Greenhouse Gas Emissions and Sinks: 1990–2020, https://www.epa.gov/ghgemissions/inventory-us-greenhouse-gas-emissions-and-sinks-1990-2020.
[5]. EIA, “Annual Energy Outlook 2022,” https://www.eia.gov/outlooks/aeo/; Annual Energy Outlook 2007, Energy Information Administration, https://www.eia.gov/outlooks/archive/aeo07/aeoref_tab.html.
[6]. Elliott Clay and Kyung Lee, “Adoption of Light-Emitting Diodes in Common Lighting Applications” (Guidehouse, Inc., August 2020), https://www.energy.gov/sites/default/files/2020/09/f78/ssl-led-adoption-aug2020.pdf.
[7]. EIA, State Energy Data System, https://www.eia.gov/state/seds/.
[8]. EIA, Annual Energy Outlook (AEO) 2007, https://www.eia.gov/outlooks/archive/aeo07/aeoref_tab.html; EIA, AEO 2022, https://www.eia.gov/outlooks/aeo/tables_ref.php.
[9]. EIA, AEO 2022, https://www.eia.gov/outlooks/aeo/pdf/AEO2022_Narrative.pdf.
[10]. EPA, Inventory of U.S. Greenhouse Gas Emissions and Sinks: 1990–2020, https://www.epa.gov/ghgemissions/inventory-us-greenhouse-gas-emissions-and-sinks-1990-2020; U.S. Department of State and the Executive Office of the President, “The Long-Term Strategy of the United States: Pathways to Net-Zero Greenhouse Gas Emissions by 2050” (November 2021), https://www.whitehouse.gov/wp-content/uploads/2021/10/US-Long-Term-Strategy.pdf; EIA, AEO 2022, https://www.eia.gov/outlooks/aeo/tables_ref.php.
[11]. EPA, Inventory of U.S. Greenhouse Gas Emissions and Sinks: 1990–2020, https://www.epa.gov/ghgemissions/inventory-us-greenhouse-gas-emissions-and-sinks-1990-2020; Varun Sivaram et al., “Energizing America: A Roadmap to Launch a National Energy Innovation Mission” (ITIF, September 15, 2020), https://itif.org/publications/2020/09/15/energizing-america-roadmap-launch-national-energy-innovation-mission.
[12]. DOE, “FY 2023 Budget Justification” (March 2022), vol. 4, https://www.energy.gov/sites/default/files/2022-04/doe-fy2023-budget-volume-4-eere-v2.pdf; Hoyu Chong and David M. Hart, “Further Energizing Innovation in Fiscal Year 2023” (ITIF, May 2022), https://itif.org/publications/2022/05/13/further-energizing-innovation-fiscal-year-2023; ITIF, Energizing Innovation in FY 2023: Interactive Dataviz (May 2022), https://itif.org/publications/2022/05/13/energizing-innovation-fy-2023-interactive-dataviz.
[13]. DOE, “Research & Development Roadmap: Next-Generation Low Global Warming Potential Refrigerants” (December 2014), https://www.energy.gov/eere/buildings/downloads/research-development-roadmap-next-generation-low-global-warming-potential; DOE, “The Road to Zero: DOE's Next-Generation Heating and Cooling R&D Strategy,” accessed March 19, 2022, https://www.energy.gov/eere/buildings/road-zero-does-next-generation-heating-and-cooling-rd-strategy.
[14]. California Air Resources Board (CARB), High-GWP Refrigerants, accessed May 25, 2022, https://ww2.arb.ca.gov/resources/documents/high-gwp-refrigerants; Omar Abdelaziz et al., “Alternative Refrigerant Evaluation for High-Ambient-Temperature Environments: R-22 and R-410A Alternatives for Mini-Split Air Conditioners” (Oak Ridge National Laboratory, October 2015), https://www.energy.gov/sites/default/files/2015/10/f27/bto_pub59157_101515.pdf; Omar Abdelaziz et al., “Alternative Refrigerant Evaluation for High-Ambient-Temperature Environments: R-22 and R-410A Alternatives for Rooftop Air Conditioners” (Oak Ridge National Laboratory, September 2016), https://www.energy.gov/sites/default/files/2016/09/f33/ORNL%20High%20Ambient%20RTU%20Testing%20Report.pdf; William Goetzler et al., “The Future of Air Conditioning for Buildings” (Navigant Consulting, Inc., July 2016), https://www.energy.gov/sites/default/files/2016/07/f33/The%20Future%20of%20AC%20Report%20-%20Full%20Report_0.pdf.
[15]. EPA, “Phasing Out HCFC Refrigerants to Protect the Ozone Layer,” accessed May 25, 2022, https://www.epa.gov/sites/default/files/2015-07/documents/phasing_out_hcfc_refrigerants_to_protect_the_ozone_layer.pdf.
[16]. DOE, “FY 2023 Budget Justification” (March 2022), vol. 4, https://www.energy.gov/sites/default/files/2022-04/doe-fy2023-budget-volume-4-eere-v2.pdf.
[17]. International Energy Agency (IEA), ETP Clean Energy Technology Guide (IEA, November 2021), https://www.iea.org/articles/etp-clean-energy-technology-guide.
[18]. William Goetzler, Timothy Sutherland, and Kevin Foley, “Research & Development Roadmap for Next-Generation Appliances” (Navigant Consulting, October 2014), https://www.energy.gov/sites/prod/files/2014/12/f19/Research%20and%20Development%20Roadmap%20for%20Next-Generation%20Appliances.pdf.
[19]. DOE, Low Carbon Pilot, accessed June 1, 2022, https://betterbuildingssolutioncenter.energy.gov/challenge/special-initiatives/low-carbon-pilot.
[20]. EIA, “2018 Commercial Buildings Energy Consumption Survey,” November 2021, https://www.eia.gov/consumption/commercial/data/2018/index.php?view=microdata; EIA, “2015 Residential Energy Consumption Survey,” December 2018, https://www.eia.gov/consumption/residential/data/2015/index.php?view=microdata.
[21]. House Energy and Water Development and Related Agencies Appropriations Bill, 2022, 117th Cong. (July 2021), https://docs.house.gov/meetings/AP/AP00/20210716/113895/HRPT-117-13.pdf; Joint Explanatory Statement: Division D—Energy and Water Development and Related Agencies, Appropriations Act, 2022, 117th Cong. (March 2022), https://docs.house.gov/billsthisweek/20220307/BILLS-117RCP35-JES-DIVISION-D.pdf.
[22]. Matt Jungclaus et al., “Reducing Embodied Carbon in Buildings: Low-Cost, High-Value Opportunities” (RMI, 2021), http://www.rmi.org/insight/reducing-embodied-carbon-in-buildings.
[23]. World Green Building Council, “Bringing Embodied Carbon Upfront: Coordinated Action for the Building and Construction Sector to Tackle Embodied Carbon” (World Green Building Council, 2019), https://www.worldgbc.org/sites/default/files/WorldGBC_Bringing_Embodied_Carbon_Upfront.pdf.
[24]. DOE, “ARPA-E Announces $5 Million in Funding to Universities Developing Life Cycle Assessment Tools for Carbon Negative Buildings” (March 2022), https://arpa-e.energy.gov/news-and-media/press-releases/arpa-e-announces-5-million-funding-universities-developing-life-cycle.
[25]. David Marquis, “ERDC labs form team to tackle climate change” (US Army Corps of Engineers, July 2021), https://www.erdc.usace.army.mil/Media/News-Stories/Article/2687745/erdc-labs-form-team-to-tackle-climate-change/.
[26]. Varun Sivaram et al., “Energizing America: A Roadmap to Launch a National Energy Innovation Mission.”
[27]. Peter Fox-Penner et al., “Clean and Competitive: Opportunities for U.S. Manufacturing Leadership in the Global-Low Carbon Economy” (ITIF, Boston University Institute for Sustainable Energy, and Fraunhofer USA Center for Manufacturing Innovation, June 2021), https://itif.org/publications/2021/06/21/clean-and-competitive-opportunities-us-manufacturing-leadership-global-low/.
