


The Hamilton Index: Assessing National Performance in the Competition for Advanced Industries

Compared to major competitors, U.S. output in key advanced industries is weak and declining. Congress and the administration should launch an economic “moon shot” initiative committing to increase the concentration of these industries in the U.S. economy by at least 20 percentage points relative to the global average within a decade.
KEY TAKEAWAYS
Key Takeaways
Industry-by-Industry Performance. 12
Country-by-Country Performance 26
Executive Summary
Nations are in a fierce win-lose global competition for market share in advanced, traded-sector technology industries, because winning enables economic and national security. That is especially true for allied nations, because China’s gain comes at their loss and vice versa. Winning—not only the competition for innovation leadership but also for production capacity—will boost wages, international competitiveness, and economic and national security.
When it comes to the U.S. national interest, innovation-based production is key. The United States has a long history of pioneering innovations only to see their production captured by other nations, including China, which reduces growth, weakens the terms of trade (creating a higher trade balance and/or a weaker dollar), and degrades the national security industrial base.
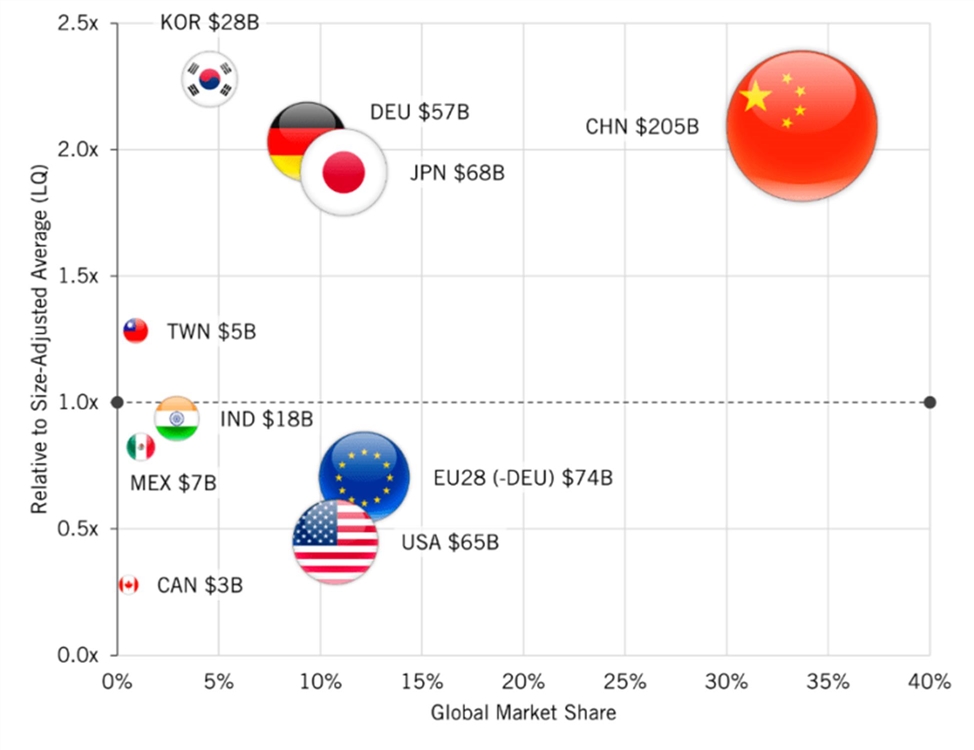
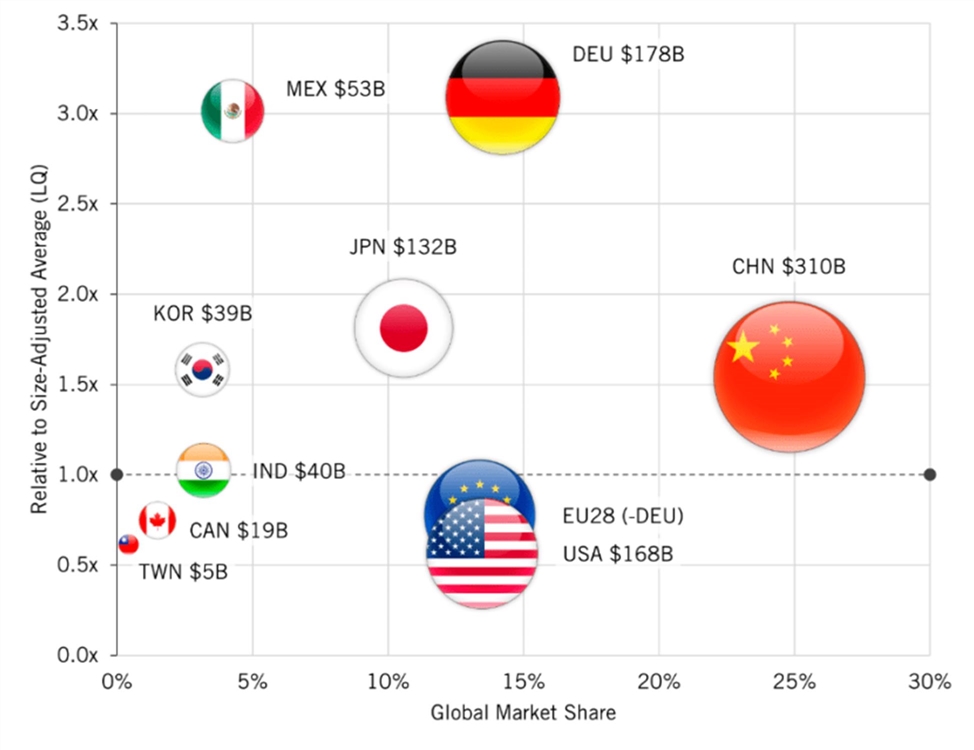
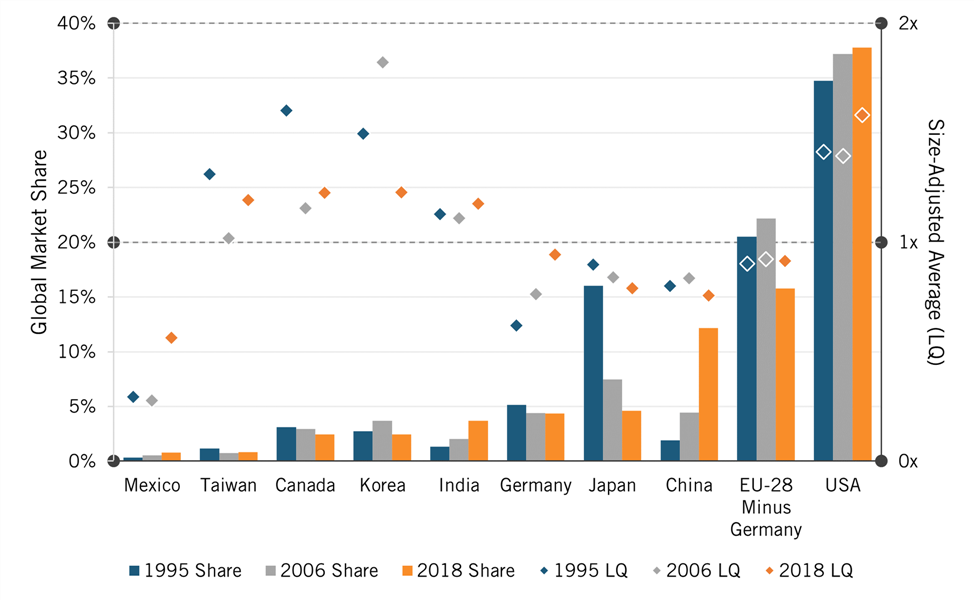
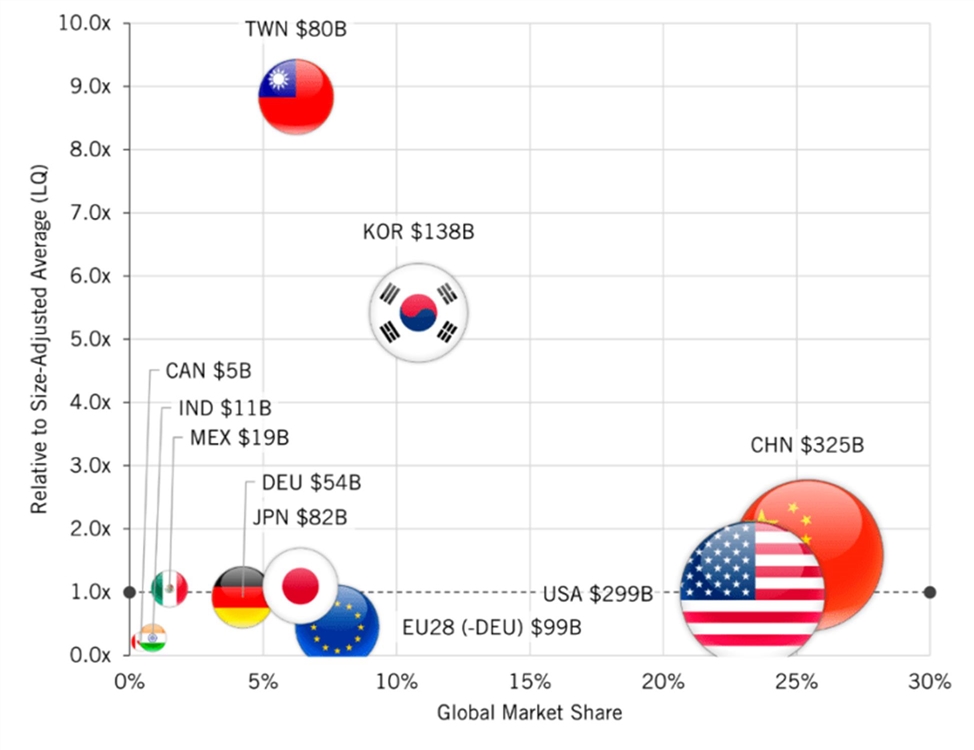
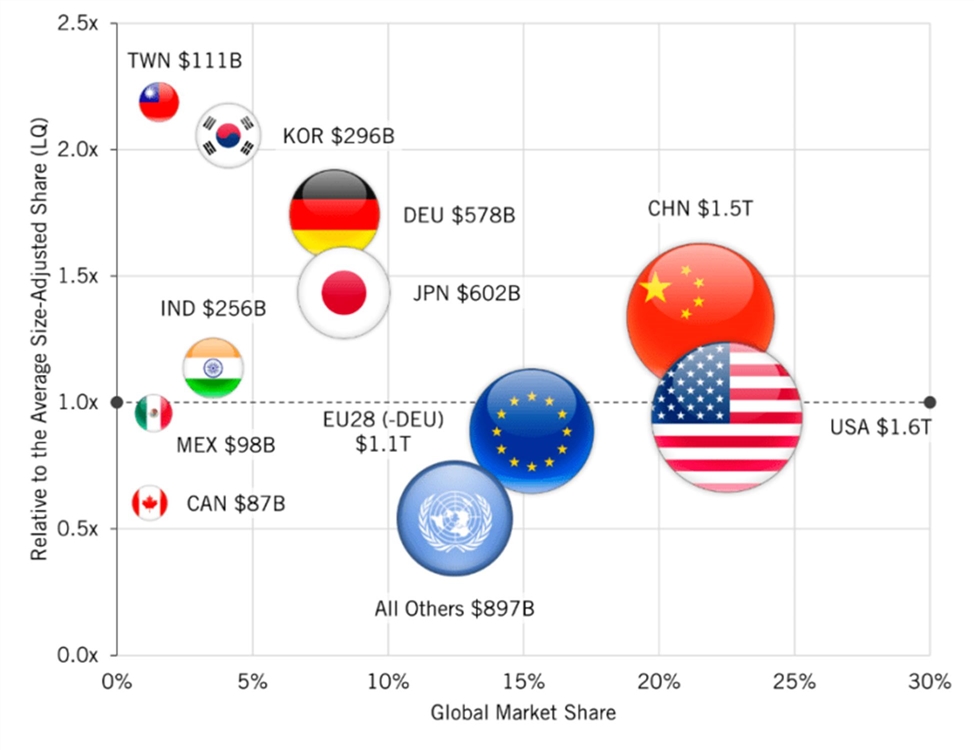
Figure 1: Total production and global market shares in Hamilton Index sectors, 2018

ITIF’s Analysis and Findings
The Hamilton Center on Industrial Strategy at the Information Technology and Innovation Foundation (ITIF) examined national changes in global shares of output in seven industry sectors that the Center has aggregated into the Hamilton Index of Advanced-Technology Performance: pharmaceuticals; medicinal, chemical, and botanical products; electrical equipment; machinery and equipment; motor vehicle equipment; other transport equipment; computer, electronic, and optical products; and information technology and information services. This report covers three years—1995, 2006, and 2018—for 10 countries and regions: the United States, Canada, Mexico, Germany, the EU-28 minus Germany, China, India, Japan, Korea, and Taiwan.
The data show U.S. performance is weak and declining, both in absolute market share and relative to the size-adjusted global average (a ratio known as a location quotient). It is strongest in IT and other information services (software and Internet companies) and other transportation equipment (principally aerospace). In contrast, U.S. global market share in electrical equipment, machinery and equipment, and motor vehicles is quite low and falling. Significant growth in the IT and other information services sector, both globally and especially in the United States, is why the overall decline in U.S. global market share of advanced industries was limited to 1.5 percentage points from 1995 to 2018.
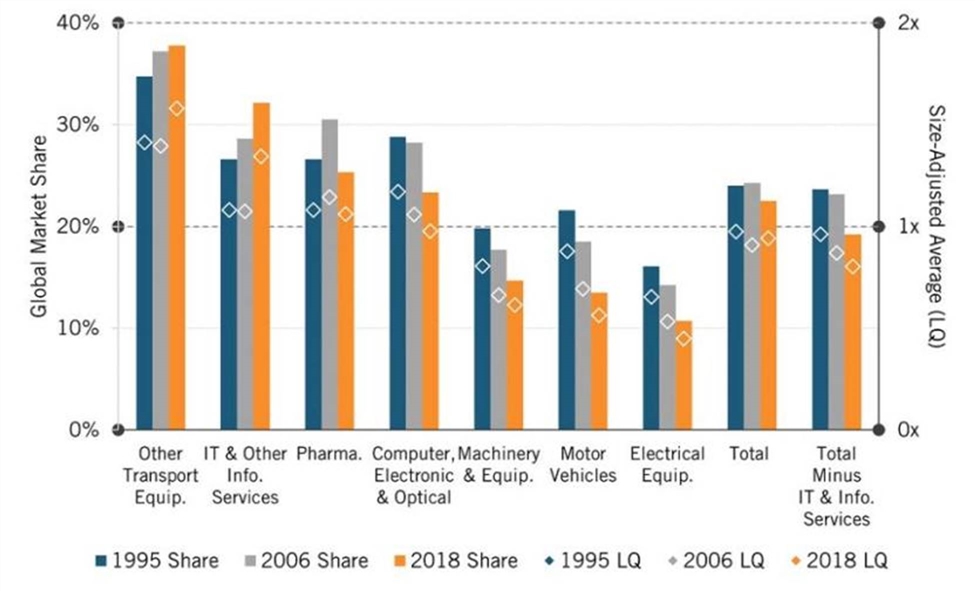
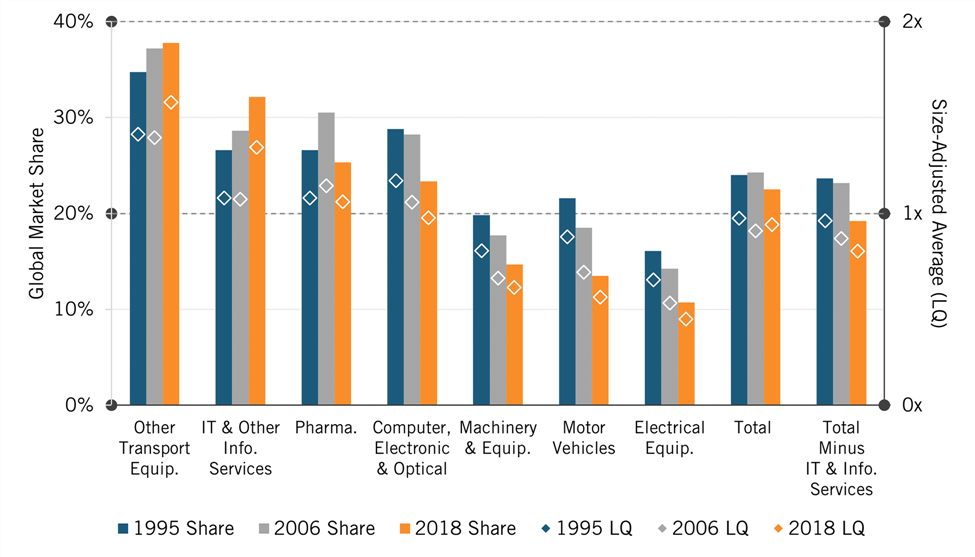
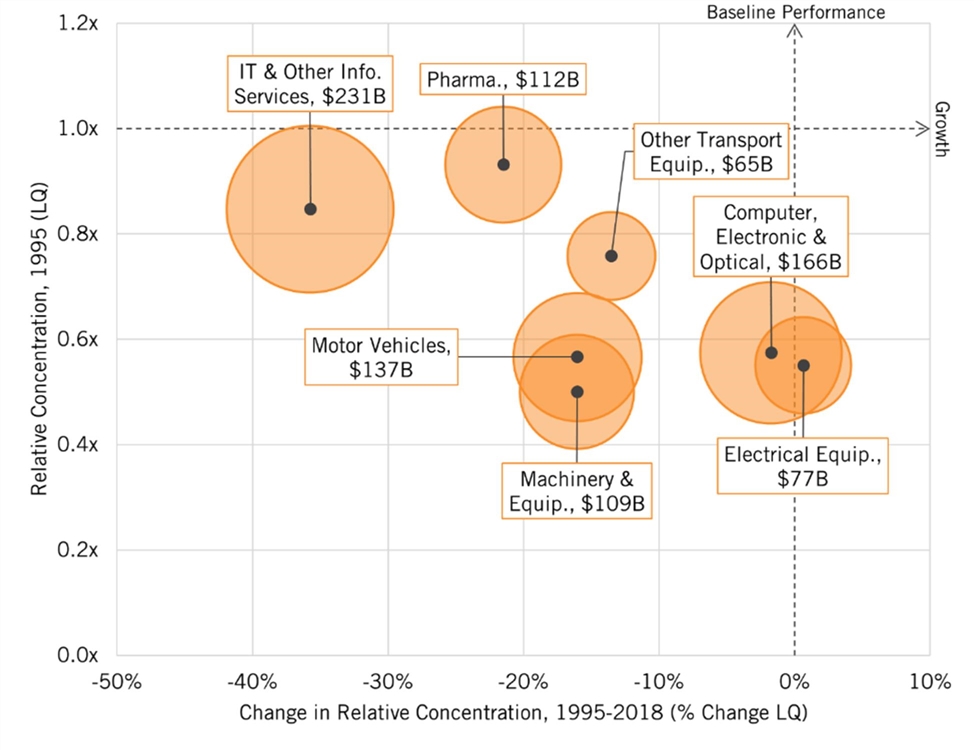
In relative terms, the U.S. pharmaceutical sector, along with other transportation, and IT and other information services, are all larger than the global average, while electrical equipment, machinery, motor vehicles, and computing and electronics are all below average (figure 2). In 1995, advanced industries constituted about the same share of the U.S. economy as the global economy; by 2018, the share had fallen to 94 percent of the global average. In other words, the United States is less specialized than the rest of the world is in these advanced industries.
Figure 2: U.S. performance in the advanced industry sectors comprising ITIF’s Hamilton Index
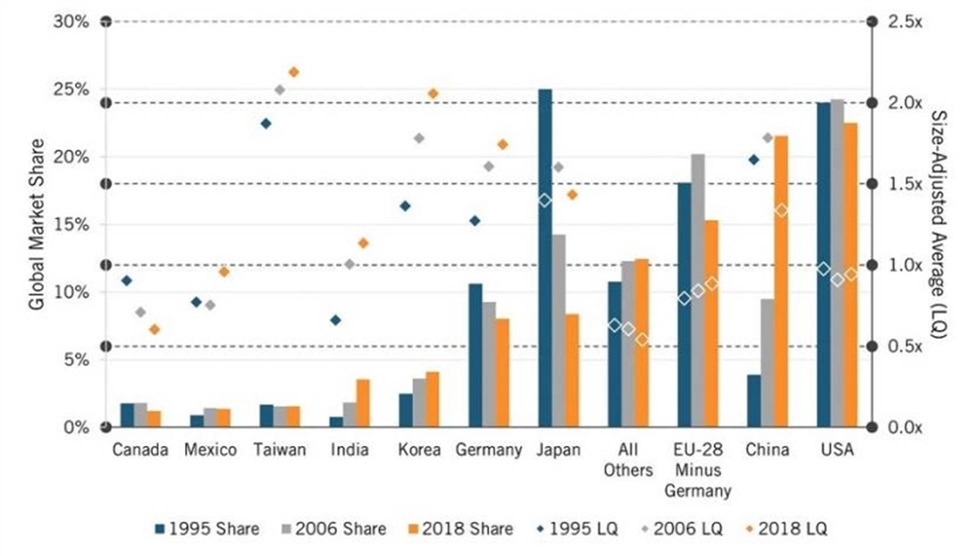
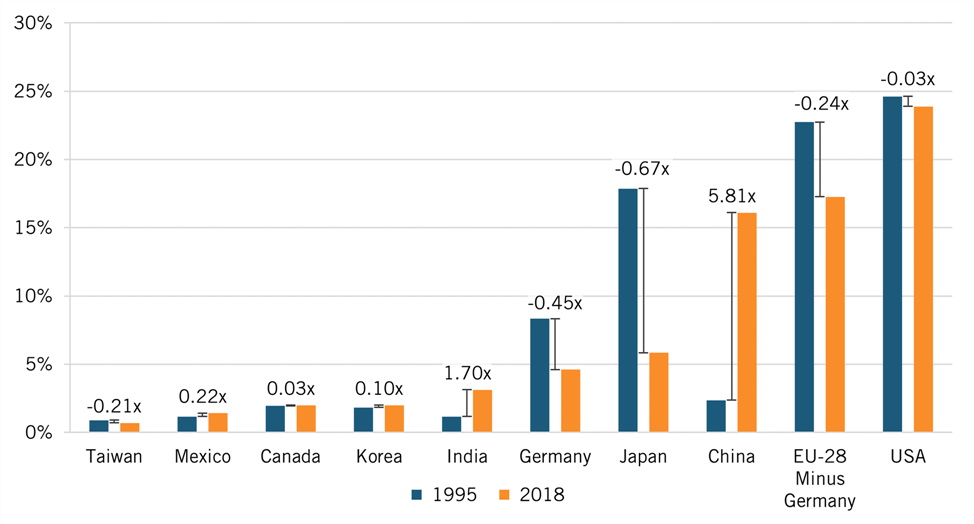
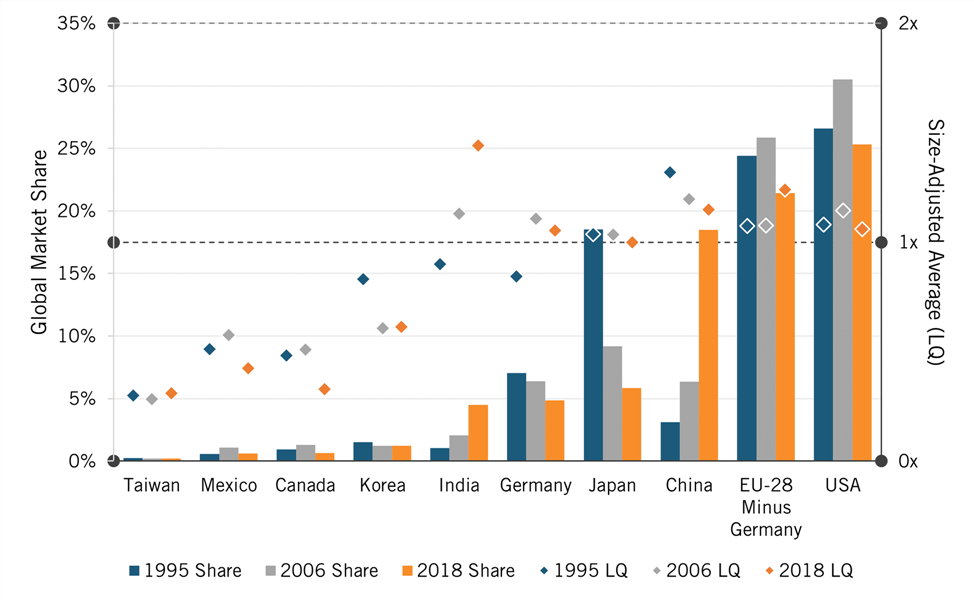
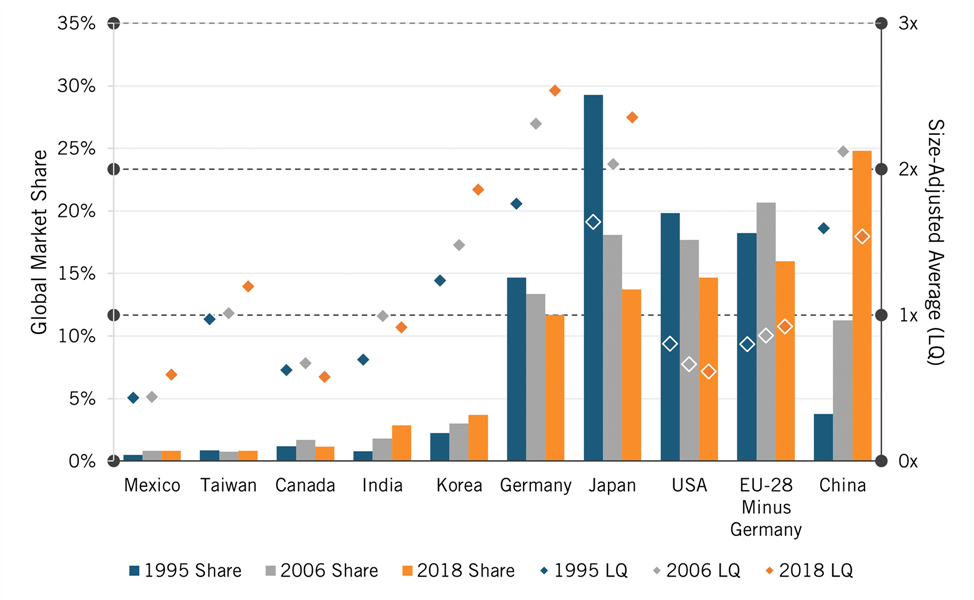
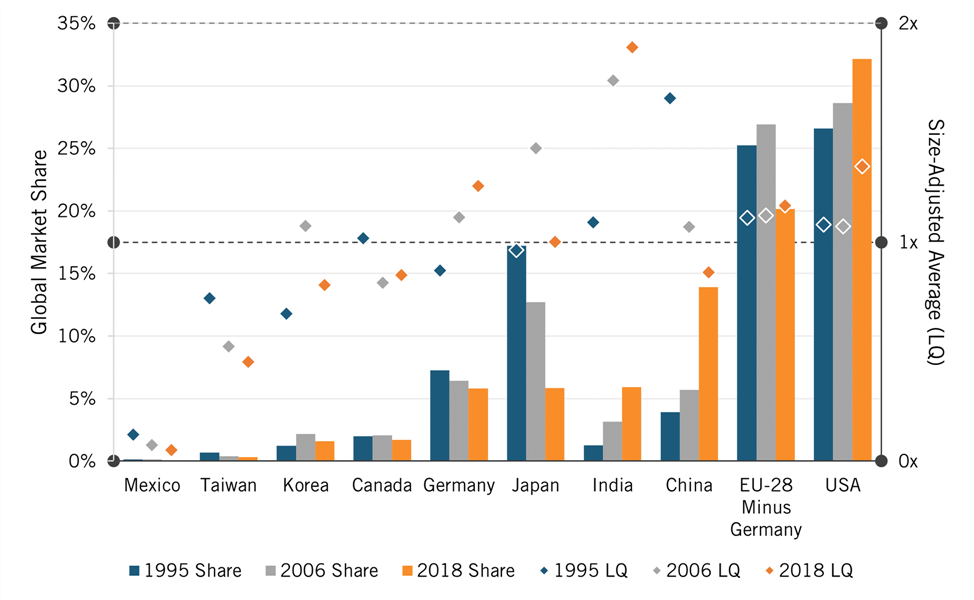
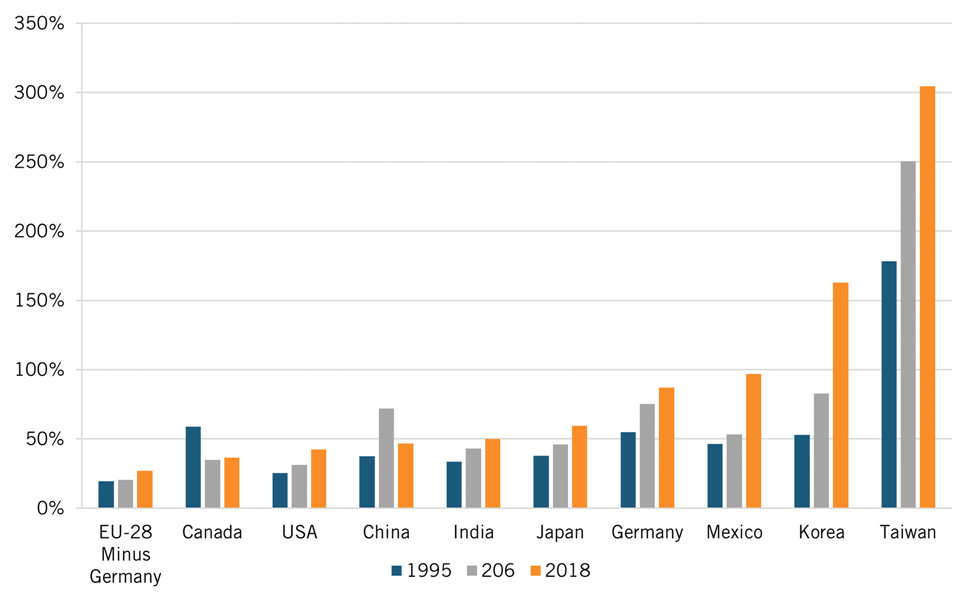
Between 1995 and 2018, many countries’ global shares of advanced-industry output changed significantly (figure 3). As Japan’s overall share of the global economy fell, its share of advanced-industry output plummeted too, while China’s global market share increased by more than a factor of five. The U.S. share fell slightly.
In relative terms, most other nations held significantly higher shares of the global market in advanced industries than the United States: In 2018, China’s share was 34 percent above the global average, Japan was 43 percent higher, Germany 74 percent above the average, and South Korea and Taiwan were both more than twice the average. Interestingly, China’s relative share fell, especially after its 2009 peak, while Japan’s relative share stayed largely stable.
Figure 3: Global market shares of Hamilton Index sectors, 1995–2018
If U.S. policymakers want advanced industries to be the same share of the U.S. economy as they are in the rest of the world, advanced-industry output will have to expand by about $100 billion annually. To match China, output would have to expand by nearly $680 billion (42 percent).
Policy Recommendations
To close these gaps, Congress should pass and fully fund the competitiveness legislation now on the table, including the provisions in the Senate bill regarding the National Science Foundation and the CHIPS Act. But as important as this legislation is, Congress will need to do more, if for no other reason than other countries, including China are doing more. That is why Congress and the Biden administration should establish an economic “moon shot” initiative, committing the nation to increase its relative level of advanced-industry concentration by 20 percentage points in a decade. Assuming a 3 percent growth rate in the rest of the economy, doing so could add nearly $2.5 trillion to advanced-industry output over 10 years. It would also reduce U.S. supply chain vulnerability, create millions of good jobs, reduce the trade deficit, weaken China’s advanced economy, and shore up dual-use industries critical to U.S. national defense.
To help achieve all of this, Congress should pass and fund a $25 billion annual “Super CHIPS Act”—a federal incentive program (to be matched by state and local governments) that provides financial incentives for U.S. and allied-country firms to build or expand advanced-industry R&D and production sites in the United States.
Introduction
In Forging Global Fordism, a history of how both Nazi Germany and the Soviet Union learned mass-production manufacturing from America, historian Stefan Link wrote that “productive dual-use technologies are fiercely contested by states.”[1] This was true in the 1930s and is even more true in the 2020s. Notwithstanding the neoliberal belief that global trade is generally a win-win proposition, nations are indeed in fierce win-lose global competition for market share in advanced-technology industries because winning that competition—not only the competition for innovation leadership, but also the competition for production leadership—will boost wages and international competitiveness, thereby enabling economic and national security.[2] This is especially the case for the United States, because if it wins, it is likely that its chief adversary, China, will lose, and vice versa. In other words, most of this competition is over a “fixed pie,” where if other nations win, especially China, it will mean that the United States is likely to lose, especially as the Chinese government has firmly set its sights on increasing its global market share in all advanced technology sectors. We see this tug-of-war in the fact that there was a strong correlation (-0.78) between the change in the respective shares of global output that China and the United States held in advanced industries from 1995 to 2018. In other words, the more ground China gained in these industries, the more the United States lost.
Surprisingly, there has been little empirical analysis of how the United States is doing compared to other nations. In this report, the Hamilton Center on Industrial Strategy at the Information Technology and Innovation Foundation (ITIF) examines national changes in industry concentration and global shares of output for seven advanced sectors that the Center has aggregated into the Hamilton Index of Advanced-Technology Performance: pharmaceuticals, medicinal, chemical, and botanical products; electrical equipment; machinery and equipment; motor vehicle equipment; other transportation equipment; computer, electronic, and optical products; and information technology (IT) and information services. It focuses on three years—1995, 2006, and 2018 (the last year for which data is available)—and 10 countries and regions together accounting for more than three-quarters of the sectors’ global output: the United States, Canada, Mexico, Germany, the EU-28 minus Germany, China, India, Japan, Korea, and Taiwan.
The Hamilton Center’s data analysis shows that America’s relative performance in advanced industries has been weak over the last two decades. Leaving out the strong performance in the IT and information services sector, where leading U.S. firms such as Google, Facebook, and Microsoft have continued to grow, U.S. performance had consistently declined through 2018.
The strongest industries in terms of U.S. share of global output are “other transportation equipment,” which in the U.S. case is principally aerospace (figure 17), and IT and other information services, which includes software and Internet companies (figure 21). The next-strongest industry, pharmaceuticals, has declined slightly and is now only barely above the global average share (figure 9). All other sectors are a much lower share of the U.S. economy and have declined significantly since 1995, including electrical equipment (figure 11); machinery and equipment (figure 13); motor vehicles (figure 15); and computer, electronic, and optical equipment (figure 19). The significant growth in IT and other information services—globally, but especially in the United States—is why advanced industries declined by just 3.4 percentage points in the United States relative to the global average share from 1995 to 2018. When IT and information services is not included, America’s relative share of advanced industries declined by nearly 16 percentage points from 96.2 to 80.4 percent (figure 27), meaning the share of the U.S. economy made up by these industries is almost 20 percent less than the global average. This put the United States behind nations like India, Italy, Mexico, Slovenia, Thailand, and Vietnam.
Advanced industries now make up a smaller share of the U.S. economy than these industries constitute in the overall global economy (see figure 4). In other words, America is no longer specialized in advanced technology industries. In stark contrast, the levels of concentration in most other leading nations examined in this report were significantly higher than the global average: 34 percent higher in China, 43 percent higher in Japan, 74 percent in Germany, and more than twice as high in South Korea and Taiwan, at 206 percent and 219 percent respectively.
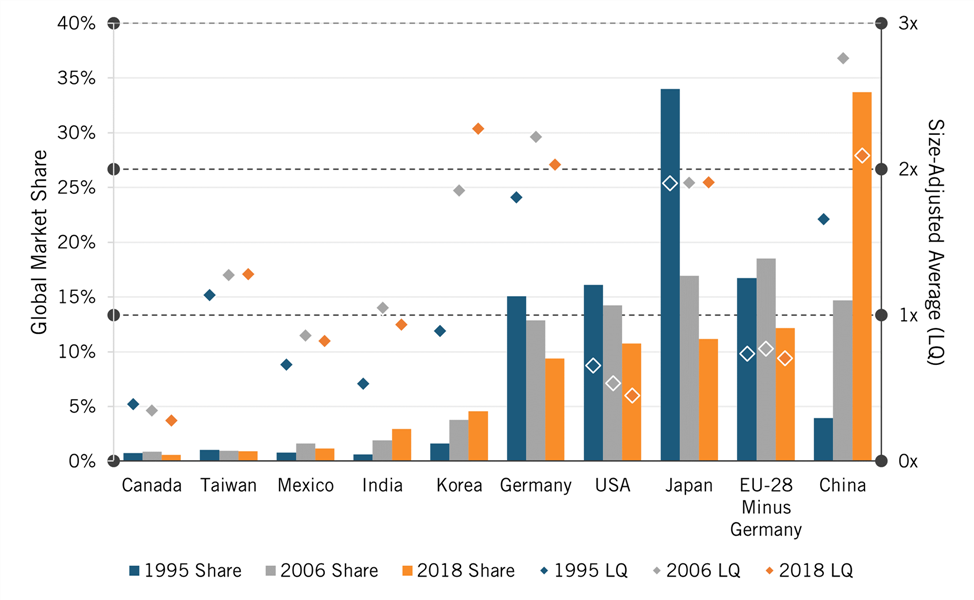
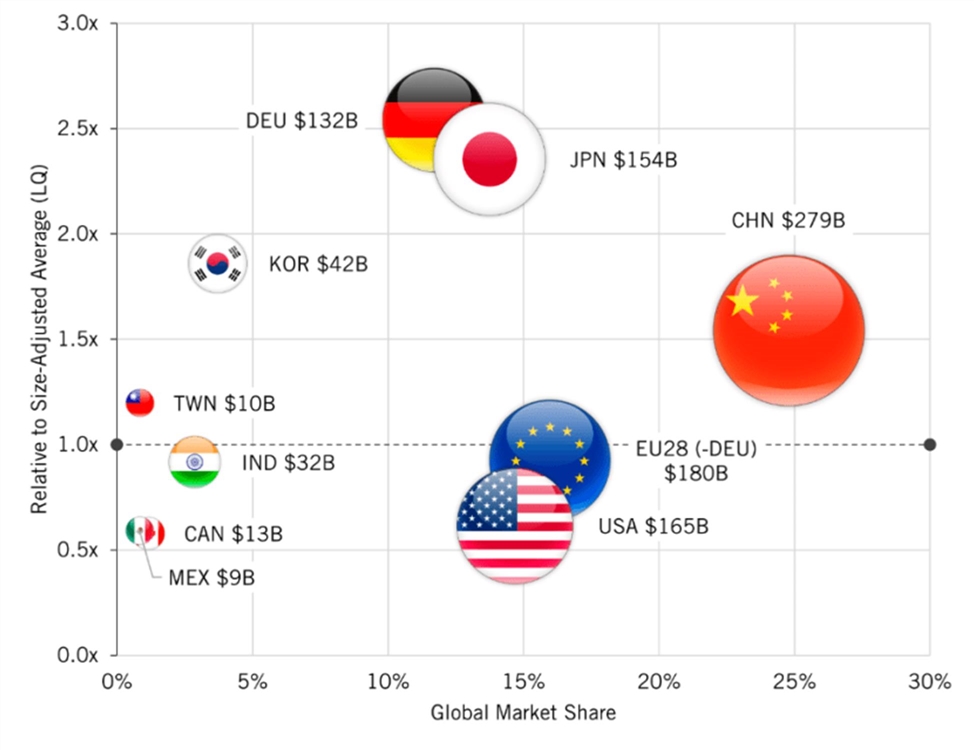
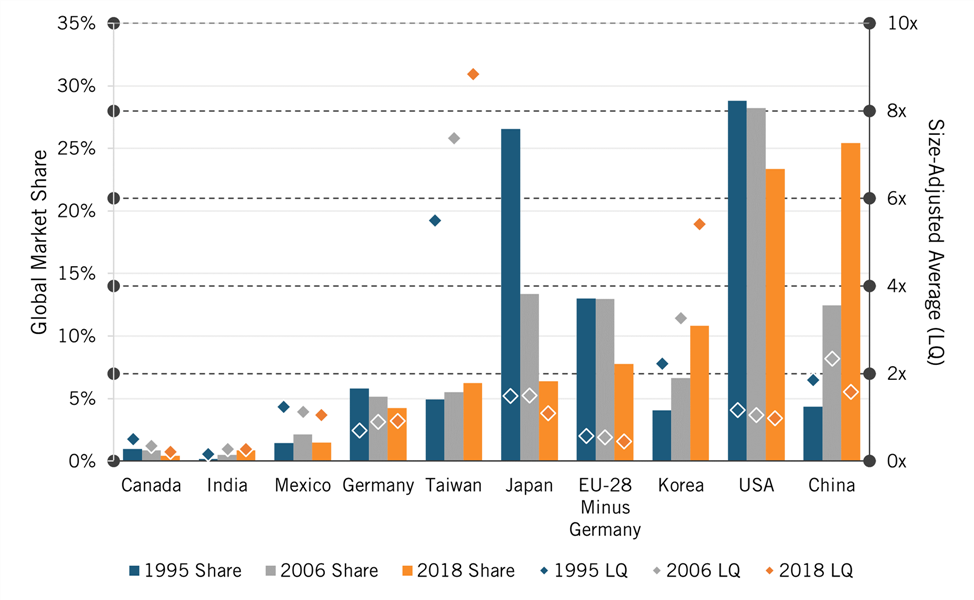
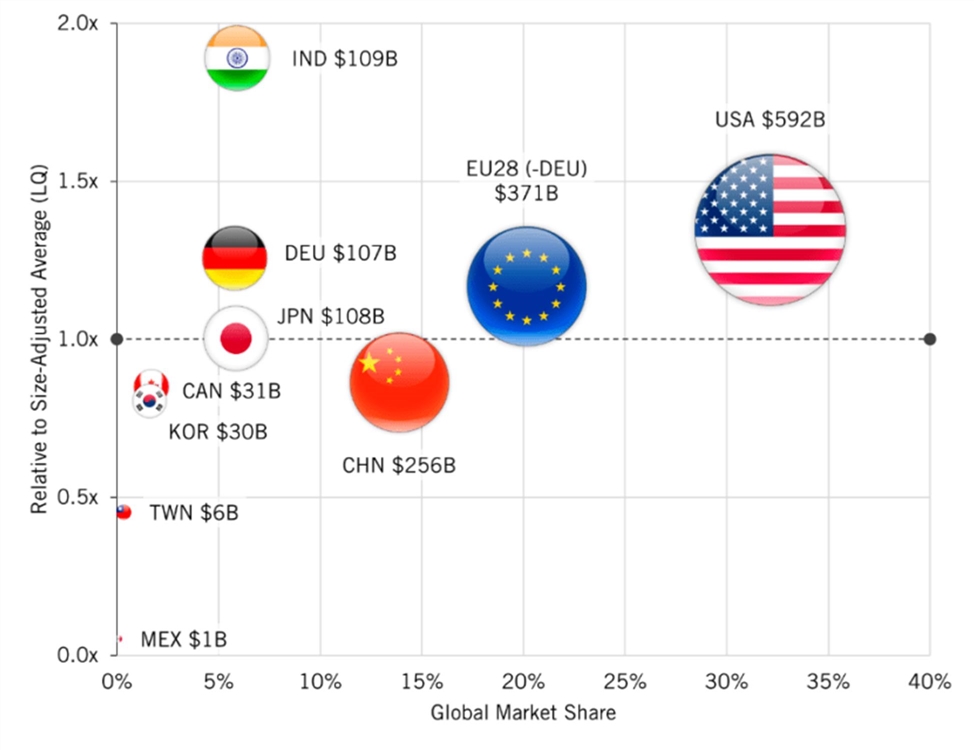
Figure 4: Global production and market shares in Hamilton Index sectors, 2018
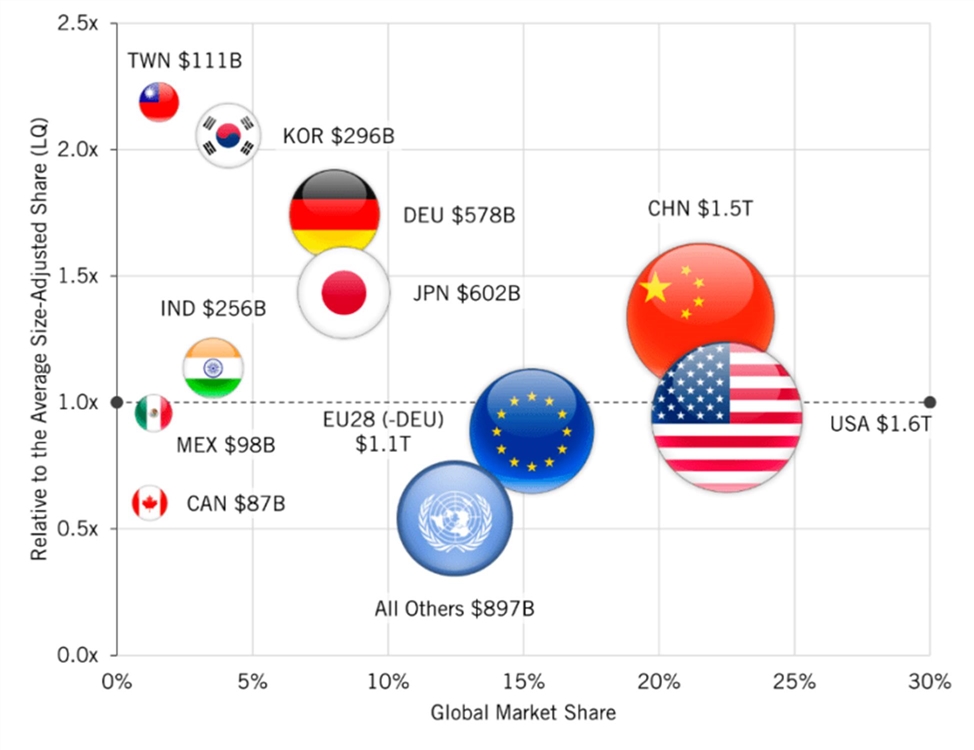
If U.S. policymakers want advanced industries to constitute the same share of the U.S. economy as they do in the rest of the world, then advanced-industry output will need to expand by close to $100 billion annually—and to match China, U.S. output will have to expand by more than 42 percent, or around $680 billion annually.
Thankfully, given America’s poor performance, the dominant narrative in Washington when it comes to U.S. international competitiveness has recently begun to evolve. Where there was once a dismissive belief that there’s little difference between computer chips and potato chips, there is now a growing recognition that the United States needs to build a more dynamic, advanced-technology economy. The question of production is for the most part strangely absent, however. Policy advisers usually offer up solutions such as boosting high-skilled immigration, maintaining robust intellectual property laws, and funding scientific research. It’s as if innovation and even innovation were the only things that mattered, and the location of production was irrelevant.
Yet, when it comes to U.S. national interest, it is innovation-based production that matters most. America has a long history of pioneering innovations (computing, semiconductors, solar panels, machine tools, etc.) only to see their production captured by other nations, including China. It is easy to imagine a similar dynamic for emerging technologies such as quantum computing, robotics, 6G equipment, and gene editing, with America inventing and others producing.
Congress and the Biden administration should establish a “moon shot” that commits the nation to increasing the concentration of these industries in the U.S. economy by at least 20 percentage points relative to the global average within a decade.
To be sure, innovation is critical, but failing to capture that innovation domestically through production will lead to reduced economic growth, faltering terms of trade (in the form of a higher trade balance and/or a weaker dollar), techno-economic dependencies, and a diminished national security industrial base. While continuing U.S. competitiveness in advanced services is important, under-performance for advanced goods produces a larger trade deficit and a weaker domestic production base. Among other things, this can make it harder for the Defense Department to get what it needs, especially if other countries cut off U.S. access to critical supplies.[3] Moreover, as the White House stated in a 2021 supply chain report, “our domestic innovation capacity is contingent on a robust and diversified industrial base. When manufacturing heads offshore, innovation follows.”[4] In other words, we need to not only “invent here” but manufacture here.[5]
Yet, to the extent a competitiveness policy response is favored in Washington, it is almost always a process-based one: boost skills, reform regulations, spur tech transfer, etc. As important as these are, they will not be enough. It is time for policymakers to take this challenge seriously and establish quantitative goals for the size and global share of the U.S. advanced-industry sector. To achieve those goals, Congress and the Biden administration should establish a “moon shot” that commits the nation to increasing the concentration of these industries in the U.S. economy by at least 20 percentage points relative to the global average within a decade.
To be clear, this should not be achieved through coercion, such as Buy America provisions, as doing so only encourages retaliation and ultimately does not provide sustainable competitive advantage, especially in key industries. Rather, Congress needs to pass a “Super CHIPS Act”: a federal incentive program (to be matched by state and local governments) to provide financial incentives to U.S. and allied-country firms to build or expand advanced-industry research and production sites in the United States.
Even when skeptics concede that “computer chips” matter, the response is often that the United States should not be forced to compete because that is just a “race to the bottom,” especially if the federal government provides incentives for production. But the reality is if America doesn’t play the game, it will lose, and the game’s rules cannot be changed, notwithstanding endless claims to reform the World Trade Organization rules. If America wants to win in advanced industries, its only choice is to play to win, and that requires providing sufficient incentives to grow and attract advanced production.
Methodology
One way to assess national performance in industries is to examine their share of global industry output over time by country. The Organization for Economic Cooperation and Development (OECD) provides data on industry output over time for 66 nations (in dollar-adjusted terms) that collectively account for most of the world’s output.[6] All data in this report relies on the OECD dataset, although the level of industry granularity is limited to major industry groupings.
There are, however, several problems with this data. First, it is in nominal dollar output and not adjusted for inflation or changes in currency values. If the value of the dollar strengthens relative to the other nations analyzed, U.S. output for that year that will appear larger than if the dollar value had remained constant. Similarly, if an industry’s price inflation rate is less than the overall inflation rate, it will appear as if the industry output has not grown as much as it really has (in terms of actual, price-adjusted output). We see this in the data on overall growth in computing and electronic equipment, where their share of global output fell from 1.8 to 1.5 percent. But in the absence of real output data, these problems cannot be corrected for.
Figure 5: Relative changes in national shares of global GDP
Moreover, industries vary significantly in their level sophistication when it comes to production. Some are complex and advanced (e.g., exhibiting strength in semiconductor production) and others are more commoditized (e.g., specializing in semiconductor test and assembly). Thus, comparing total output between nations can mask importance differences in technological sophistication. However, even with these challenges, ITIF believes that such an international comparison provides useful information.
Simply comparing national shares of global output for particular industries tells one thing, but it does not account for nations’ changing shares of the overall global economy. As figure 5 shows, in some cases, national shares of global gross domestic product (GDP) have changed significantly. For example, in large part because of an almost 14 percent decline in its working-age population, Japan’s share of global GDP fell from around 18 percent in 1995 to just below 6 percent in 2018, a drop of more than 66 percent. Likewise, the EU-28-minus-Germany share fell considerably, from around 22 to 16.7 percent, while Germany’s share fell even more, from 8.3 to 4.6 percent. The U.S. share remained largely unchanged, even though its population increased 24 percent, because per capita GDP grew faster in other nations, especially China. China’s share of global GDP skyrocketed from 2.4 percent to 16.1 percent, in part due to faster productivity and population growth, and industry expansion aided and abetted by unprecedented mercantilist practices. India’s share, while still miniscule given its population size, almost tripled.
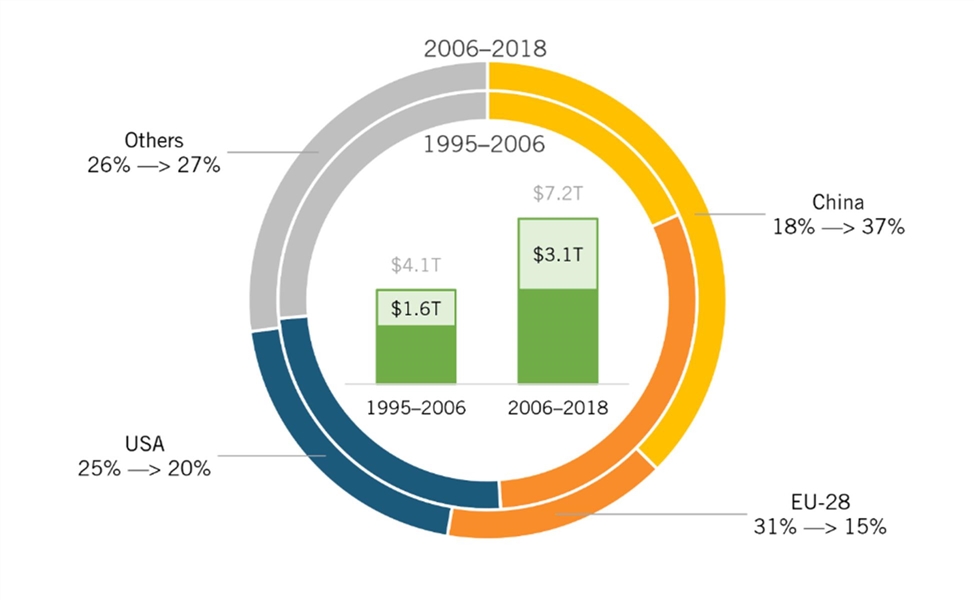
The seven advanced industries also changed between 1995 and 2018 in terms of their relative shares of the global economy (figure 6 and figure 7). As their combined output in nominal GDP increased from $2.5 trillion to $7.2 trillion, IT and other information services grew significantly, from 12 percent of the total to 26 percent, with pharmaceuticals growing slightly, and other transportation equipment retaining its same share. The other sectors lost shares. This significant growth is a key reason so many nations are seeking competitive advantage in IT and information services, including by mercantilist and protectionist actions (e.g., by China and Europe). Overall, there was little change from 1995 to 2018 in advanced-industry output as a share of global output in dollar terms; it remained at 8.3 percent. But China was increasing its share of the pie. It held 22 percent of global Hamilton-Sector output as of 2018, and it had captured 38 percent of the $3.1 trillion increase since 2006 (figure 8).
Figure 6: Advanced industries’ shares of global GDP
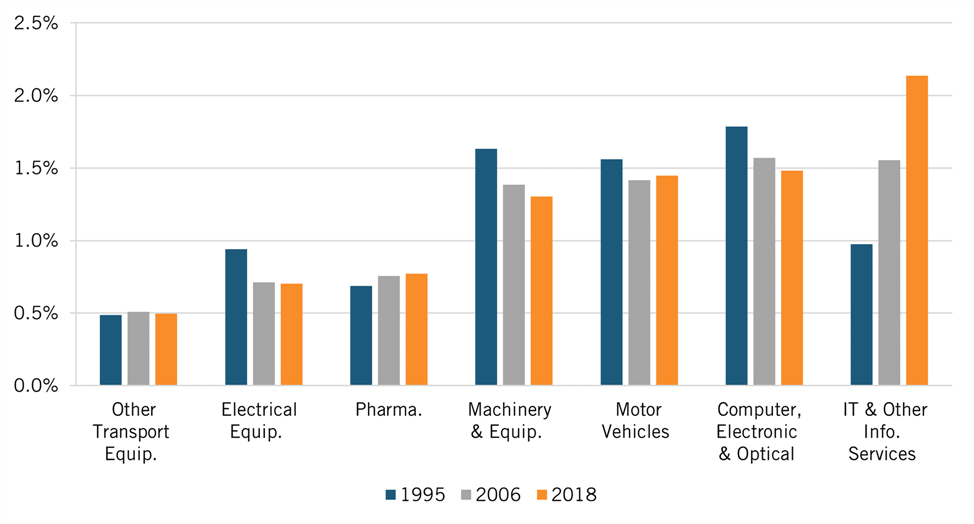
Figure 7: Hamilton Index composition, 1995 —> 2018
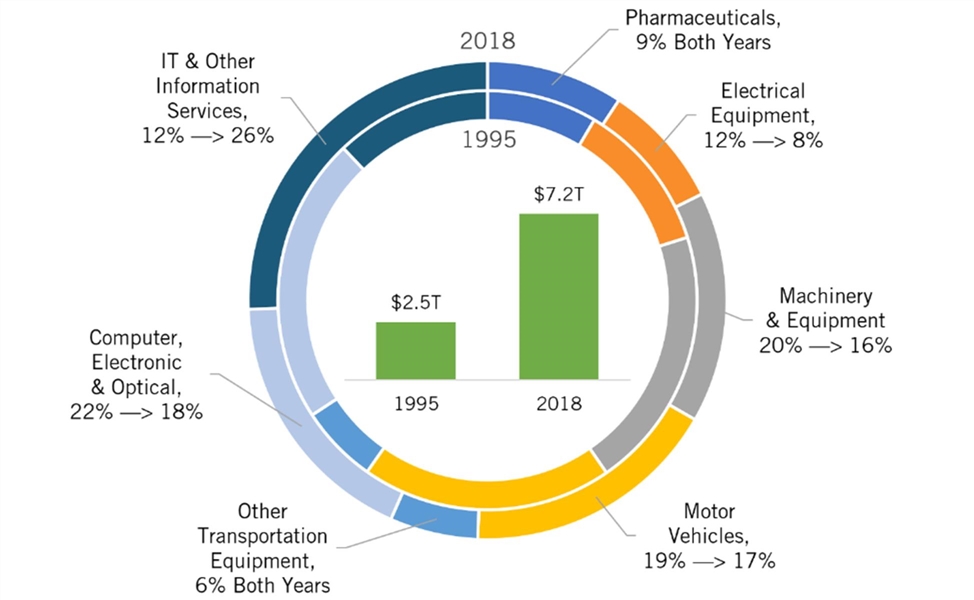
Figure 8: Global shares of increased Hamilton Sector output, 1995–2006 —> 2006–2018
Finally, examining nations’ and regions’ global shares of advanced-industry output relative to their changing shares of global GDP enables a more accurate comparison among countries. This ratio, known as a location quotient (LQ), also can be calculated as an industry’s share of national GDP divided by its share of global GDP. It provides a global benchmark measure of a country or region’s industrial concentration, and therefore its competitive position, by expressing its market share as a multiple (X) of the size-adjusted global average. (See table 1). So, an LQ of 1 means the country or region’s production is proportionally the same as the global average; an LQ greater than 1 means the country’s output is that much more than the global average relative to the size of its economy; and an LQ less than 1 means the country’s relative concentration in the industry that much lower than the global average.
Table 1: ITIF methodology for analysis of international competition for market share in advanced industries
|
# |
Metric |
Source |
Calculation |
Example |
|||
|
Country |
Sector |
Year |
Finding |
||||
|
A |
National GDP |
World Bank |
=(#) |
Korea |
GDP |
2018 |
$1.7T |
|
B |
Global GDP |
World Bank |
=(#) |
World |
GDP |
2018 |
$86.3T |
|
C |
National Share of Global GDP |
ITIF |
=(A/B) |
Korea |
GDP |
2018 |
2.00% |
|
D |
National Output, Single Sector |
OECD |
=(#) |
Korea |
Computers, Electronics |
2018 |
$138B |
|
E |
Global Output, Single Sector |
OECD |
=(#) |
World |
Computers, Electronics |
2018 |
$1.3T |
|
F |
National Output, Advanced Total |
ITIF |
=SUM(#:#) |
Korea |
All Advanced |
2018 |
$269B |
|
G |
Global Output, Advanced Total |
ITIF |
=SUM(#:#) |
World |
All Advanced |
2018 |
$7.2T |
|
H |
“Domestic Market Share” |
ITIF |
=(D/A) |
Korea |
Computers, Electronics |
2018 |
8.0% |
|
I |
“Global Market Share” |
ITIF |
=(D/E) |
Korea |
Computers, Electronics |
2018 |
10.8% |
|
J |
“Relative Market Share” (LQ)* |
ITIF |
=(I/C) |
Korea |
Computers, Electronics |
2018 |
5.42x |
* Relative market share (LQ) also can be calculated as an industry’s share of national GDP divided by the industry’s share of global GDP. For example, in 2018 the computer, electronics, and optical sector made up 8.03 percent of Korea’s GDP and 1.51 percent of global GDP, so: 8.03 / 1.48 = 5.42.
Industry-by-Industry Performance
This section evaluates national/regional performance on the seven key advanced-industry sectors.
Pharmaceuticals
With new innovations such as nanotechnology, gene editing, big data, and synthetic biology, biopharmaceutical innovation is accelerating and improving. As a high-wage industry (U.S. annual wages average $75,150), many countries are competing for global market share.
Nations vary considerably in their competitive advantage in pharmaceutical production (figure 9). The United States maintains a lead in global market share over the EU-28 minus Germany, though both are declining (figure 10). China is third, but rapidly gaining. However, from 1995 to 2018, Japan’s global share fell so dramatically that Japan went from being a major producer to an also-ran. Canada, Korea, Mexico, and Taiwan have little presence in the industry. The only two nations that saw rising shares were China and India, whose gains came at the expense of all the other nations and regions.
Figure 9: Global shares of pharmaceutical, medicinal-chemical, and botanical production, 2018
Controlling for change in a country’s share of global GDP presents a different picture for pharmaceutical competitiveness (figure 10). Because Japan’s share of the global economy declined, its size-adjusted performance in pharmaceuticals was relatively stable over this period, declining by just under 4 basis points to a level almost even with the global average (0.998x). The EU-28 minus Germany’s relative share also increased in part because of slower GDP growth. This was due in part to strong growth in Belgium, Denmark, and the EU-10, but mostly because of the sector’s more than tenfold growth in Ireland.
Surprisingly, given how much it grew in China, the pharma sector has become relatively less important there because the Chinese economy itself grew much faster, but as of 2018 its share exceeded the global average by 15 percent (1.15x). Korea’s modest share fell even more relative to the size-adjusted average, as did Mexico’s. Taiwan has the smallest pharma sector as a share of its economy. India showed the fastest relative growth, and it and the EU-28 minus Germany had the largest pharma sectors as a share of their economies among the nations and regions compared. While the United States led in biopharma innovation as of 2018, it had lost production to overseas locations to the point where its industry share was just barely above the global average (1.06x).[7]
Figure 10: Change in global shares of pharmaceutical, medicinal-chemical, and botanical production
Electrical Equipment
Electrical equipment comprises a range of industries, including relays and industrial controls, batteries, fiber optic cables, major household appliances, and switchgears. Many of these segments, such as batteries and also manufacturing equipment and appliances that are increasingly embedded with Internet of things and AI capabilities, are becoming more innovation-driven.
With more than one-third of global production ($205 billion), China led all nations by a wide margin in 2018 (figure 11). The EU-28 minus Germany ranked second with about 12 percent ($74 billion), while Germany had about 9 percent. Even though Japan’s share of the global economy was much lower, both it and the United States produced around 11 percent of the world’s output. Canada, India, Mexico, and Taiwan have very small shares.
Figure 11: Global shares of electrical equipment production, 2018
Japan’s share, however, fell dramatically from 34 percent of global output in the mid-1990s, when many people worried about the “the Japanese economic challenge,” to just 11 percent in 2018 (figure 12). The EU-28 minus Germany fell by 38 percent in that period, while the German and U.S. shares fell by 28 percent and 33 percent, respectively. China’s share increased by an astounding 759 percent. Both Korea and India saw significant increases, but from small bases.
Controlling for GDP size, Germany’s share increased. Meanwhile, because Japan’s economy declined as a share of global GDP, its relative performance in electrical equipment was stable, and remained almost twice as high as the global average. Korea’s relative share increased dramatically. Whereas it specialized in the industry less than the rest of the world in 1995, it had more than twice the size-adjusted average output by 2018.
Interestingly, while the industry’s share of the Chinese economy increased from 1995 to 2006, it had fallen by 2018 because the overall economy grew even faster. The industry became more important in Mexico (although it is still a small share). Of the 10 countries and regions studied, the electrical equipment industry in Canada was the smallest as a relative share of GDP. The United States was second-smallest with a relative share of just 45 percent of the global average, and Mexico was third-smallest. In other words, as a region, NAFTA does not specialize in electrical equipment.
The electrical equipment industry in Canada was the smallest as a relative share of GDP. The United States was second-smallest with a share of just 45 percent of the global average, and Mexico was third-smallest.
Figure 12: Change in global shares of electrical equipment production
Machinery and Equipment
This industry includes a wide array of machinery, such as office machinery, industrial process machinery, engines and turbines, and agricultural equipment.
China leads the world, with one-quarter of global production (figure 13). The EU-28 minus Germany, the United States, Japan, and Germany produce around 16, 15, 14, and 12 percent of the world’s output, respectively. The other nations have very small shares.
Figure 13: Global shares of machinery and equipment production
Japan’s share, however, fell dramatically, from 29 percent in the mid-1990s to just 14 percent in 2018 (figure 14). The EU-28 minus Germany’s share fell slightly (to 16 percent), with German and U.S. shares falling more, by 20 and 26 percent, respectively. China’s share increased by 557 percent. Although growing from a much smaller base, India’s share of global production increased by 256 percent, while Korean and Mexican shares increased around two-thirds each.
Because the share of Japan’s and Germany’s economies declined relative to global GDP, their size-adjusted performance in machinery and equipment increased to the point where they led the 10 nations and regions studied, with more than 2.5 and 2.4 times the average global share, respectively. Korea came in third in relative terms, with 86 percent more specialization than average, and China was fourth with 54 percent more. The industry was significantly underrepresented in the Canadian, Mexican, and U.S. economies.
Only in Canada, the United States, and, surprisingly, China did the industry become less important as a share of their respective national economies from 1995 to 2018, with the United States producing just 62 percent of what it would have produced had it equaled the global average share and the industry getting 24 percent smaller as a share of U.S. GDP. Germany and Japan saw increases in their relative shares of above 40 percent each, while Korea’s relative share increased 50 percent.
Figure 14: Change in global shares of machinery and equipment production
Motor Vehicles
The motor vehicles sector includes not only final producers (e.g., GM, Toyota, BMW) but also suppliers. Because of the rise of alternative-fuel vehicles, especially electric, coupled with the increases in autonomy, the industry is experiencing a new era of innovation.
China ranked first in 2018 with 25 percent of global motor vehicle output (figure 15), a significant accomplishment given that in 1980 the United States had 4,000 times more automobiles per capita than did China. Germany had the second-largest motor vehicle industry with 14.2 percent in the most recent data, and the United States and the EU-28 minus Germany were nearly tied in third and fourth place with 13.5 percent and 13.4 percent, respectively, ahead of Japan in fifth place. Despite the growth of the Korean auto sector, it accounted for just 3 percent of global production, behind Mexico.
Figure 15: Global shares of motor vehicles production, 2018
In terms of change (figure 16), China’s growth was most striking, with its global share increasing almost 460 percent. India also grew rapidly, but from a tiny base. The EU-28 minus Germany saw its global share decline from 17 percent to 13 percent. Canada, Japan, and the United States all saw their shares fall, too—59 percent, 56 percent, and 38 percent, respectively. Korea’s, India’s, and Mexico’s shares increased, albeit from low starting points. Interestingly in the context of the North American trade partnership, the combined shares of Canada and Mexico increased by 18 percent—but with Canada falling and Mexico rising.
Because Germany’s and Japan’s overall shares of the global economy have declined, their relative performance in motor vehicles increased. Germany led the world in 2018 with three times more vehicle production than the global average, and Japan had 1.8 times more. However, Mexico had the second-highest share of motor vehicle production in relative terms, and it was growing faster than any nation or region.
In contrast, the industry became less important in the United States, as the country produced barely more than half of what it would have if it had equaled the average global share. It had the lowest share among the economies that are the focus of this report, which together produce approximately 90 percent of the world’s motor vehicle output. In relative terms, U.S. output was almost as low as that of the nations that produce the other 10 percent—56 percent of the size-adjusted average versus 48 percent.
The motor vehicle industry became less important in the United States, as it produced less than half of what it would have if it equaled the size-adjusted average share.
Canada’s loss was striking. The industry went from being 86 percent larger than the adjusted global average in 1995 to being 25 percent smaller than the global benchmark in 2018. In China, the sector had become slightly less important since 1995, while India saw the industry become more important.
Figure 16: Change in global shares of motor vehicles production
Other Transportation Equipment
Other transportation equipment includes railway stock, aerospace, and ship and boat building. Because aerospace makes up a large share of the U.S. industry, largely because of Boeing, the United States led the world in 2018 with 38 percent of global production (figure 17). In part because of Airbus, the EU-28 minus Germany ranked second with 16 percent. Thanks to its global dominance of the high-speed rail and shipbuilding industries (both built on forced technology transfers and massive subsidies), China ranked third with 12 percent of global production.
Figure 17: Global shares of other transportation equipment production, 2018
The U.S. global market share had risen slightly since 1995, while China’s share had grown 543 percent (figure 18). Japan’s share had cratered, declining 71 percent, while Canada’s share declined 21 percent. The EU’s global share fell 22 percent (perhaps because of China’s significant gain in high-speed rail and shipbuilding industries, sectors the EU was strong in).[8] Japan’s share fell significantly, also in part because of the loss of rail and shipbuilding. The other nations in the study had small shares.
Controlling for size, the United States still led in 2018, presumably because of the strength of Boeing and defense aerospace. Likely because of airplane and train maker Bombardier, Canada’s share equaled Korea’s share, which had declined, perhaps because of China’s dominance in commercial shipbuilding, an industry Korea had been strong in. Because of its lack of commercial airplane production, the industry was underrepresented in China (which is working to remedy this with its massively subsidized producer COMAC). Even with Airbus, the industry made up a smaller share of the EU economy than the global average, as was true for Japan and Mexico.
Figure 18: Change in global shares of other transportation equipment production
Computer, Electronic, and Optical Products
The computer, electronic, and optical products group obviously includes computers and peripheral equipment, but also semiconductors, instruments, and consumer electronics such as televisions. This is clearly an innovation-based sector, in not only computers and semiconductors but also consumer electronics, with developments such as higher-definition TVs and virtual reality systems.
China led the world in 2018 with 25 percent of production (figure 19). The United States, which once led, had fallen to second place, with around 23 percent market share, while Korea accounted for 11 percent.
Figure 19: Global shares of computer, electronic, and optical production
Japan was close to leading the world in 1995, in large part because of its dominant consumer electronics companies and globally competitive semiconductor companies, but its share of global production fell more than 75 percent through 2018 (figure 20). The EU’s share fell by about one-third. In contrast, Korea’s share increased 166 percent, in part because of leading companies such as Samsung, LG, and SK. Canada and the United States saw declining shares.
Taiwan is far and away the global leader in relative terms, with its economy having almost nine times more production than the adjusted global average as of 2018, a reflection of leading companies such as TSMC, UMC, MediaTek, and Acer. No country except Korea came close, with its relative share more than doubling to 5.4 times the size-adjusted global average. China ranked third with 58 percent more production than if its industry accounted for the same share as the industry does globally. This was down from 2.3 times more in 2006. Canada and India are least specialized in this industry (21 percent and 27 percent of the global average, respectively, as of 2018), while the EU-28 minus Germany had about half as much production as the adjusted global average.
In relative terms, Taiwan is far and away the global leader, with its economy having almost nine times more production than the size-adjusted global average.
The United States went from 17 percent above the adjusted global average in 1995 to 3 percent below in 2018, while Japan went from 49 percent above to just 10 percent above. The EU’s relative share also declined slightly.
Figure 20: Change in global shares of computer, electronic, and optical production
IT and Other Information Services
The IT and other information services sector consists primarily of software publishers and Internet companies. As noted, this industry has rapidly grown to be the largest advanced-technology industry in the world.
Figure 21: Global shares of IT and information services, 2018
Not surprisingly, given the global leadership position of companies such as Facebook, Google, and Microsoft, the United States led the world in 2018 with 32 percent of production (figure 21), an increase of almost 6 percentage points from 1995 (figure 22). Despite its protestations of lagging behind and needing “digital sovereignty” (a code word for digital protectionism), the EU ranked second with 26 percent of global market share (20 percent for EU-28 minus Germany and 6 percent for Germany). India edged Japan, even though in 1995 Japan had 12 times more global market share. China was a distant third in 2018, with around 14 percent of production, up from 4 percent in 1995. Taiwan and Mexico had almost no production, and Korea and Canada had less than 2 percent each.
In 1995, the EU-28 ranked first, with almost one-third of global production. But that had fallen 6 percentage points by 2018. Japan ranked third in 1995, but its share of global production fell by two-thirds. With its own national digital champions such as Baidu and Tencent, China’s share of output grew by 255 percent, while India’s grew 367 percent (albeit from a small base), largely because of its massive, offshored services and software industry.[9]
Despite its protestations of lagging behind and needing “digital sovereignty” (a code word for digital protectionism), the EU ranked second in 2018 with 26 percent of global market share.
Controlling for size (figure 22), India was the global leader, with 89 percent more output than the adjusted global average. Surprisingly, given the growth of Chinese digital firms, the relative share of these industries in China has fallen by almost half. And again, notwithstanding EU complaints about lagging behind the United States, the industry has become a more-important part of Germany’s and the rest of the EU-28’s economies. Perhaps because of software and IT services growth in places such as Ireland (a growth rate more than four times faster than the global average from 1995 to 2018), and Eastern European nations such as Bulgaria, Estonia, Latvia, and Lithuania (10, 10, 11, and 38 times faster than the global average, respectively), the industry grew 11 percent as a relative share of the EU-28, with much of this output coming from U.S. firms. Because of the growth of major “tech” firms, the industry’s share of U.S. GDP was 35 percent larger than the adjusted global average. Reflecting their relative weaknesses in software and Internet, and the more rapid growth of hardware, the industry is underrepresented in Korea and Taiwan, and is 95 percent smaller in Mexico than if it represented the global average share. Despite Canadian efforts to attract American tech firms, the industry became a smaller share of its economy from 1995 to 2018.
Figure 22: Change in global shares of IT and information services
Country-by-Country Performance
Countries’ share of global advanced-industry output depends first and foremost on the size of the economy relative to global GDP. This is why the EU, the United States, and China lead (figure 23) and why Japan’s share has dropped so much (figure 24). But relative strength in these industries also matters. For example, advanced-industry output as a share of the Taiwanese economy is 290 percent higher than for Canada. This is why global share of advanced industries in Canada—whose population is about two-thirds larger than Taiwan’s—is lower than Taiwan’s.
When examining advanced industries’ combined output in the aggregate, the EU-28 leads with 23 percent of global production (Germany’s output is more than half of the rest of the EU). The United States leads China, but by only 1 percentage point (23 percent to 22 percent). However, if the 2006 to 2018 trends continued through 2022, China will have become the leader in advanced-industry output. The East Asian nations of Japan, Korea, and Taiwan collectively account for 14 percent of global advanced-industry output.
Figure 23: Global shares of production in Hamilton Index sectors
Given the technology triumphalism in the United States and the technology pessimism in the EU, coupled with its calls for digital sovereignty over the United States, some might be surprised that the EU-28 outperforms the United States both in terms of overall advanced-technology output and industry output as a share of the respective economies’ GDP. Advanced industries have been getting more important in the EU and less so in the United States, although Germany is the principal source of the EU-28’s strength and gains. Take away Germany, and the rest of the EU performs below the global average in advanced industries.
If recent trends continued through 2022, China will have become the leader in advanced-industry output.
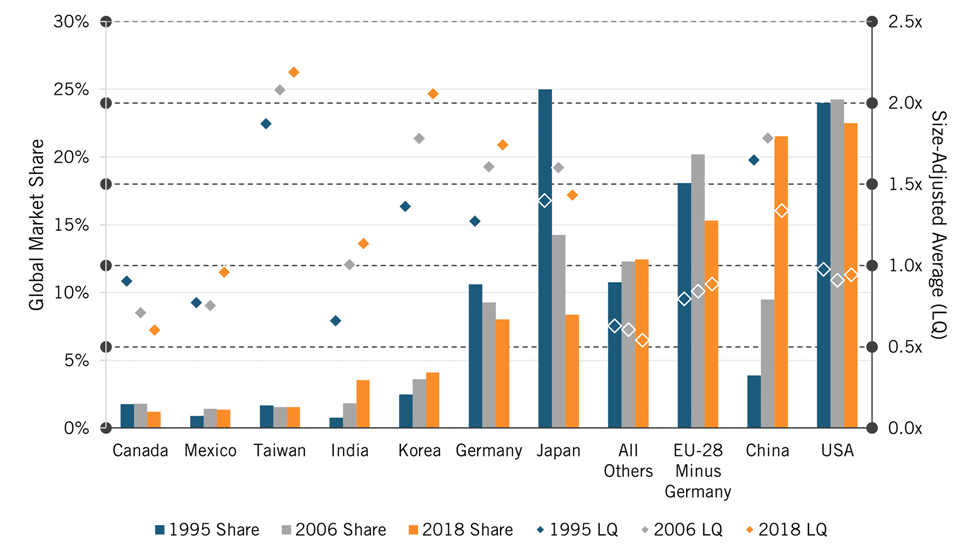
When examining change since 1995 (figure 24), the most striking thing is the drop in Japan’s share by 17 percentage points and China’s growth of 18 percentage points. To paraphrase Clyde Prestowitz’s book title about the U.S. and Japanese competition in the early 1990s, China and Japan have “traded places.” India’s share has also rapidly grown by 365 percent. The EU-28’s share fell. The U.S. share fell slightly. The rest of world’s share increased slightly.
Figure 24: Change in global shares of Hamilton Index production
When examining total advanced-industry output in 2018, the EU-28 still leads, with $1.7 trillion, 4 percent more than the United States and 8 percent more than China. Japan ranks fourth with $602 billion).
However, when it comes to total change in output (in nominal dollars), China leads, expanding by $1.45 trillion from 1995 to 2018 (figure 25). The U.S. was second, with its output growing by $1 trillion, and the EU-28 was third (with or without Germany). Japanese output actually fell by $24 billion. It is important to remember that these figures allow for absolute comparisons, but not relative change as they are in nominal dollars not adjusted for inflation.
Figure 25: Nominal change in advanced-industry production, 1995–2018
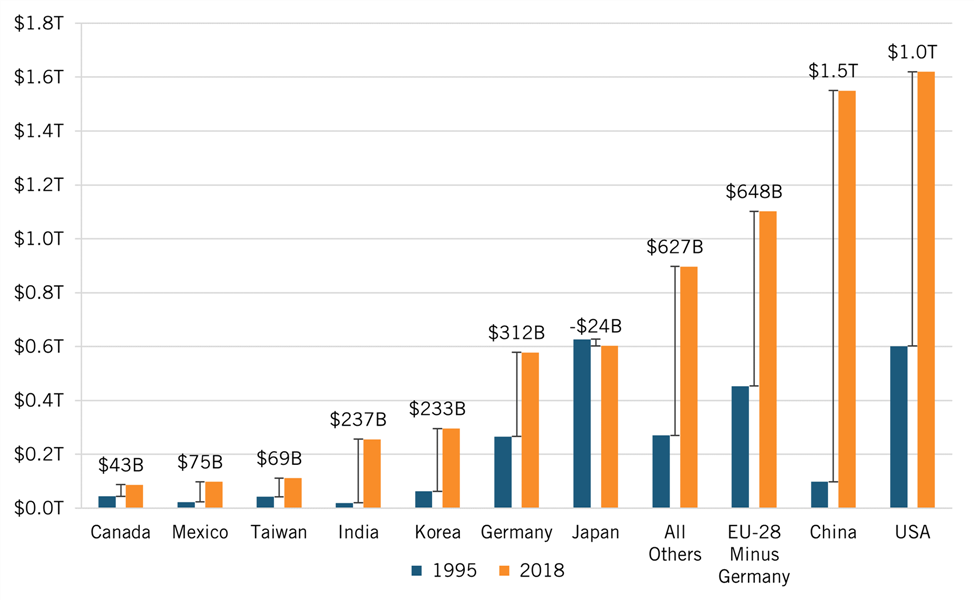
Figure 24 shows a clear pattern when it comes to the size of these industries as a share of national economies: In nations that have prioritized advanced-industry strategies—including China, Germany, Japan, Korea, and Taiwan—advanced industries make up a significantly larger share of their economies than other nations. In contrast, nations that have long believed there is little difference between computer chips and potato chips, so targeting advanced sectors is tantamount to economic sin—namely, the United States and Canada—have much lower shares of advanced industries. The share in Canada and the United States is 40 and 6 percentage points below the global average, respectively. The share is also lower in the EU-28 minus Germany, perhaps in part because of the relative underdevelopment of Eastern Europe, the EU’s over-regulation and embrace of the precautionary principle of regulation, and its preference, if not idolatry of SME’s. Even in India, a country with a per-capita income of just 3 percent of the United States, these industries make up a larger share of their economy than they do in the United States, in large part due to India’s strengths in IT services.
Nations that have long believed there is little difference between computer chips and potato chips have much lower shares of advanced industries.
In the mostly lower-income developing nations of rest of the world, these industries are significantly underrepresented, as would be expected, given the capital and knowledge intensity of advanced industries. In these nations, they account for 53 percent of the global average.
We see the same pattern with change in these industries’ shares of domestic economies, which fell in Canada, the United States and the rest of the world. They also fell in China, largely because the rest of the economy expanded so rapidly, but also because of relatively slow growth in other transportation and software and IT services. In contrast, these industries became more important in Europe, India, Korea, Mexico, and Taiwan (with Korea experiencing the most growth in share). Their share in Japan remained unchanged.
There is one other feature to examine: the degree of industrial diversification. This report calculates the standard deviation between 2018 shares for each country for the seven industries. If each industry represented the same share of the economy as the rest, the standard deviation would be zero. In nations where one or a few industry shares are very high, the standard deviation would be high. As can be seen in figure 26, Taiwan and Korea have the most specialized economies, with very high output in a few sectors (mostly computer and electronic components). Germany and Mexico are lower, but still higher than average, because of their strength in autos—and in the case of Mexico, it’s very small shares in IT services and pharmaceuticals. The EU-28 minus Germany is the most diversified of the eight nations and regions. Canada is second, and the United States is third, in part because of its low share in many industries.
Figure 26: Standard deviations in relative shares of global production in advanced industries
United States
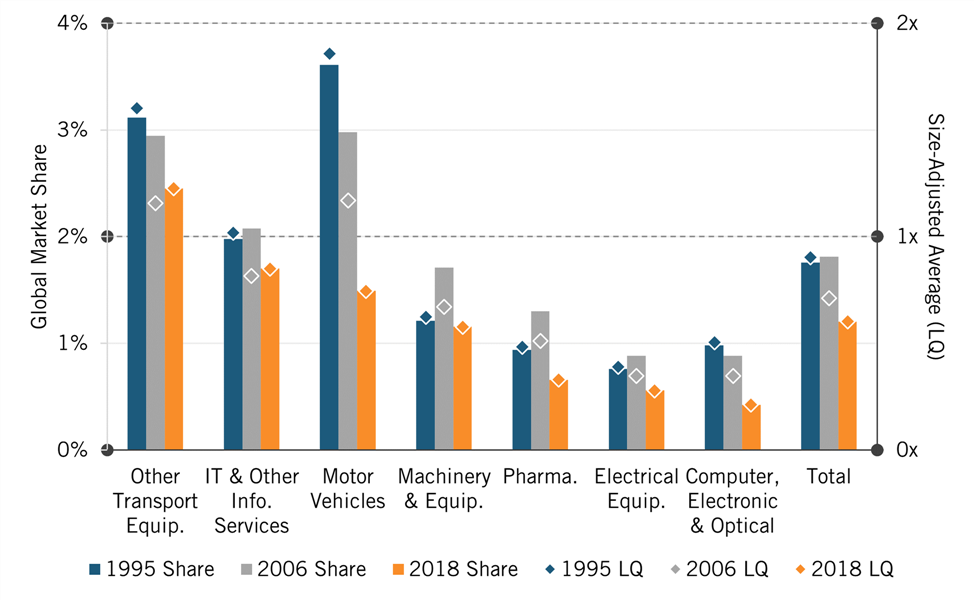
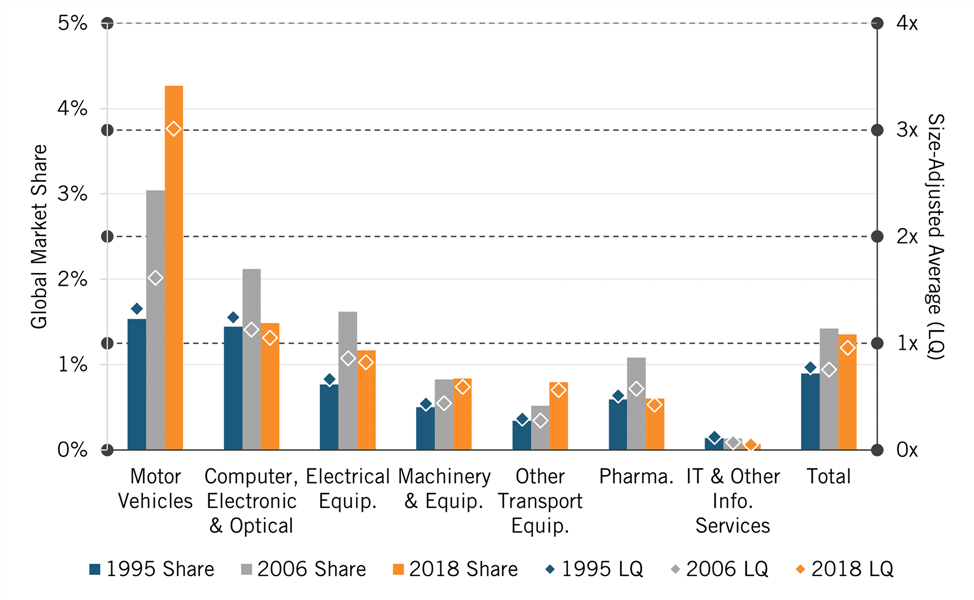
The strongest advanced industries for America in terms of share of global output are other transportation equipment, IT and other information services and pharmaceuticals, in that order. The first two are also the only industries in which America’s share of global output has grown since 1995.
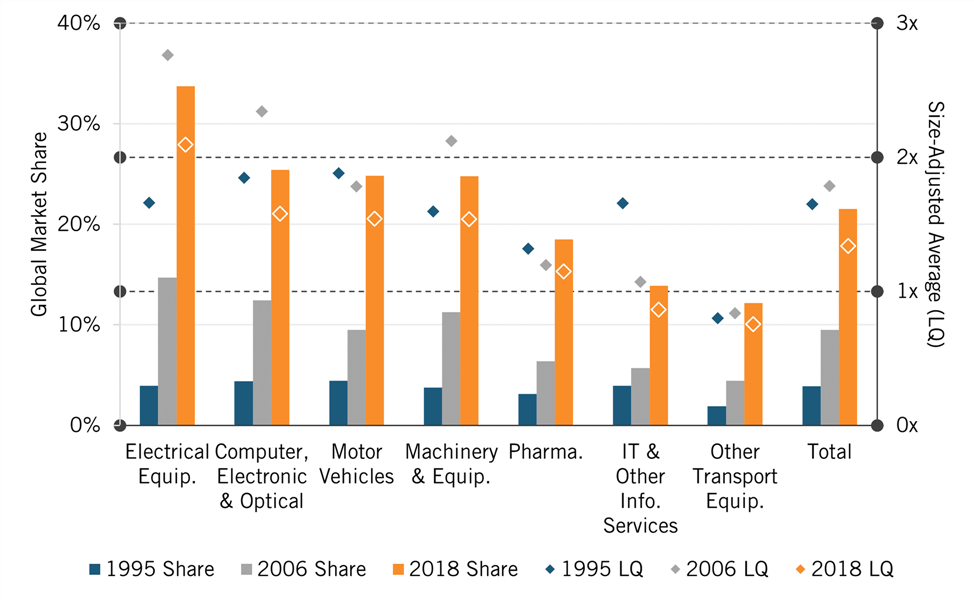
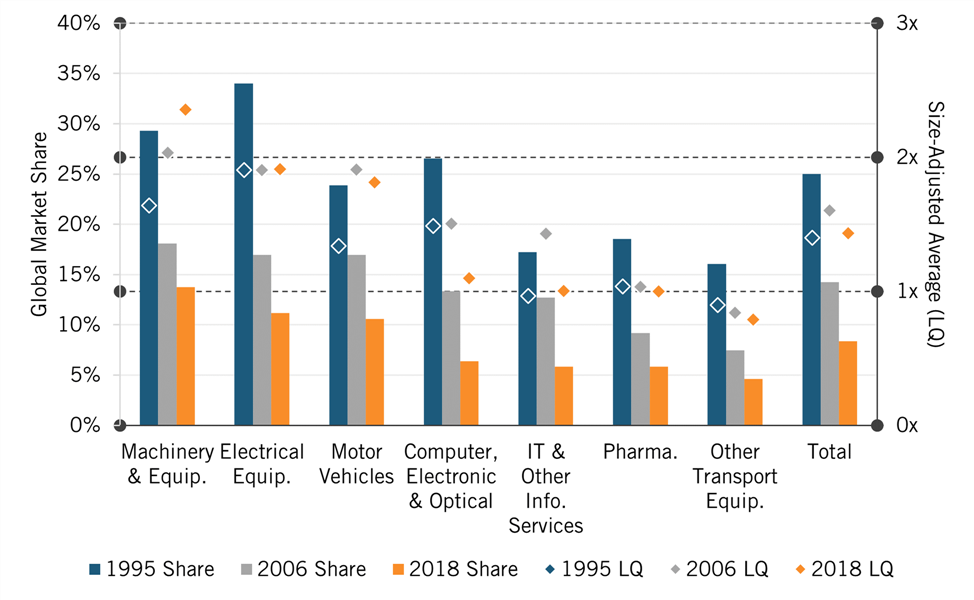
In contrast, the U.S. share in electrical equipment, machinery and equipment, and motor vehicles is quite low (especially when comparing for the size of the U.S. economy), and the United States has lost global share in all three of these industries. Because of the significant growth in the IT and other information services sector, both globally and in the United States, its growth is the main factor why U.S. global share of these industries only declined by 6 percentage points. Leaving out the IT and other information services sector, the U.S. relative share of global advanced-industry output fell by 16 percentage points. In other words, the real strengths of the U.S. software and information sector mask serious weaknesses in most of the rest of America’s advanced industries.
If policymakers wanted U.S. advanced industries to constitute the same share of the U.S. economy as they do in the rest of the world, U.S. advanced-industry output would have to expand by $99 billion annually. To equal China, output would have to expand by 42 percent, or $679 billion annually.
In the midst of significant weaknesses in a number of other sectors, America’s strength in the IT and other information services sector is a saving grace, which is why it is especially troubling to see many policymakers, especially progressives, favor policies such as aggressive antitrust laws and enforcement, which would only weaken U.S. capabilities in the sector. But even though this is a critical sector for U.S. global competitiveness, its success masks deeper vulnerabilities in the overall U.S. advanced-technology sector. Winning in the global competition requires strength across a wide array of advanced industries.
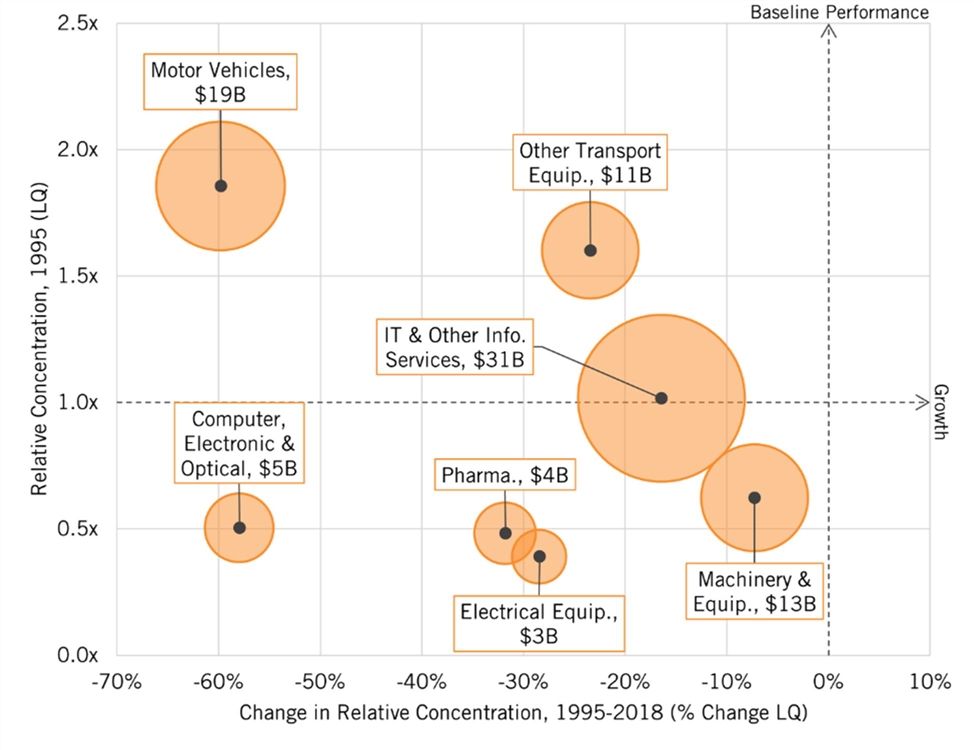
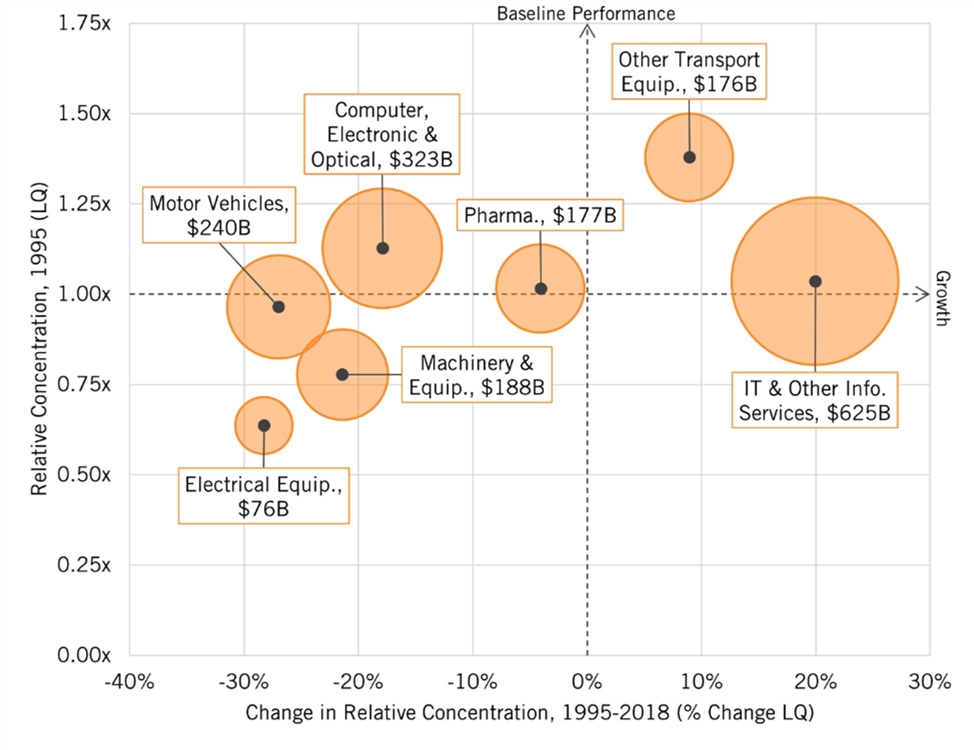
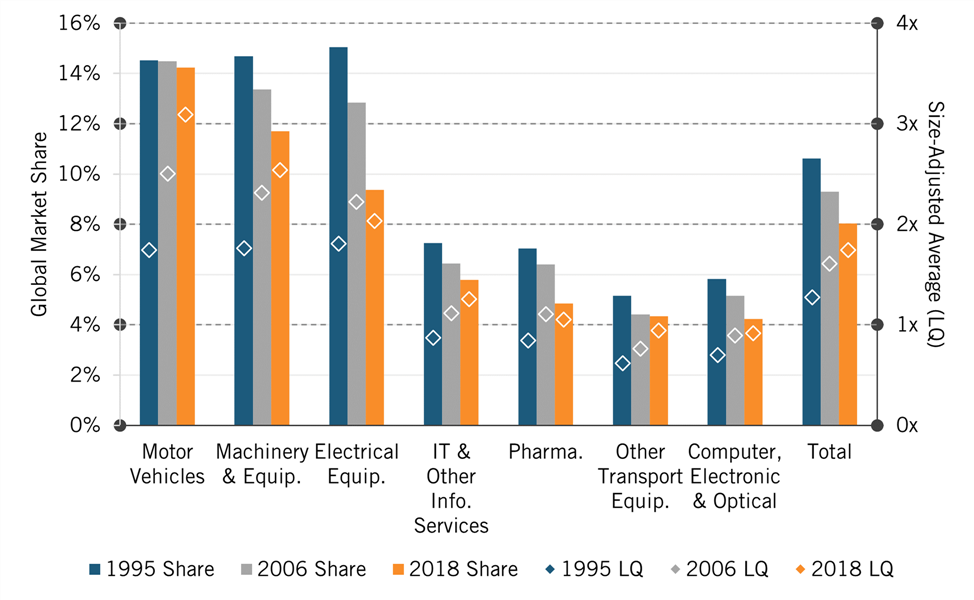
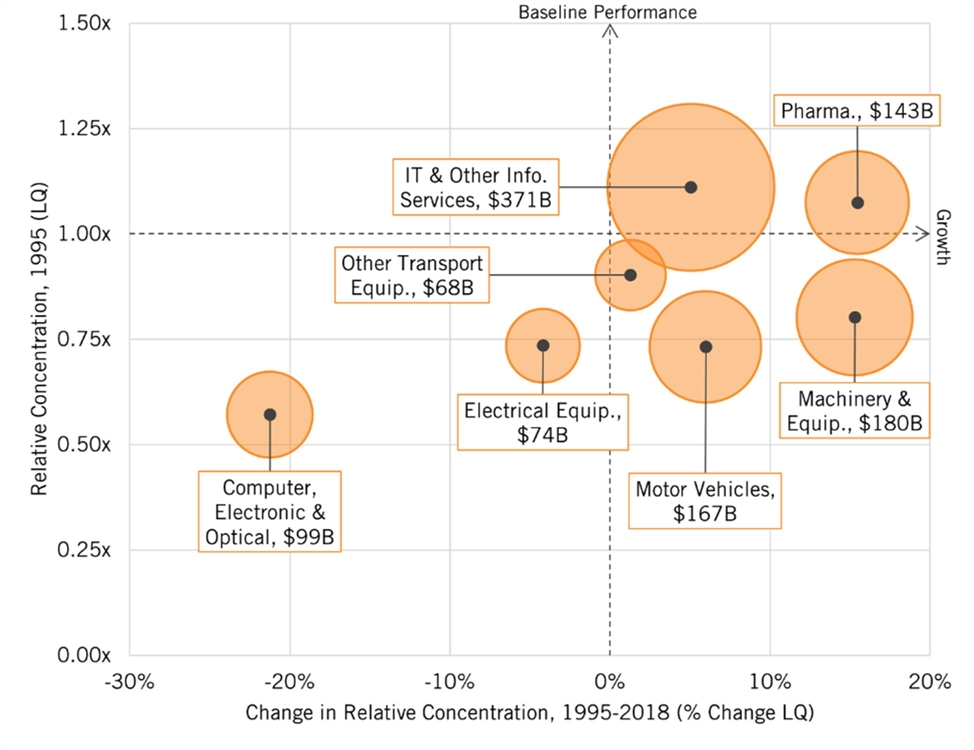
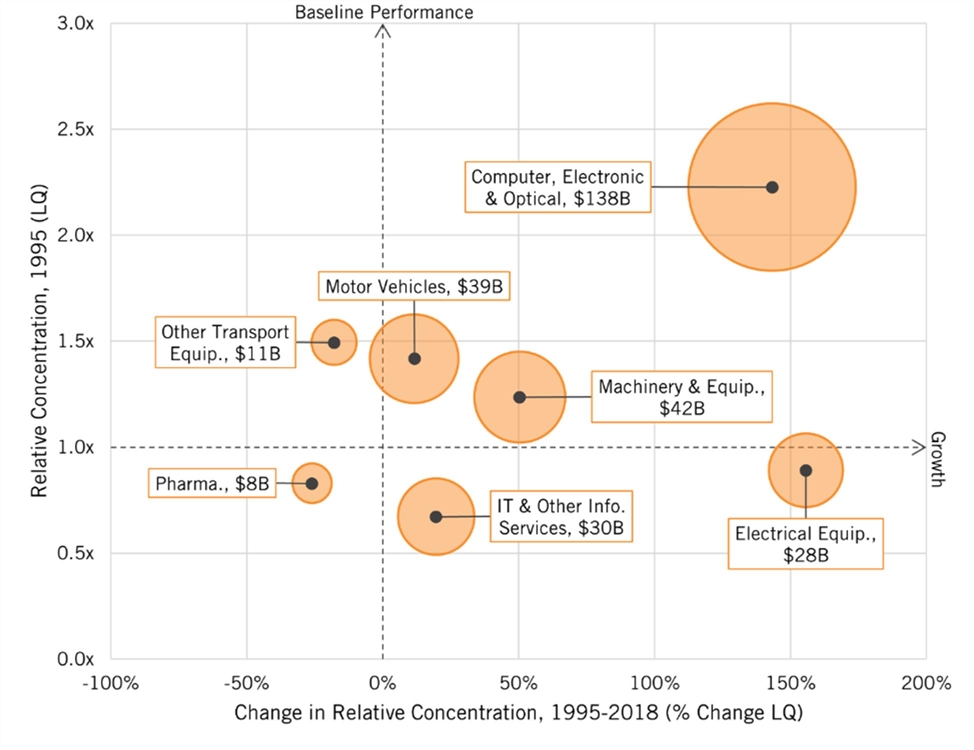
Figure 27: U.S. performance in Hamilton Index industry sectors
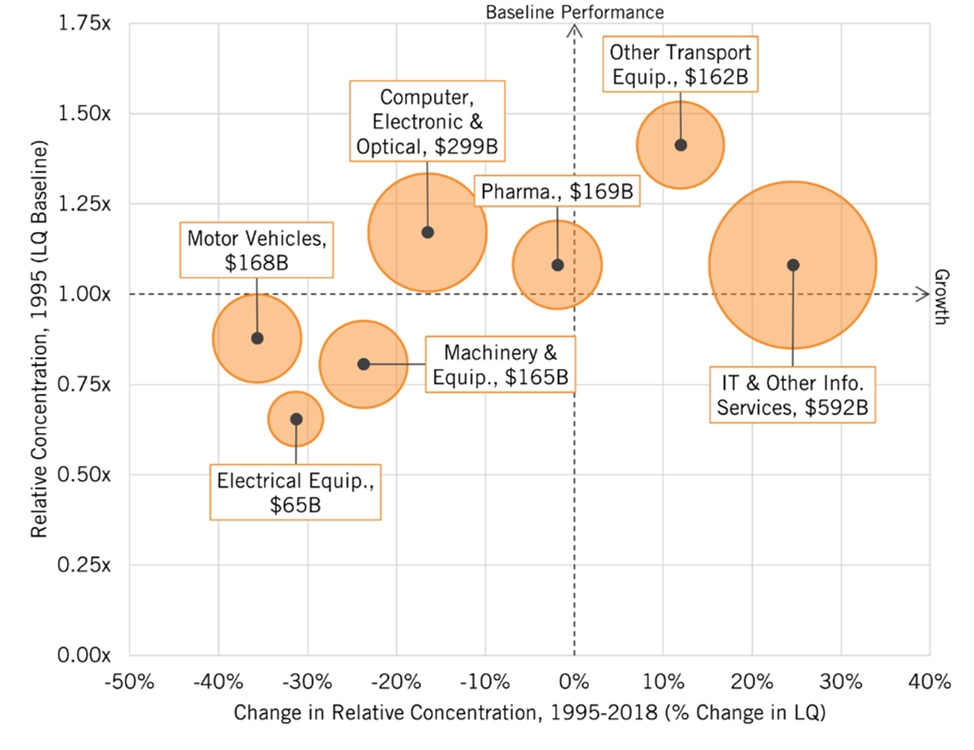
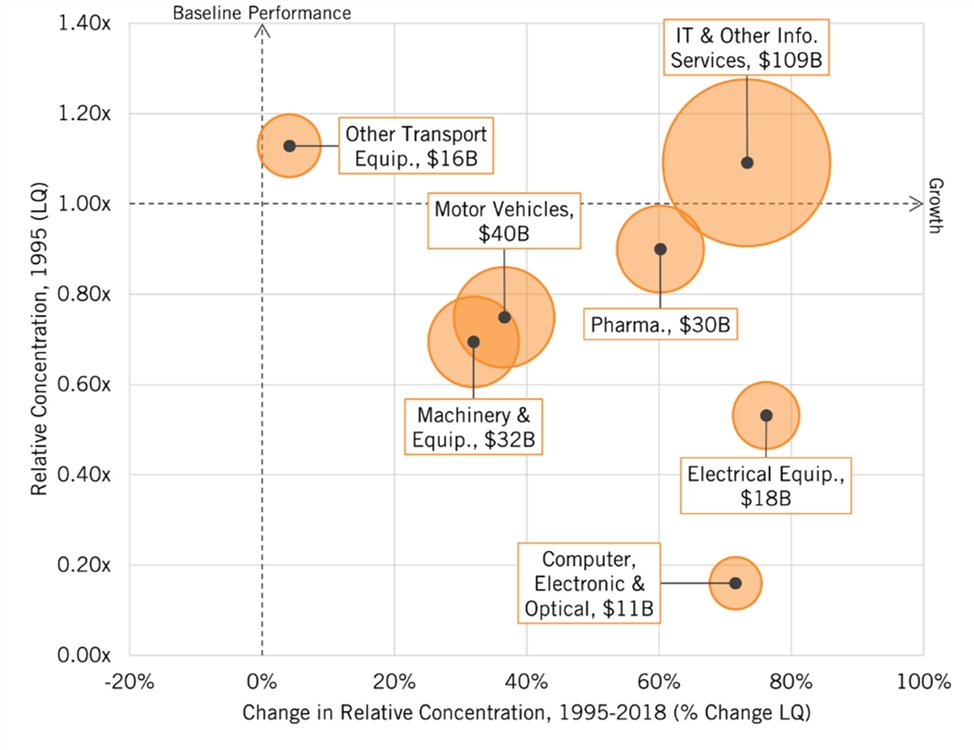
When examining America’s specialization in these industries relative to the rest of the world, the picture is worse. The U.S. share of industries fell for five industries and increased only for other transportation equipment and information services (figure 28). For example, if auto production constituted the same share of the U.S. economy as the industry does as a share of world GDP, the industry would be 77 percent larger, or $130 billion in annual revenue. This would equate to approximately 14 additional auto factories. If policymakers wanted U.S. advanced industries to constitute the same share of the U.S. economy as they do in the rest of the world, U.S. advanced-industry output would have to expand by $99 billion annually. If they wanted U.S. non-IT and information services output to represent the same share of the U.S. economy it does of the world economy, output would have to expand by more than $250 billion, representing 1.2 percent of U.S. GDP. If policymakers wanted U.S. advanced industries to constitute the same share of the U.S. economy as they do in China, then U.S. output would have to expand by 42 percent, or $679 billion annually—3.3 percent of GDP.
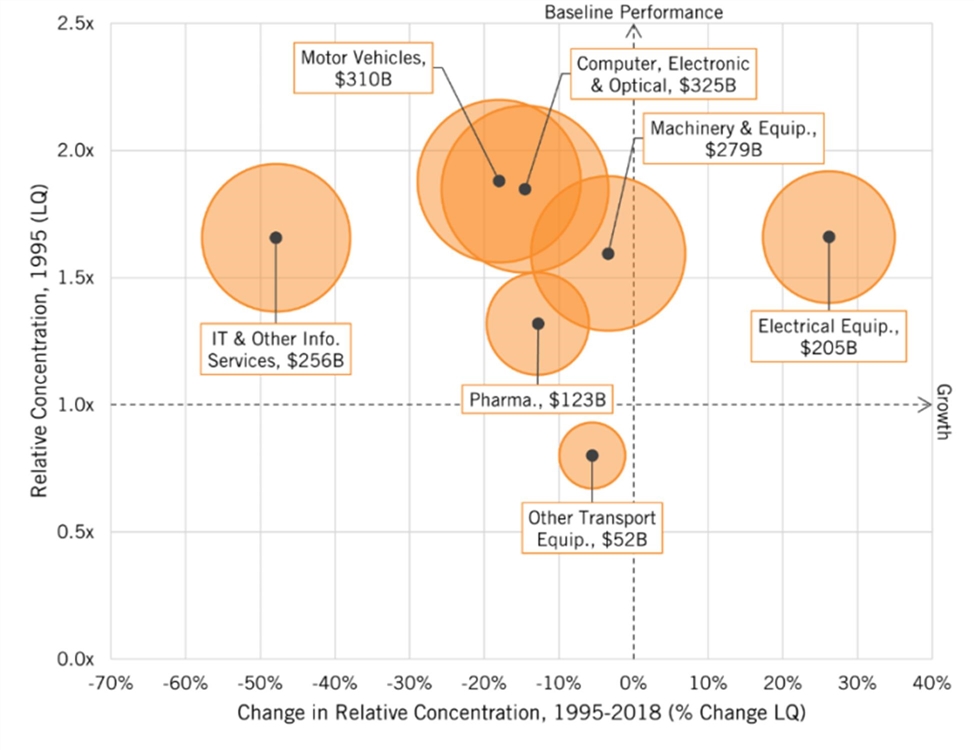
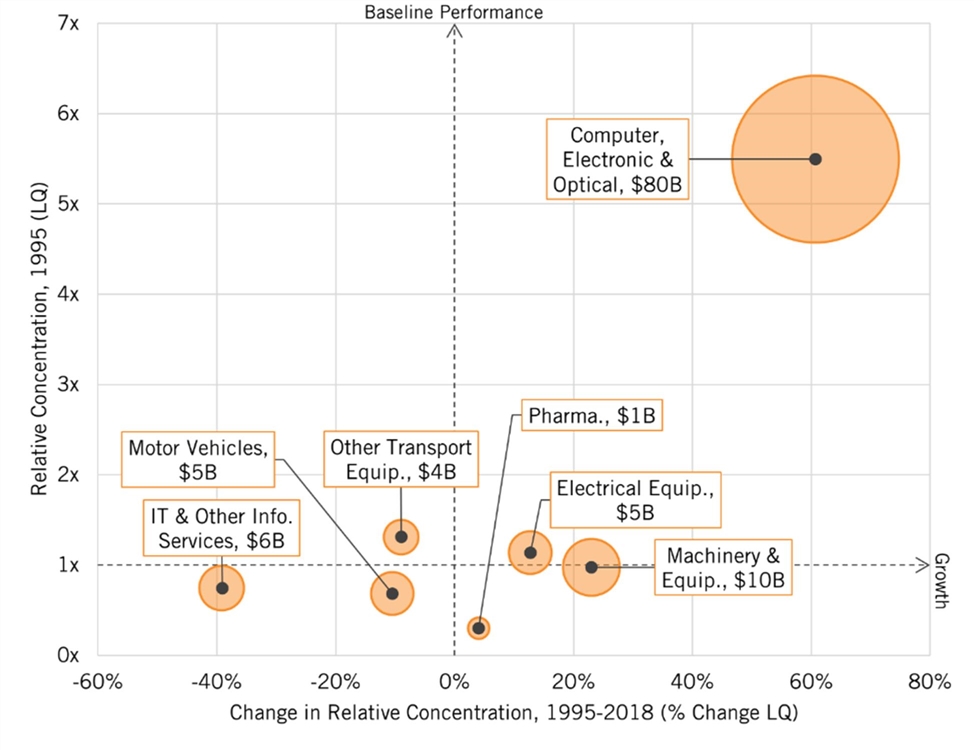
Figure 28: Change in relative concentration of advanced industries in the U.S. economy, 1995–2018 (scaled to production output in 2018)
Canada
Canada lost global market share in all seven industries of the Hamilton Index, with the largest losses in motor vehicles and computer and electronics. Canada’s global share of all advanced industries fell by one-third from 1995 to 2018, from 1.8 percent to 1.2 percent (figure 29).
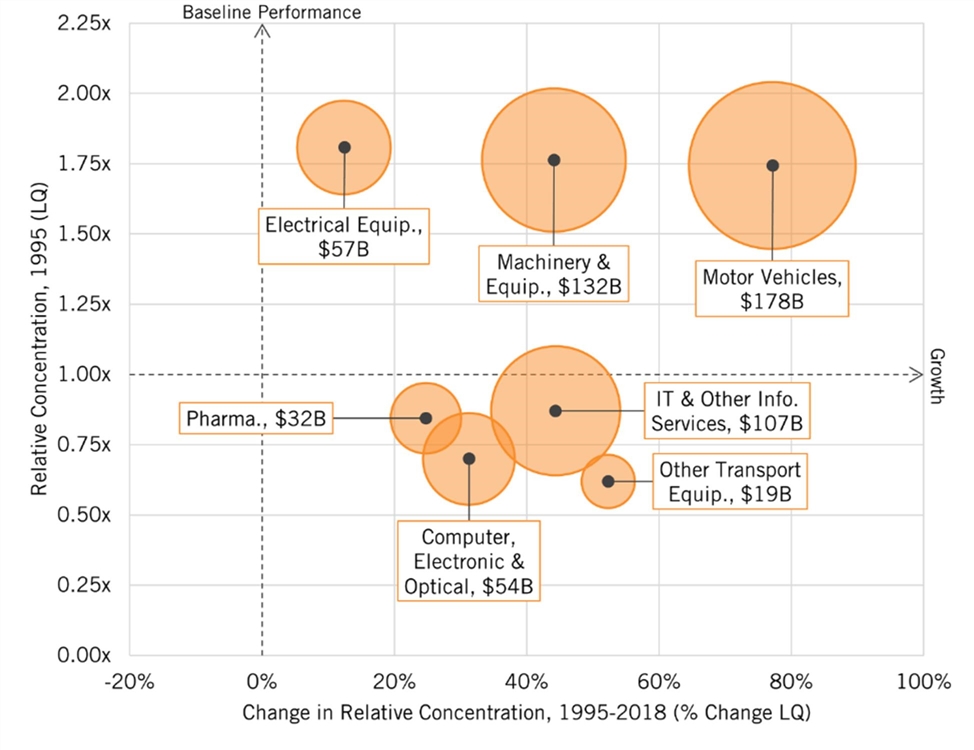
Relative to GDP, Canada’s performance is even weaker. From 1995 to 2018, advanced-industry output as a share of the Canadian economy fell by 33 percent and now stands at just 60 percent of the global average, well below Mexico and barely above the mostly developing countries included as “rest of the world.” If Canadian policymakers wanted it to equal the same share of the Canadian economy as the global average, advanced-industry output would have to increase by two-thirds, or US$57 billion (equal to 3.3 percent of Canadian GDP).
Figure 29: Canada’s performance in Hamilton Index industry sectors
The output of these industries as a share of Canada’s GDP declined in part because of the dramatic decline in the share of motor vehicles (which accounted for 40 percent of advanced-industry output in Canada in 1995, down to 21 percent in 2018), but all seven industries became a smaller share of the Canadian economy.
Figure 30: Change in relative concentration of advanced industries in Canada’s economy, 1995–2018 (scaled to production output in 2018)
Mexico
As more automakers have begun to use Mexico as a production platform to serve North America, Mexico’s specialization in motor vehicles has increased (figure 32). Similarly, Mexico has grown its computer and electrical equipment industry as multinationals have taken advantage of low-wage labor for routine assembly operations. From 1995 to 2018, Mexico’s global share of advanced production increased from 0.9 percent to 1.4 percent. Interestingly, Mexico made progress in advanced industries production from 1995 to 2006, but then its share fell slightly. The initial surge was likely due to the signing of the North American Free Trade Agreement in 1993, while the decline was likely due to China taking market share from what had prior been a lower-wage production platform. This decline is especially apparent in electrical equipment and computer and other electronics, both industries with rapid growth in China.
Figure 31: Mexico’s performance in Hamilton Index industry sectors
On a per-GDP basis, Mexico’s performance has strengthened since 1995, although advanced industries remained marginally underrepresented in 2018 with their share 4 percent less than if they equaled the global average (figure 31). Interestingly, these industries represent a larger share of Mexico’s economy than they do of the U.S. economy. Its performance in pharmaceuticals, computer and electronic equipment, and IT and other services all weakened. In particular, its share of IT and other information services is the lowest of any industry for any country examined here, at just 5 percent of the global average. But growth in auto production outpaced the decline in other sectors, thereby driving up the country’s overall performance in the Hamilton index by nearly 20 percentage points from an LQ of 0.77 in 1995 to 0.96 in 2018.
Figure 32: Change in relative concentration of advanced industries in Mexico’s economy, 1995–2018 (scaled to production output in 2018)
The North American Trading Bloc
As a response to China, there is growing interest in building a globally competitive North American trading and investment bloc, constituting Canada, Mexico, and the United States. Mexican manufacturing wages are now lower than China’s.[10] Moreover, the supply chain linkages between Mexico and the United States are much closer than between China and the United States. On average, $1 of production in China generates 20 cents of production in the United States, whereas the same dollar of production in Mexico generates about 50 cents of production in the United States.[11] In addition, Canada possesses key natural resources and complementary production in certain advanced industries.
However, there is considerable work to be done if this vision is to be realized and yield a greater global market share advanced-industry production. The region’s share fell slightly over the last two decades, with five industries in the Hamilton Index seeing declines (pharma, electrical equipment, machinery and equipment, motor vehicles, and computers and electronic).
Figure 33: The North American trading bloc’s performance in Hamilton Index industry sectors
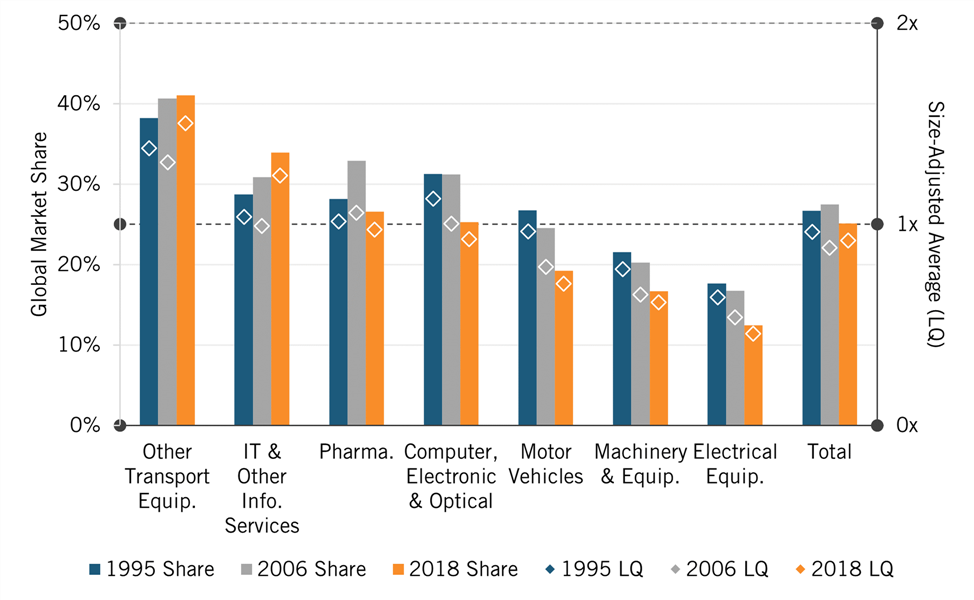
Figure 34: Change in relative concentration of advanced industries in North America, 1995–2018 (scaled to production output in 2018)
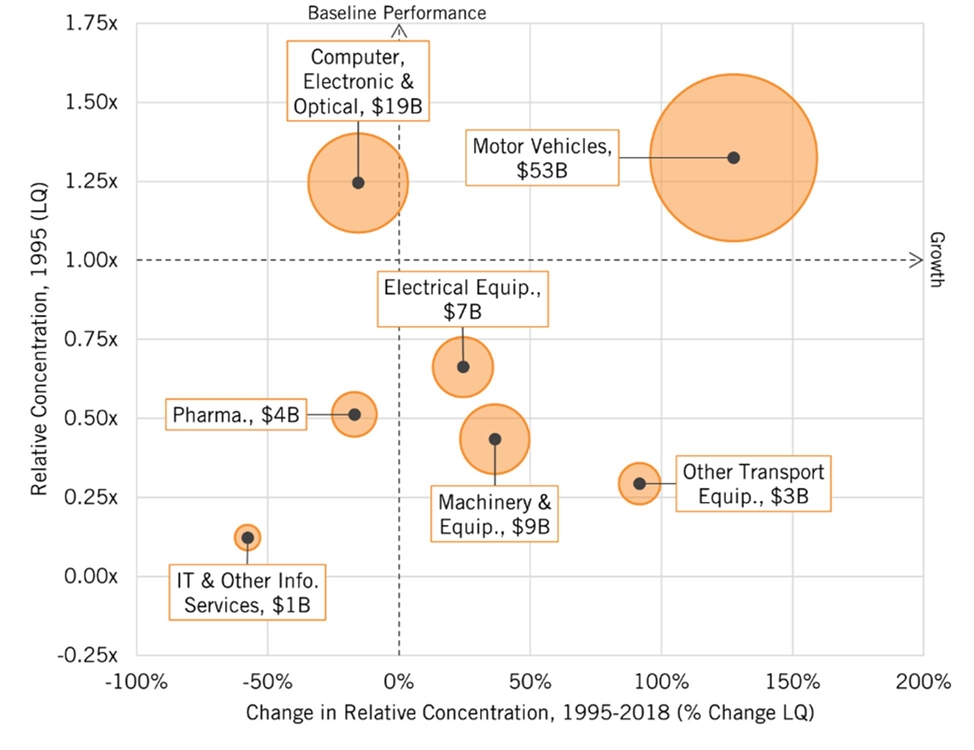
Germany
From 1995 to 2018, Germany’s share of global output declined in all seven industries in the Hamilton Index, and its global share of overall advanced-industry output fell by 2.6 percentage points (figure 35). The decline was particularly large in electrical equipment, an industry where China gained significant share.
However, when looking at Germany’s performance relative to its changing share of global GDP, Germany ranked third, behind Korea and Taiwan. Its size-adjusted share increased in all seven industries, especiallly in motor vehicles. As a share of its economy, Germany’s motor vehicles industry is three times the global average, and its machinery industry 2.5 times the global average. Even its information services industry, an industry German officials regularly bemoan as one in which they are behind America and need “digital soverignty,” has grown since 1995 and now exceeds the global average by 26 percent. Overall, Germany went from having 27 percent more advanced industries output than the global average in 1995 to 74 percent more in 2018.
Figure 35: Germany’s performance in Hamilton Index industry sectors
Even its information services industry, an industry German officials regularly bemoan as one in which they are behind America and need “digital soverignty,” has grown since 1995 and now exceeds the global average by 26 percent.
Figure 36: Change in relative concentration of advanced industries in Germany’s economy, 1995–2018 (scaled to production output in 2018)
EU-28 Minus Germany
The share of global advanced industry output in the EU-28 minus Germany fell by 15 percent from 1995 to 2018, in part because of increase in the value of the Euro which made exports more expensive. The region saw its largest declines in electrical equipment and computer and electronics all areas of rapid growth in China.
However, when controlling for the EU’s shrinking share of the global economy, its advanced-industry performance looks quite different. With the exception of electrical equipment and computer and electronic products, the EU-28 minus Germany maintained or increased its specialization in all industries (figure 37). Notwithstanding EU officials (including those in France), bemoaning Europe’s supposed lack of digital sovereignty, the EU-28 minus Germany actually became slightly more specialized in IT and other services. Overall, with its industry concentration at 89 percent of the global average, the region is only slightly less specialized in advanced-industry production than the United States (94 percent). When the EU-28 is considered as a whole, it is 12 percentage points more specialized than the United States. Hopefully, EU officials will understand this reality and dampen some of their anti-U.S. rhetoric around their need for “digital sovereignty.” China is their real techno-economic challenger, not the United States.
Figure 37: EU-28 minus Germany’s performance in Hamilton Index industry sectors
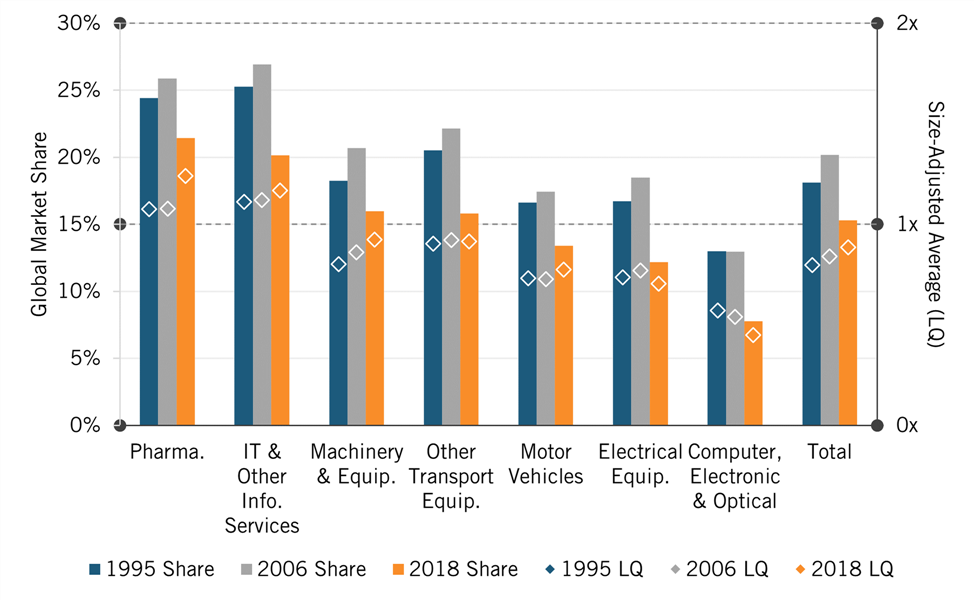
Figure 38: Change in relative concentration of advanced industries in the European Union without Germany, 1995–2018 (scaled to production output in 2018)
China
China’s growth has been phenomenal, from having less than 4 percent of global output in advanced industries in 1995 to 21.5 percent in 2018 (figure 39). Interestingly, this is down from its peak of 22.8 percent in 2015. Its strongest growth was in electrical equipment, where it controls over one-third of global production. Its weakest sector is other transportation equipment, but the government is working to rectify that with mercantilist policies to support its national aerospace champion, COMAC.
When controlling for China’s rapidly growing share of the global economy (as its GDP grew 1,900 percent between 1995 and 2018), the picture changes considerably. China’s size-adjusted global market share in these industries was still much higher than that of the United States in 2018 (134 percent versus 94 percent), but this is down from 178 percent vs. 91 percent in 2006. But this is in part because—while its advanced industries grew rapidly—China’s overall economy grew even faster, resulting in their overall share of the Chinese economy shrinking after 2006. China was focused on a mercantilist export-first strategy for its advanced industries, so there is no way these industries could have expanded as fast as China’s overall economy, because global demand did not grow as fast.
In addition, after 2009, when China’s global share of advanced-industry production peaked, it appears that some industries became less competitive because of rising costs. For example, from 2009 to 2018, China’s location quotient in computer and electronic equipment fell by 27 percent, while Vietnam’s increased 39 percent. At the same time, China made less progress in the other, more advanced industries like biopharmaceuticals, aerospace, and IT and other services compared to technology leaders in more advanced economies.
Figure 39: China’s performance in Hamilton Index industry sectors
China is most specialized in electrical equipment, computer and electronic products, and machinery. And it is least specialized in other transportation equipment and IT and other information services. While Chinese information sector firms such as Baidu and Tencent have grown, including in some overseas markets, its overall software and IT services sector is weak.
As China’s economy grew rapidly, its advanced industries could not keep up, resulting in their overall share of the Chinese economy shrinking after 2006.
Figure 40: Change in relative concentration of advanced industries in China’s economy, 1995–2018 (scaled to production output in 2018)
India
As the Indian economy has grown, albeit from very low levels of development, many of its advanced industries have gained global market share, especially IT and other information services and pharmaceuticals (India is a major provider of active pharmaceutical ingredients). (See figure 42.) Most global IT services firms are located in India, and America is the largest market for Indian IT services suppliers such as TCS, Infosys, Wipro, HCL, Cognizant, and others, which collectively enjoyed some $50 billion in sales to the United States in 2020.[12] India is much weaker in computers and electronics.
When it comes to advanced-industry specialization, India went from being significantly underrepresented in 1995 to being 14 percent above the global average by 2018 (figure 41). India had 44 percent more pharmaceutical production as a share of its economy than the global average in 2018, and 89 percent more IT and other information services. Computer and electronics equipment are significantly underrepresented, which is why the Indian government has put in place protectionist policies to spur the industry’s growth.
Figure 41: India’s performance in Hamilton Index industry sectors
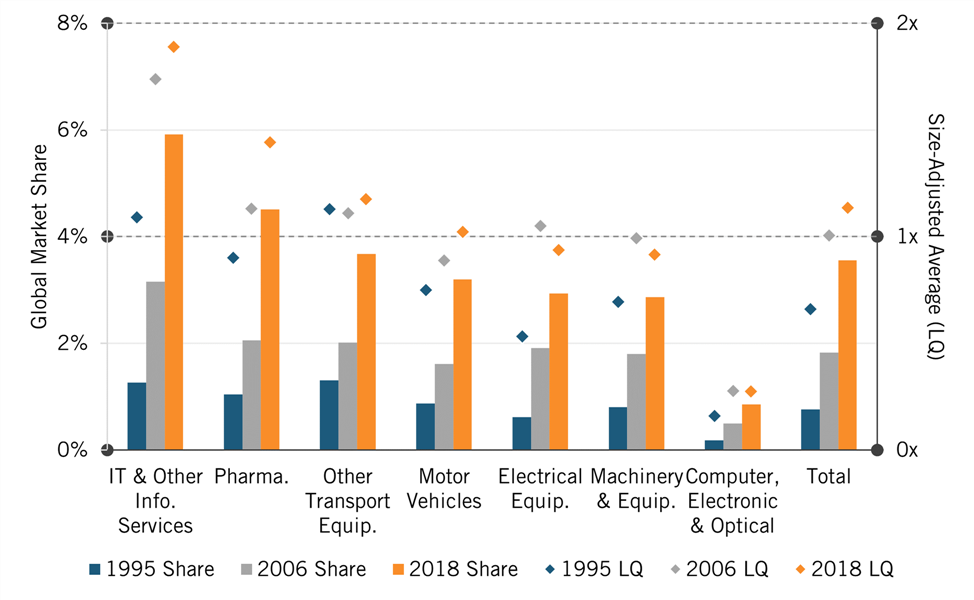
Figure 42: Change in relative concentration of advanced industries in India’s economy, 1995–2018 (scaled to production output in 2018)
Japan
Japan’s share of advanced-industry output has plummeted over the last 25 years, from having a quarter of the global market to just 8 percent—an average yearly loss of almost 0.75 percentage points (figure 43). Japan is weakest in other transportation equipment, the pharmaceutical industry (in part because of the government’s imposition of strict drug price controls), and IT and other information services. Japan’s software and information sector is also underdeveloped. Japan is strongest in electrical equipment, machinery, and motor vehicles (figure 44).
However, when controlling for Japan’s dramatically shrinking share of the global economy, its advanced-industry performance looks quite different, and is actually significantly superior to that of the United States, with more than 50 percent higher concentration, increasing its specialization in machinery and equipment and motor vehicles. Japan’s strong performance in industries other than pharmaceuticals, other transportation equipment, and information services should refute the popular notion that Japan’s industrial and technology policies have been failures. Many opponents of a U.S. advanced-industry strategy point to Japan’s loss of share in global markets as evidence that industrial strategy is doomed to fail. In fact, when controlling for Japan’s declining share of the overall economy—largely driven by demographics—its advanced-industry performance has been stable, and the advanced-industry share of the Japanese economy is significantly greater than in the United States.
Figure 43: Japan’s performance in Hamilton Index industry sectors
Japan’s strong performance in industries other than pharmaceuticals, other transportation equipment, and information services should refute the popular notion that Japan’s industrial and technology policies have been failures.
Figure 44: Change in relative concentration of advanced industries in Japan’s economy, 1995–2018 (scaled to production output in 2018)
Korea
Like China’s, Korea’s advanced-industry performance has been superlative. Its global share of advanced industries increased by 65 percent from 1995 to 2018, from 2.5 to 4.1 percent (figure 45). This increase was especially pronounced in computer and electronics, where Korea now produces almost 11 percent of global output (figure 46), up from around 4 percent in 1995. This has been enabled by leading consumer electronics firms such as LG and Samsung and computer-chip makers SK Hynix and Samsung.
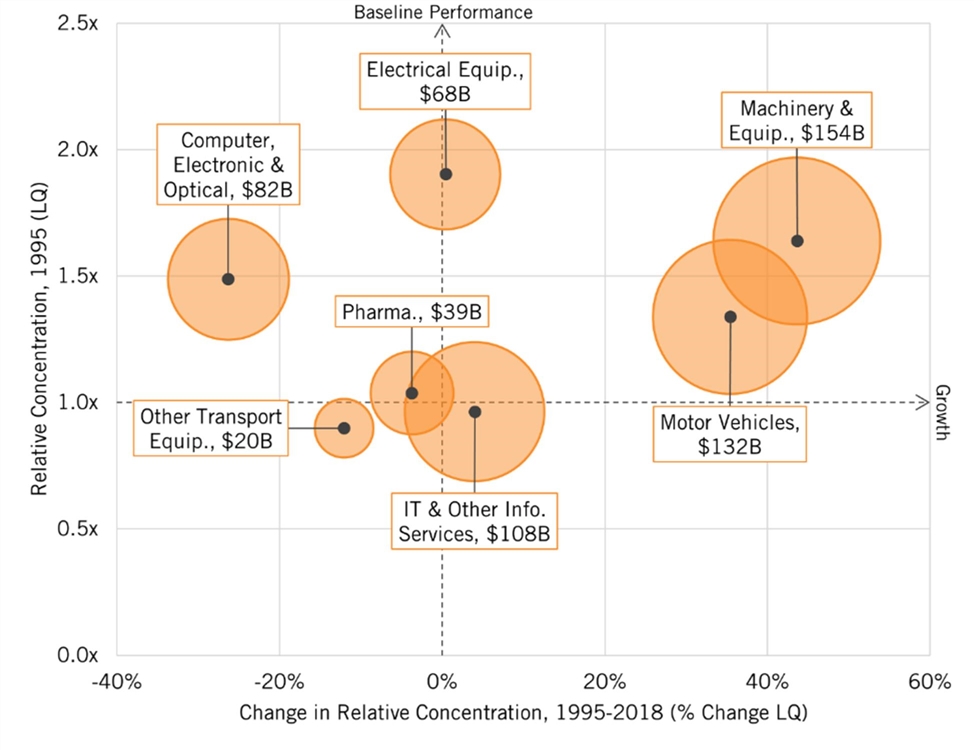
Advanced industries make up a very large share of Korea’s economy: more than double the global average. And their share has increased 56 percent since 1995 (from 11 to 17 percent of Korean GDP). Korea’s relative global market share in the computer and electronics sector is 5.4 times larger than the global average, up from a little more than double in 1995. In contrast, the pharmaceutical and IT and other information services industries are underrepresented compared with the global average, with the former seeing declining share.
Figure 45: Korea’s performance in Hamilton Index industry sectors
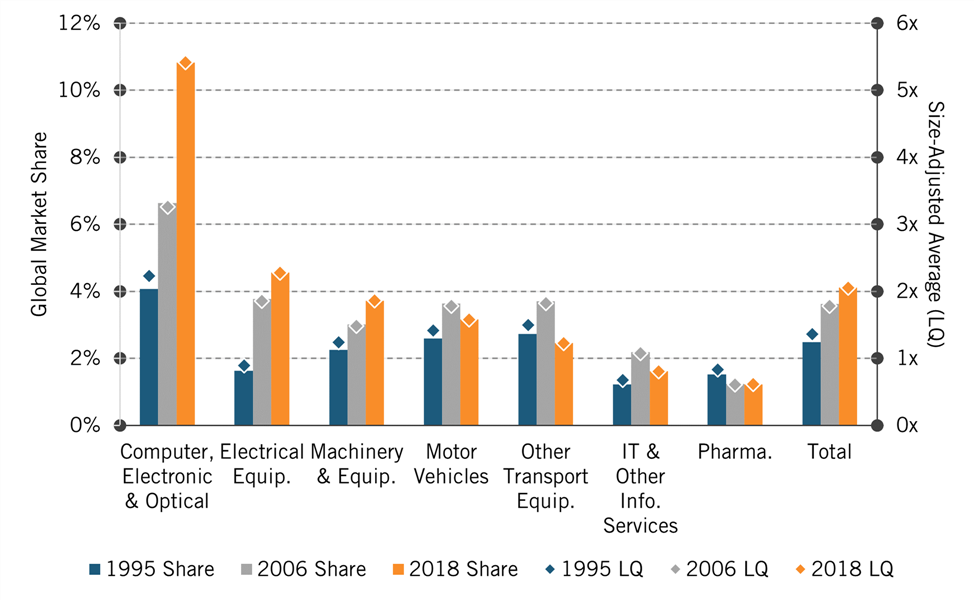
Figure 46: Change in relative concentration of advanced industries in Korea’s economy, 1995–2018 (scaled to production output in 2018)
Taiwan
Taiwan’s global share of advanced-industry production has declined slightly over the last 25 years, with every industry slipping except one: computers and electronic equipment. However, because of leading computer and electronics companies such as Hon Hai Precision Industry and TSMC, its global share in that industry grew by 1.3 percentage points (figure 47).
Taiwan’s advanced-industry economy is the least diversified of the nations and regions studied here. As seen in figure 47, this is because Taiwan has almost nine times more computer and electronics production as a share of its economy than the global average, up from around 5.5 times more in 1995. Because of this, advanced industries make up more than twice the share of its economy as the global average. Taiwan is weakest in pharmaceuticals, automobiles, and IT and other information services.
Figure 47: Taiwan’s performance in Hamilton Index industry sectors
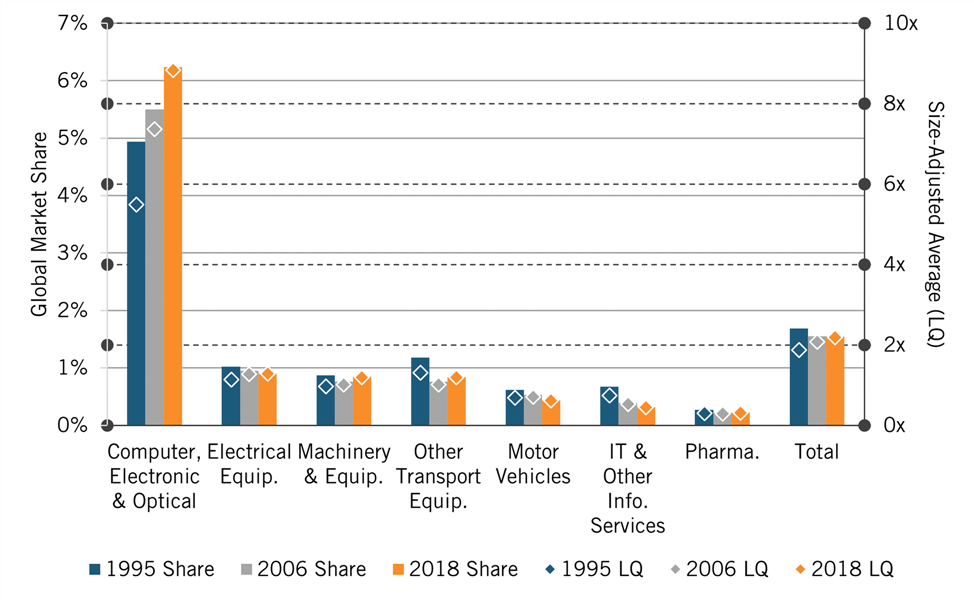
Figure 48: Change in relative concentration of advanced industries in Taiwan’s economy, 1995–2018 (scaled to production output in 2018)
Rest of the World
For this analysis the rest of the world includes mostly developing nations in Latin America, Africa, and Asia. Interestingly, these nations’ global share of advanced production increased in all industries except IT and information services. As a result, whereas in 1995 they accounted for 10.8 percent of global production in Hamilton Index industries, by 2018, they accounted for 12.5 percent.
When it comes to advanced industries’ global market shares as a relative share of their economies, the trend has been down. Compared to their overall share of the global economy, their adjusted share in advanced industries fell from 63 percent in 1995 to 54 percent in 2018. Their shares remained close to level in electrical equipment and computers and electronics, respectively, two industries that have seen higher offshoring rates. But they experienced declines in the rest, especially IT and information services, which saw its relative share fall by 31 percentage points.
Figure 49: Remaining countries’ performance in Hamilton Index industry sectors
Figure 50: Change in relative concentration of advanced industries in the rest of the world, 1995–2018 (scaled to production output in 2018)
Policy Implications
National strength in advanced industries matters. That is why U.S. policymakers should be worried. While the United States ranked second to the EU-28 (including Germany) in 2018 in terms of global market share of the advanced industries that make up ITIF’s Hamilton Index, it is likely that China has now surpassed both the United States and the EU. And when it comes to countries’ global market shares in advanced industries relative to their shares of global GDP, only Canada and the EU-28 minus Germany are weaker than the United States. Korea and Taiwan have more than twice the global average advanced-industry output as a share of their economies, while Germany has 74 percent more. China and Japan, respectively, are 40 and 52 percent more concentrated than the United States. And when America’s strong IT and other services sector is removed, only Canada is weaker.
National policymakers face two critical questions. The first is whether America’s overall weaknesses in advanced industries is acceptable. (ITIF believes, for a variety of reasons, that it is not.)[13]
Assuming policymakers’ answer to the first question would be no, then the second question is, What is the best way to increase America’s relative concentration and global market share of advanced industries?
Staying the course is not the recipe for improvement. America’s past policies—grounded in neoclassical economics and nonintervention, and informed by a marked indifference to the nation’s industrial structure—are what have gotten the country to this point of weakness. However, substituting neoclassical policies with progressive, anticorporate, redistributive ones, including aggressive antitrust policies targeting leading American technology companies, will only make things worse and further accelerate America’s advanced-industry decline.
Th solution is to put in place a national advanced-industry strategy. There are two fundamental ways to do this. The first is to put in place a set of “factor input” policies and hope they have the requisite positive effect. For example, boosting the supply of STEM workers (those in fields of science, technology, engineering, and math) might boost output in key industries. Increasing federal support for scientific and engineering research also might help. The competitiveness legislation that was in conference committee at the time of this report’s publication represents a key step in this direction. Congress should pass and fully fund it, especially the CHIPS Act and the Senate version of the programs focusing on the National Science Foundation (NSF).
Substituting neoclasical policies for progressive, anticorporate, redistributive policies, including aggressive antitrust ones targeting leading American technology companies, will only accelerate America’s advanced-industry decline.
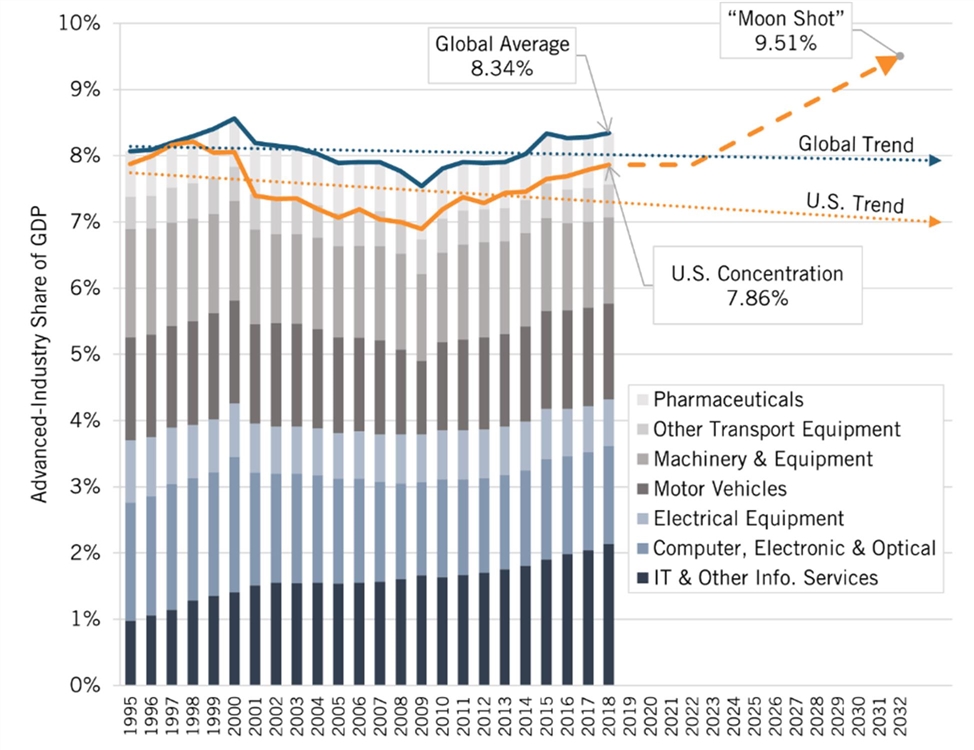
The second approach is to put in place direct incentive policies based on specific quantitative targets and then adjust the programs’ generosity in response to progress toward achieving those goals. Given the importance of advanced industries to America, and its poor performance therein, Congress and the administration should set an ambitious national “moon shot” goal of increasing the relative concentration of advanced industries in the U.S. economy by 20 percentage points in a decade. This would mean increasing the country’s relative concentration in the sectors comprising the Hamilton Index from the most recent baseline figure (0.94) to at least 1.14 by 2032. This would raise the absolute concentration of these advanced industries from 7.86 percent of the U.S. economy to a “moon shot” target of 9.51 percent. (See figure 51.) Assuming a 3 percent growth rate in the rest of the economy, achieving this goal could add nearly $2.5 trillion to the country’s advanced-industry output over 10 years.
Figure 51: Increasing U.S. specialization in advanced industries by 20 percentage points relative to the global average would bring their absolute share of U.S. GDP up to 9.51 percent by 2032
The next key question is, How should the federal government go about meeting this quantitative goal? There are two main ways. The first is through compulsion: forcing firms to produce in the United States with tariffs, Buy American provisions, or both. But there are a number of problems with these measures, especially that they invite tit-for-tat retaliation from other nations. Moreover, these kinds of measures, as well as others, such efforts to lower the value of the dollar or impose a market access charge, could very well reduce the trade deficit, but might not lead to significantly increased advanced-technology production.[14] Instead, the United States might expand exports of lower-wage, lower-tech products and services, such as tourism and textiles.
So, rather than compulsion, the federal government should rely on attraction. To do that, Congress should establish a federal Advanced Technology Industry Fund (ATIF), which would provide incentives to companies in advanced industries and be matched by state and local governments, for building or expanding R&D and advanced production facilities in the United States. This would be similar to the incentives program in the Creating Helpful Incentives to Produce Semiconductors (CHIPS) Act, but it would be applied to a broader set of advanced industries. U.S.-headquartered firms, as well as firms from allied nations, would qualify for incentives. Ideally, Congress would provide at least $25 billion per year, to be matched dollar-for-dollar by state and local governments. To ensure that the investments are widely distributed geographically, there could be limits on how much each state could receive in matching funds for their incentives, based on their share of U.S. population. This program should be run by the Department of Commerce.
Congress could also complement this direct grant program with a targeted tax incentive program, as many lawmakers have proposed for the semiconductor industry. The CHIPS Act provides capital grants, while the FABs Act would provide targeted tax credit for investment in a semiconductor manufacturing facility and semiconductor manufacturing property.
These kinds of capital-focused incentives are critical because U.S. capital markets today reward firms that take an asset-light strategy. In other words, firms are pressured by Wall Street to shed capital assets to boost returns on net assets. All too often, the firms that keep or grow capital assets are foreign. We see this in the semiconductor industry where the United States leads in the fabless sector of the market, but lags in the capital-intensive fab sector. Absent a serious overhaul of the U.S. equity markets, providing incentives to invest in assets such as buildings, machinery, and equipment will be needed to restore U.S. production in capital-heavy advanced industries.
Congress should establish a federal Advanced Technology Industry Fund (ATIF), which would provide incentives to companies in advanced industries and be matched by state and local governments, for building or expanding R&D and advanced production facilities in the United States.
Congress should hold regular hearings to assess whether the country is on track to meet its target of increasing its relative concentration of advanced industries by 20 percentage points, and if it isn’t then lawmakers should consider implementing additional steps to accelerate America’s transition to a more specialized advanced-industry economy. This could mean boosting annual appropriations to the Advanced Technology Industry fund. The United States also needs to dramatically expand its statistical analytical capabilities so that it can more readily and regularly undertake these types of analyses.[15]
Achieving a 20 percentage point increase in advanced-industry concentration would reduce U.S. supply chain vulnerability, create millions of good jobs, boost U.S. GDP growth, weaken China’s economy, and shore up dual-use industries critical to U.S. national defense. Doing this would create more demand for and use of federal investments in research, infrastructure, and skills. Rather than “push on the string” of the supply of competitiveness inputs, this would entail boosting the demand for them by ensuring more advanced-industry output in the United States.
The process of rebuilding America’s advanced-technology production base will be hard at first, because so much has been lost. But strength begets strength. More advanced-sector firms will give rise to more advanced-industry suppliers and more workers attracted to working in these industries and gaining needed skills. Once America regains momentum, it will be easier to grow advanced industries at a more robust pace. But a turnaround requires game-changing policies, not more of the same or even more process-based incentives (better tech-transfer policies, more STEM education and high-skill immigration, etc.), as important as they are.
Why not just let states and cities do this? All states and many cities, led by both Democrats and Republicans, already have incentive programs to attract firms. But while these sometimes might be large enough to attract firms considering a move or new investment within the United States to their jurisdiction, they are insufficient to change the global playing field because states simply cannot compete fiscally with other countries. Only the federal government can do that. Moreover, many subnational incentives are focused on industries that are far from strategic, and many simply lead a firm to relocate from one U.S. state to another.
What about WTO rules on subsidies? First, it’s important to realize that the WTO subsidy regime is an utter failure. China, a nation that has likely provided more industrial subsidies in the last two decades than all other nations combined, has never had a WTO ruling against its subsidies. Moreover, according to WTO rules, subsidies are problematic if they are contingent upon export performance or the use of domestic over imported goods.[16] An advanced-industry incentives program would not be made contingent on either, but rather on increasing the concentration of key industries relative to U.S. GDP to support U.S. national security.
Also, to be clear, this is not autarky. The goal here is not self-sufficiency (although it is to reduce allied-nation dependence on China), or a withdrawal from the global trading system. With the exception of trade in data, the EU participates in the global trading system, and it has a higher share of advanced industries than the United States does. Japan, Korea, and Taiwan trade globally, but they are also strong in advanced industries. The United States can walk and chew gum at the same time by building up its advanced industries and being a robust global trade participant. In fact, the former is required for the latter, because a big reason why so many Americans have turned away from trade and globalization is because the United States has lost market share and jobs.
Congress and the administration should set an ambitious “moon shot” goal of increasing the relative concentration of advanced industries in the U.S. economy by 20 percentage points in a decade.
Finally, this kind of effort might would be needed less if the U.S. dollar were not the global reserve currency. But it is, and it shows no signs of not being one. This reserve status means the value of the dollar does not fall, even as the nation runs an almost $1 trillion annual trade deficit. Because of this, U.S. exports are higher-priced, imports are lower-priced, and foreign investment in the United States is less valuable. A federal ATIF would help offset this problem while being more strategic in focusing on the most important industries for America’s future.
Conclusion
Unless policymakers are satisfied with the United States fading even further into the global economic background when it comes to advanced industries, and losing the power and security that comes with advanced-industry strength, Washington needs to not only monitor U.S. performance in advanced-industry production, but put in place straightforward and easy-to-administer incentives to induce U.S. and allied-based companies in advanced industries to invest more in America.
Acknowledgments
The author would like to thank Randolph Court for his contributions in editing this report, creating the charts, and building the time-series dataset behind the accompanying data visualization. The author also would like to acknowledge Luke Dascoli for assistance with data collection and analytics, and would like to thank Stephen Ezell and Kristen Cotter for their editorial review and assistance.
About the Author
Robert D. Atkinson (@RobAtkinsonITIF) is the founder and president of ITIF. Atkinson’s books include Big Is Beautiful: Debunking the Myth of Small Business (MIT, 2018), Innovation Economics: The Race for Global Advantage (Yale, 2012), Supply-Side Follies: Why Conservative Economics Fails, Liberal Economics Falters, and Innovation Economics Is the Answer (Rowman Littlefield, 2007), and The Past and Future of America’s Economy: Long Waves of Innovation That Power Cycles of Growth (Edward Elgar, 2005). Atkinson holds a Ph.D. in city and regional planning from the University of North Carolina, Chapel Hill.
About ITIF
The Information Technology and Innovation Foundation (ITIF) is an independent, nonprofit, nonpartisan research and educational institute focusing on the intersection of technological innovation and public policy. Recognized by its peers in the think tank community as the global center of excellence for science and technology policy, ITIF’s mission is to formulate and promote policy solutions that accelerate innovation and boost productivity to spur growth, opportunity, and progress.
For more information, visit itif.org.
Endnotes
[1]. Stefan J. Link, Forging Global Fordism: Nazi Germany, Soviet Russia, and the Contest over the Industrial Order (Princeton: Princeton University Press, 2020).
[2]. Robert D. Atkinson, “Why America Should Compete to Win in Advanced Industries” (ITIF, April 2022), https://itif.org/publications/2022/04/11/why-america-should-compete-win-advanced-industries.
[3]. U.S. Government Accountability Office, “Defense Supplier Base: Challenges and Policy Considerations Regarding Offshoring and Foreign Investment Risks,” September 5, 2019, accessed May 5, 2022, https://www.gao.gov/products/gao-19-516.
[4]. The White House, Building Resilient Supply Chains, Revitalizing American Manufacturing, and Fostering Broad-Based Growth (Washington DC: The White House, 2021), https://www.whitehouse.gov/wp-content/uploads/2021/06/100-day-supply-chain-review-report.pdf.
[5]. Sridhar Kota and Tom Mahoney, “Invent here, manufacture here,” The Hill, February 13, 2022, https://thehill.com/opinion/finance/594042-invent-here-manufacture-here/.
[6]. Organization for Economic Cooperation and Development (OECD), Trade in Value Added (TiVA) 2021 ed: Principal Indicators (accessed April 6, 2022), https://stats.oecd.org/Index.aspx?DataSetCode=TIVA_2021_C1.
[7]. Stephen Ezell, “Going, Going, Gone? To Stay Competitive in Biopharmaceuticals, America Must Learn From Its Semiconductor Mistakes” (ITIF, November 2021), https://itif.org/publications/2021/11/22/going-going-gone-stay-competitive-biopharmaceuticals-america-must-learn-its.
[8]. Nigel Cory, “Heading Off Track: The Impact of China’s Mercantilist Policies on Global High-Speed Rail Innovation” (ITIF, April 2021), https://itif.org/publications/2021/04/26/heading-track-impact-chinas-mercantilist-policies-global-high-speed-rail.
[9]. David Moschella and Robert D. Atkinson, “India Is an Essential Counterweight to China—and the Next Great U.S. Dependency” (ITIF, April 2021), https://itif.org/publications/2021/04/12/india-essential-counterweight-china-and-next-great-us-dependency.
[10]. NAPS, “Mexico vs. China Manufacturing: How the Two Countries Compare,” last updated September 30, 2019, https://napsintl.com/manufacturing-in-mexico/mexico-vs-china-manufacturing-comparison.
[11]. Stephen J. Ezell and Caleb Foote, “Global Trade Interdependence: U.S. Trade Linkages With Korea, Mexico, and Taiwan” (ITIF, June 2019), https://itif.org/publications/2019/06/25/global-trade-interdependence-us-trade-linkages-korea-mexico-and-taiwan.
[12]. David Moschella, “Is India the Next Great U.S. Dependency?” (ITIF, May 2021), https://itif.org/publications/2021/05/18/india-next-great-us-dependency.
[13]. Atkinson, “Why America Should Compete to Win in Advanced Industries.”
[14]. John R. Hansen, “Why the Market Access Charge Is Necessary to Fix Trade Imbalances,” Coalition for a Prosperous America, September 8, 2017, https://prosperousamerica.org/why_the_market_access_charge_is_necessary_to_fix_trade_imbalances.
[15]. Robert D. Atkinson, “Federal Statistical Needs for a National Advanced Industry and Technology Strategy” (ITIF, July 2021), https://itif.org/publications/2021/07/01/federal-statistical-needs-national-advanced-industry-and-technology-strategy.
[16]. U.S. International Trade Administration, “Trade Guide: WTO Subsidies,” webpage accessed April 7, 2022, https://www.trade.gov/trade-guide-wto-subsidies.
