
The Economics of Biopharmaceutical Innovation: Symposium Report
Investments in biopharmaceutical innovation and expenditures on medicines themselves both produce tremendous societal returns. Maintaining the robust innovation ecosystem necessary to capitalize on these benefits requires the right mix of “push” and “pull” incentives.
KEY TAKEAWAYS
Key Takeaways
Contents
Longevity and Health Benefits Provided by Pharmaceutical Innovation. 3
David Cutler: Pharmaceutical Contributions to U.S. Life Expectancy, 1990 to 2015. 3
Related Research Documenting the Benefits of Biopharmaceutical Innovation. 5
Who’s Benefiting? Changes in Who’s Capturing the Share of Pharmaceutical Revenues 6
Andrew Brownlee: Understanding the Pharmaceutical Supply Chain. 7
Neeraj Sood: Examining Returns to Actors in the Pharmaceutical Supply Chain. 9
Distribution of Revenues Across the Pharmaceutical Supply Chain. 9
Economic Profitability of Actors in the Pharmaceutical Supply Chain. 10
The Growing Role of Middlemen in the U.S. Pharmaceutical Supply Chain. 14
Who Should Benefit? The Relationship Between Revenue and R&D. 17
Enhancing the Incentives to Innovate. 19
Margaret Kyle: The Alignment of Innovation Policy and Social Welfare. 19
Kristina Acri: Patent Term Restoration and the Drug Innovation Paradox 24
Introduction
In recent decades, biopharmaceutical innovations have contributed significantly to improved life expectancy in the United States and globally. However, promoting biopharmaceutical innovation requires policy that is more than just about investing in research. It requires that policymakers be continually attuned to advancing a conducive policy environment that sustains a productive biomedical innovation ecosystem.
In May 2022, the Information Technology and Innovation Foundation (ITIF) hosted a symposium titled the “Economics of Biopharmaceutical Innovation” at which leading scholars presented recent research related to various facets of this topic. Presentations were made by David Cutler, the Otto Eckstein professor of applied economics at Harvard University; Andrew Brownlee, an associate director at the Berkely Research Group; Neeraj Sood, professor and vice dean for research at the USC Price School of Public Policy; Margaret Kyle, a professor of economics at MINES Paris Tech; and Kristina Acri, an associate professor of economics and chair of the Department of Economics and Business at Colorado College.
Nations, including the United States, that wish to lead in the output of biopharmaceutical innovation must be continually attuned to advancing a conducive policy environment that sustains a productive biomedical innovation ecosystem.
Three empirically grounded themes emerged during the presentations:
1. Pharmaceutical innovations have resulted and will continue to result in immense benefits for society, which can be measured directly through increases in life expectancy itself (not to mention improvements in individuals’ quality of life or ancillary societal benefits, such as fewer missed workdays, decreased use of disability insurance, and increased economic productivity).
2. A growing share of revenues from drug sales has been accruing to middlemen in the supply chain, as opposed to the companies that are innovating and manufacturing the drugs. This is concerning because these stakeholders devote a much smaller share of their revenues to R&D compared with biopharmaceutical companies. Therefore, a larger share of proceeds captured by these stakeholders implies less R&D activity and fewer innovations that benefit society.
3. U.S. life-sciences innovation policies have generally been working well, though this dynamic needs to be maintained. However, policymakers should always be seeking to deploy an optimal mix of “push” and “pull” incentives to stimulate breakthrough biopharmaceutical innovation.
The first presentation sought to quantitatively estimate the direct contributions of biopharmaceutical innovation on society using life expectancy as its key measurement indicator.
Longevity and Health Benefits Provided by Pharmaceutical Innovation
David Cutler: Pharmaceutical Contributions to U.S. Life Expectancy, 1990 to 2015
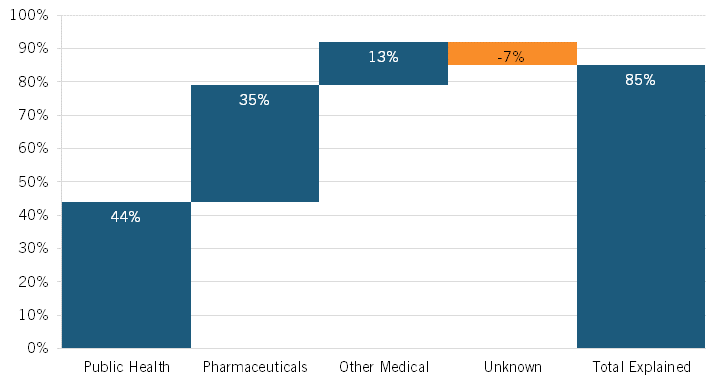
David Cutler presented a 2020 paper coauthored with Jason Buxbaum et al. regarding the contributions of public health interventions, pharmaceuticals, nonpharmaceutical medical care, and other/unknown factors to the increase in life expectancy in the United States between 1990 and 2015.[1]
During this period, life expectancy at birth in the United States increased by 3.3 years, from 75.4 to 78.7 years. Noting that heretofore “the drivers of this increase [were] not well understood,” the authors leveraged vital statistics data and cause-deletion analysis techniques to identify which factors—such as public health interventions, pharmaceuticals, medical care, or other factors—contributed to the improvement.[2] They found that 12 conditions were most responsible for changing U.S. life expectancy, explaining 2.9 years of net improvement (85 percent of the total). Overall, the authors concluded that public health interventions accounted for 44 percent of the increase in U.S. life expectancy during this period, with pharmaceuticals accounting for a quite significant increase as well: 35 percent. (See figure 1.) The authors found that the single biggest factor contributing to extended U.S. life expectancy over this period was a decrease in ischemic heart disease—a result of several factors, including better individual health care, more effective public health interventions and medical responses, and innovative drugs—with 1.76 years of life being gained, or just over half (53 percent) of the 3.3-year total.
Significant contributions to mortality reduction (i.e., increased life expectancy) from 1990 to 2015 were made across a range of disease areas wherein the use of pharmaceuticals played a transformative role.
Moreover, the authors’ research finds that significant contributions to mortality reduction (i.e., increased life expectancy) over the period were made across a range of diseases areas wherein the use of pharmaceuticals played a transformative role. Indeed, the authors found significant mortality reduction across a range of disease areas, including ischemic heart disease (a 53 percent reduction); cerebrovascular disease (i.e., strokes, a 10 percent reduction); malignant neoplasms (i.e., cancerous tumors) of the trachea, bronchus, and lungs (10 percent); malignant neoplasms of the breast (4 percent) and of the colon/rectum/anus (4 percent); and HIV/AIDS (7 percent). The use of innovative pharmaceutical drugs contributed extensively to these reductions. To wit, pharmaceuticals accounted for 76 percent of the mortality reduction achieved for HIV/AIDS from 1990 to 2015, 60 percent for cerebrovascular disease, 60 percent for malignant breast neoplasms, 52 percent for ischemic heart disease, and 27 percent for colon/rectal/anal cancers. Pharmaceuticals also accounted for 21 percent of the reduction achieved in infant mortality over this period, particularly regarding the increased use of surfactant and antenatal steroids in preterm births, helping to decrease respiratory distress syndrome.[3] As Cutler explained at the symposium, data points such as these “suggest that prevention, in part through pharmaceuticals, represents an important part of improved U.S. longevity.”[4]
It should be noted that pharmaceuticals’ 35 percent contribution to increased life expectancy included an offset of 9 percent because of opioid-induced poisonings/overdoses on mortality rates (opioids arguably being a pharmaceutical). However, the authors noted that “our overall findings were sensitive to reallocating opioid-related mortality from pharmaceuticals to public health (for example, lack of sufficient Food and Drug Administration [FDA] and Drug Enforcement Administration oversight).” They explained that “in this alternative scenario, 35 percent of gains were due to public health gains and 44 percent of gains were due to pharmaceutical gains.”[5] The authors estimated that the opioid crisis decreased U.S. life expectancy by 0.32 years over the study period, which accounted for a 9 percent decrease in total U.S. life expectancy from 1990 to 2015. Certainly, however, a wide range of socioeconomic and public health factors constitute key drivers of America’s opioid crisis, and if that 9 percent decrease were attributed to public health instead of pharmaceuticals, then the share of increase in U.S. life expectancy attributable to public health and pharmaceuticals would invert, and pharmaceuticals would become the largest contributor to increases in U.S. life expectancy from 1990 to 2015.
Figure 1: Contributions to the change in U.S. life expectancy, 1990–2015[6]
Related Research Documenting the Benefits of Biopharmaceutical Innovation
The research of Cutler and his colleagues is consistent with many similar studies demonstrating the value of biopharmaceutical innovation. Other researchers have also found similarly significant impacts of pharmaceuticals on increased life expectancy. Seabury et al. estimated that approximately 73 percent of survival gains in cancer are attributable to new treatments, including medicines, in a study of cancer patients diagnosed between 1997 and 2007.[7] Howard et al. likewise found that, although cancer remains the leading cause of death in the United States, new cancer drugs contributed to large gains in life expectancy from 1996 to 2011.[8]
Columbia University professor Frank Lichtenberg has also written extensively on the benefits biopharmaceutical innovation provides to society. In one paper, Lichtenberg determined that pharmaceutical innovation accounted for 73 percent of the 1.73-year increase in life expectancy across 30 countries between 2000 and 2009, positing an even higher contribution compared with Cutler’s estimate.[9] Another Lichtenberg study finds that drugs launched after 1981 added 150 million years to the lifespans of citizens in the 22 countries analyzed. Furthermore, in analyzing the value added by biopharmaceutical innovation compared with its cost, Lichtenberg found that, for pharmaceutical drugs launched post-1981 on citizens before 85 years of age, the cost was $2,837 of pharmaceutical expenditure per life year saved. As Lichtenberg noted, this amounts to “about 8% of per capita GDP, indicating that post-1981 drugs launched were very cost-effective overall.”[10] Not only have pharmaceutical expenditures since 1981 been cost effective, but the study also potentially underestimates their true value by not accounting for interbrand competition and the slower growth of prices within older drugs compared with newer ones. To present a counterfactual, Lichtenberg also found that if no new drugs had been launched after 1981, the number of years of life lost would have been more than twice as high as it actually was.
From 1990 to 2015, pharmaceuticals accounted for an estimated 35 percent of the increase in U.S. life expectancy.
Moreover, newer drugs are not only cost effective when considering direct medical benefits such as increased life years, but they also produce significant indirect social benefits. For instance, Lichtenberg found that, from 1997 to 2010, “the value of reductions in work loss days and hospital admissions attributable to pharmaceutical innovation was three times larger than the cost of new drugs consumed.”[11] Here, Lichtenberg found that the mean number of lost workdays, lost school days, and hospital admissions declined more rapidly among medical conditions with larger increases in the mean number of new (post-1990) prescription drugs consumed. He further found that “the use of newer prescription drugs also reduced the ratio of the number of workers receiving Social Security Disability Insurance benefits to the working-age population, and has had a positive effect on nursing home residents’ ability to perform activities of daily living.”[12] Updating this work in October 2021, Lichtenberg estimated the value in 2015 of the reductions in disability, Social Security recipiency, and use of medical care attributable to previous biopharmaceutical innovation. That value, estimated at $115 billion annually, stood fairly close to 2015 expenditures of $127 billion on drug classes that were first approved by the Food and Drug Administration (FDA) during the period of 1989 to 2006.[13]
The work by Cutler and his colleagues joins the work of Lichtenberg and many others documenting the enormous impact of biopharmaceutical innovation in producing new-to-the-world, life-saving, -extending, and -improving drugs for the benefit of humankind.
Key Takeaways
▪ From 1990 to 2015, pharmaceuticals accounted for an estimated 35 percent of the increase in U.S. life expectancy, or over one year.
▪ Pharmaceuticals have played an important role in contributing to mortality reduction across a wide range of diseases, including ischemic heart disease; cerebrovascular disease; tracheal, lung, breast, and colon cancer; and HIV/AIDS, among others.
▪ This paper is novel, as it quantifies the value of pharmaceuticals on life expectancy while demonstrating its impact alongside other contributors such as public health interventions.
Who’s Benefiting? Changes in Who’s Capturing the Share of Pharmaceutical Revenues
It’s clear that innovative drugs produce tremendous value for both individual health and longevity as well as the broader economy and society, but which entities are capturing the value created by biopharmaceutical innovation? The next two presenters addressed the roles played by other, often-overlooked actors in the U.S. biopharmaceutical supply chain—notably, PBMs, insurers, and wholesalers—and how those roles affect manufacturer revenues and the drug costs ultimately paid by American consumers. Presenters further examined the profitability of these supply chain actors, finding that the most-profitable actors weren’t necessarily the enterprises innovating breakthrough drugs.
Less than half of every dollar spent on drugs in the United States goes to the companies actually innovating and manufacturing them.
Andrew Brownlee: Understanding the Pharmaceutical Supply Chain
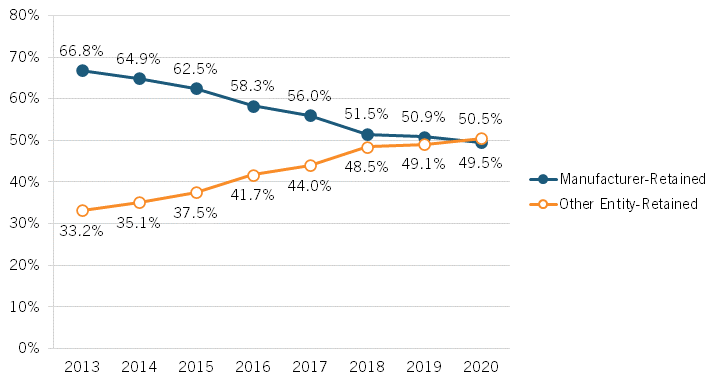
Brownlee’s presentation began by examining changes over time to which parties capture revenue share from drug expenditures in the United States, finding that an ever-increasing share of revenues is accruing to stakeholders other than drug manufacturers. From 2013 to 2020, Brownlee found that the share of revenues accruing to manufacturers decreased by over 17 percentage points, from 66.8 to percent to 49.5 percent while, conversely, the share going to nonmanufacturer entities increased from 33.2 to 50.5 percent.[14] (See figure 2.) In other words, Brownlee’s research suggests that less than half of every dollar spent on drugs in the United States goes to the companies actually innovating and manufacturing them. Further, Brownlee has found that brand manufacturers retain just 37 percent of total spending on all prescription medicines (brand and generic medicines).[15] He also found that payers—including insurers/plan sponsors, the government, and PBMs—received the largest portion (35 percent) of new spending on brand medicines between 2019 and 2020. Indeed, of the $31 billion increase in spending on brand-name drugs over those two years, biopharmaceutical companies captured 28 percent, while payers captured 35 percent and providers and pharmacies captured 23 percent.[16] Overall, Brownlee found that the total gross expenditures for brand medicines nearly doubled from 2013 to 2020, from $268 billion to $517 billion, and that of the total increase of $249 billion, brand manufacturers received 31 percent of the increase while nonmanufacturer stakeholders received 69 percent. In total, Brownlee identified a 180 percent increase in total brand medicine spending received by insurers, PBMs, government entities, and other payers from 2013 to 2020.
Figure 2: Total gross expenditures for brand medicines received by manufacturers and other stakeholders[17]
Brownlee’s presentation also examined changes in the list and net prices of brand-name drugs in the United States, using data provided by Adam Fein at Drug Channels. That research finds that the growth in both list and net prices for drugs decreased from 2014 to 2021 and that net prices actually fell each year between 2018 and 2022. Specifically, the year-over-year growth rate in list prices fell from 13.4 percent in 2014 to 4.3 percent in 2021, and the year-over-year growth rate in net prices fell from 4.6 percent to -1.2 percent. (See figure 3.) This highlights the expanding difference in the drug prices paid by wholesalers (disregarding any rebates) and prices paid by consumers, which has contributed to the growing misconception that brand-name drug prices are skyrocketing for consumers.
Figure 3: Change in average list and net prices of brand-name drugs, 2014–2021[18]

Moreover, data released by Drug Channels in January 2023 finds that, for 2022, brand-name drugs’ net prices dropped for an unprecedented fifth consecutive year and, after adjusting for overall inflation, brand-name drug net prices plunged by almost 9 percent in 2022.[19]
Lastly, Brownlee discussed the rising importance of the 340B program for providers and pharmacies. (The 340B Drug Pricing Program is a U.S. federal government program created in 1992 that requires drug manufacturers to provide outpatient drugs to eligible health care organizations and covered entities at significantly reduced prices.) In 2013, 340B sales accounted for just $3.5 billion in gross profit for providers and pharmacies, which was only 14 percent of their total gross profit. By 2020, providers’ and pharmacies’ gross profits from 340B sales grew over 12 times to $42.4 billion, which was 52 percent of gross profit. What’s more, 340B sales accounted for all the growth in revenue from brand-name sales captured by providers and pharmacies between 2017 and 2020. As the Wall Street Journal wrote about how providers like hospitals gain benefit from the 340B program, “Hospitals can acquire certain drugs that have had significant price increases for nearly free, allowing them to pocket almost the entire cost reimbursed by insurers.”[20] As the Journal continues, “After deductibles and coinsurance are taken into account, patients with health insurance can end up paying more out of pocket than the hospital spends to purchase a drug.”[21]
Overall, Brownlee’s data shows that only roughly 50 cents on each dollar spent on drugs goes to the companies who take the risk of investing, developing, and ultimately manufacturing them, while the rest to goes to other actors in the supply chain. With policymakers concerned about the drug prices Americans confront, this suggests their attention should be at least equally attuned to the roles played by other actors in the pharmaceutical supply chain and figuring out a way to squeeze costs out of the system, post-drug production.
Key Takeaways
▪ The share of total revenues accruing to drug innovators and manufacturers decreased from 66.8 to percent to 49.5 percent from 2013 to 2020 while, conversely, the share going to nonmanufacturer entities increased from 33.2 to 50.5 percent.
▪ Brand manufacturers retain just 37 percent of total spending on all prescription medicines (both brand name and generics).
▪ Despite consumer perceptions, the growth in both list and net prices for drugs decreased from 2014 to 2021 and net prices fell each year between 2018 and 2022.
▪ Between 2013 and 2020, providers’ and pharmacies’ gross profits from 340B sales grew over 12 times to $42.4 billion, representing 52 percent of gross profit.
▪ The expanding difference in the drug prices paid by wholesalers (disregarding any rebates) and prices paid by consumers has contributed to the growing misconception that brand-name drug prices are skyrocketing for consumers.
Neeraj Sood: Examining Returns to Actors in the Pharmaceutical Supply Chain
Neeraj Sood presented findings from several of his recent research reports, including “The flow of money through the pharmaceutical distribution system” (released in 2017) and “Do companies in the pharmaceutical supply chain earn excess returns?” (released in 2020). The latter report, which he coauthored with Karen Mulligan and Kimberly Zhong, examines the economic profitability of key actors in the biopharmaceutical supply chain.[22] Sood also shared subsequent research that proposes an explanation for what’s accounting for the increasing revenue share and profitability of biopharmaceutical supply chain middlemen.
Distribution of Revenues Across the Pharmaceutical Supply Chain
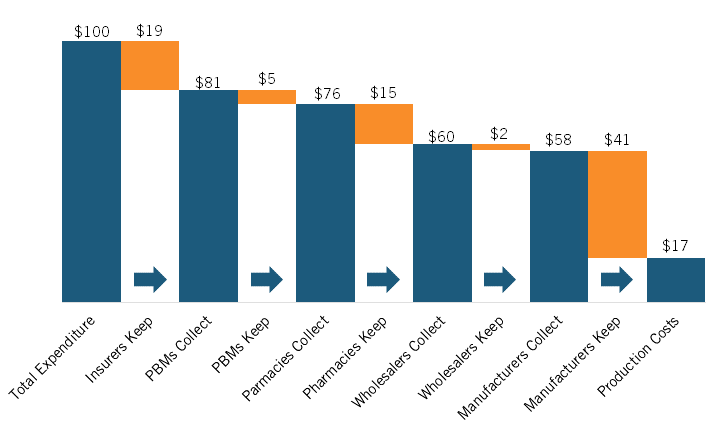
Sood’s presentation began by picking up on a trend identified in Brownlee’s presentation: the increasing share of pharmaceutical expenditures going to nonmanufacturers. In their 2017 paper, Sood et al. traced the flow of funds and products between manufacturers and middlemen (e.g., wholesalers, PBMs, pharmacies, etc.) in 2015 using U.S. Security and Exchange Commission filings of the largest publicly traded companies in the pharmaceutical supply chain. Though the sample studied is different and the report only considers one year, the findings are remarkably similar to those reported by Brownlee. Sood and coauthors estimated that for every $100 spent on prescription drugs (branded and generics) in 2015, $41 was captured by nonmanufacturing middlemen, notably including insurers, PBMs, pharmacies, and wholesalers, with just under $60 going to manufacturers. (See figure 4.)
Figure 4: Flow of hypothetical $100 expenditure on prescription drugs covered under private insurance through U.S. retail distribution system, 2015[23]
Economic Profitability of Actors in the Pharmaceutical Supply Chain
In 2020, Sood and colleagues extended this work by setting out to examine the economic profitability of key actors in the pharmaceutical supply chain. They examined the financial statements of publicly traded manufacturers (biotech and pharmaceuticals companies) and middlemen (insurers/PBMs/retailers and wholesalers) and documented their excess returns—that is, their return on invested capital (ROIC) minus their weighted average cost of capital (WACC), or in other words, the excess profit that occurs when a company generates higher-than-expected returns given the risk of capital invested—between 2013 and 2018.
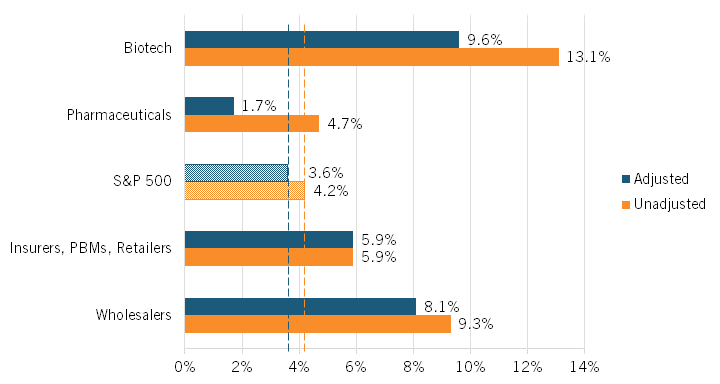
The authors found that the average unadjusted excess rate of return was highest among biotech manufacturers and wholesalers at 13.1 percent and 9.3 percent, respectively. Returns were next-highest for insurers/PBMs/retailers at 5.9 percent and then for pharmaceuticals manufacturers at 4.7 percent, which was only slightly higher than the S&P 500’s average rate of return at 4.2 percent. (See figure 5.) (Companies were classified according to their Standard Industrial Classification codes.)
Figure 5: Average unadjusted and adjusted excess returns in the pharmaceutical supply chain, 2013–2018[24]
However, as Sood pointed out, this unadjusted figure is based on the categorization of R&D spending as an expense, as in financial reporting. Sood argued that because these expenditures represent investments that are intended to yield higher future revenues, they should instead be classified as an asset. Using such a classification, R&D expenditures do not diminish a firm’s capital base since a firm does not lose the value of its R&D expenditures but instead exchanges those funds for another asset of equal value to the firm: R&D activity. Accordingly, the authors calculated an “adjusted ROIC” in which R&D costs were treated as investment expenses (capitalizing them over a useful life of 10 years rather than expensing them in the year in which they are incurred), since, like other investments, R&D expenditures toward drug discovery yield new commercial products that provide future returns for the firm.[25]
Adjusting returns using this classification—that is, treating R&D as an investment rather than an expenditure—the average excess rate of return for biotech manufacturers falls from 13.1 percent to 9.6 percent, while that figure declines from 4.7 to 1.7 percent for pharmaceuticals manufacturers. (See figure 5.) The S&P 500’s adjusted excess returns would fall from 4.2 to 3.6 percent under this scenario. Notably, the average adjusted excess rate of return for pharmaceutical manufacturers is less than half that of the S&P 500 as a whole. The average excess rate of return for wholesalers also falls slightly, though only from 9.3 to 8.1 percent. The average excess rate of return for insurers/PBMs/retailers, on the other hand, remains unchanged, at 5.9 percent.
Figure 5, however, shows that significant excess returns for biotech companies remain even after accounting for R&D as investment. Several factors help explain this. First, between 2014 and 2015, there was a spike in returns on investment due to the breakthrough approval of several Hepatitis C therapies that came to market. Second, the analysis uses a smaller sample size of seven branded biotech companies, none of which were biosimilar companies. In contrast, the pharmaceutical company sample includes 23 branded pharmaceutical companies, with 6 being generic ones. Perhaps more importantly, Sood and colleagues also noted that the excess returns of biotech companies were much more volatile than for pharmaceutical ones. This perhaps suggests that while biotech companies may realize higher excess profits, they are also prone to having riskier investments.
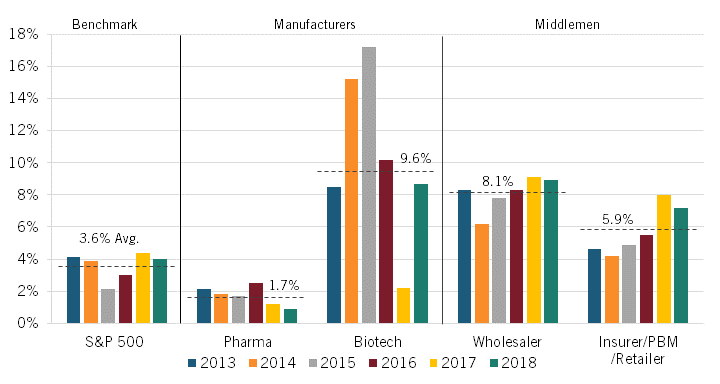
Beyond just considering the average for the period, the authors also considered how the adjusted rates changed during the period from 2013 to 2018. The adjusted rates for the pharmaceutical manufacturers fell slightly over the period. The adjusted rate for biotech manufacturers rose significantly in the first couple years thanks to breakthrough blockbuster drugs (e.g., for hepatis C), but as more “me-too” drugs entered the market, returns subsequently fell back down to roughly the 2013 level. In contrast, however, the excess rate of return rose steadily for both wholesalers and insurers/PBMs/ retailers over this period. (See figure 6.)
Figure 6: Adjusted excess returns, by sector, 2013–2018[26]
As Sood and colleagues at the University of Southern California (USC) Shaeffer Center wrote about this dynamic in a May 2022 filing to the U.S. Federal Trade Commission, “It is telling that the excess returns for the insurer/PBM/retail sector increased over the study period, when both horizontal and vertical consolidation were increasing. Broadly, these results suggest that the returns earned by companies in that category, including both standalone and integrated PBMs, cannot be justified by the risks they bear, and may instead reflect anticompetitive commercial tactics.”[27]
In November 2022, Bai et al. released a report titled “Profitability and risk-return comparison across health care industries, evidence from publicly traded companies 2010–2019” that reached very similar conclusions to those of Sood. The authors used a DuPont analysis framework assessing return on equity (RoE) and RoE volatility to “provide a comprehensive ‘risk-return’ approach for profitability comparison.”[28] Their paper assesses enterprises’ RoE, defined as net income divided by average shareholder equity in a given year. The authors contended that RoE is an appropriately suitable measure to make inter-industry profitability comparisons because it considers three aspects: 1) how shareholder investments enhanced are with borrowings to create assets; 2) how assets are used to generate sales; and 3) how much profit is created from sales.[29]
Sood found that the average adjusted excess rate of return for pharmaceutical manufacturers from 2013 to 2018 was less than half that of that of the S&P 500 as a whole.
Using data from publicly traded companies between 2010 and 2019, Bai et al. found that biotech and pharmaceutical companies had median annual returns on equity of -53 percent and -18 percent, respectively (with those being median figures not driven by outliers). Bai et al. found that “those returns were substantially lower than the other eight health care industries examined—health care equipment; health care supplies; health care distributors; health care services; health care facilities; managed health care; health care technology; and life sciences tools and services—which ranged from -3 percent to +14 percent.”[30] The authors further found that biotechnology and pharmaceutical industries were relatively characterized by high-risk low returns and often with less efficient use of assets due to the volatility of biopharmaceutical innovation.[31] They noted that the median standard deviation of return on equity for these two sectors was over 40 percent from 2010 to 2019, while for the other sectors this figure was below 25 percent, with this higher standard deviation meaning higher uncertainty in returns from investments.
As the authors summarized their study in a STAT article, “Over the last decade, investors in biotech and pharmaceutical companies have been taking risks that aren’t commensurate with the rewards. Yet their contributions and sacrifices lead to important medical discoveries that benefit society as a whole.”[32] Bai et al.’s work adds to that of Sood et al.’s in questioning the validity of assertions that America’s biopharmaceutical enterprises are excessively profitable compared with enterprises in other U.S. industries.
Beyond this, it’s also important to consider the issue of “survivorship bias,” a known limitation in many fields of empirical research, when assessing the profitability of biopharmaceutical enterprises. In other words, in examining the accounting statements of a dozen or so large brand-name drug manufacturers, observers might surmise that the sector as a whole is characterized by high profits, and thus ignore the long tail of firms that have zero or few returns but largely losses. (Indeed, the overwhelming majority of publicly traded drug companies are not profitable, and many are small, pre-profit start-ups.) As the biotechnology investor Peter Kolchinsky frames it, ignoring survivorship bias is tantamount to “assuming all musicians are millionaires from looking at the Grammy winners, ignoring all the undiscovered artists waiting tables.”[33] For instance, studies have found that of the most successful 10 percent of approved drugs, only 1 percent of those that entered clinical trials—maybe three new drugs each year—generate half of the profits of the entire drug industry.[34]
In other words, policymakers must be careful not to conflate the economic returns of a few highly successful drugs to be reflective of the whole industry. Indeed, a 2018 Congressional Budget Office (CBO) report estimated that because of high failure rates, biopharmaceutical companies would need to earn a 61.8 percent rate of return on their successful new drug R&D projects in order to match a 4.8 percent after-tax rate of return on their investments (i.e., a risk-free rate they could readily attain in public markets). The 61.8 percent figure was predicted on the CBO finding that new drug R&D had a 14-year development period and a 90 percent failure rate. Concentrating only on the rate of return to successful projects therefore gives a misleading picture of the overall profitability of biopharmaceutical companies.[35]
The Growing Role of Middlemen in the U.S. Pharmaceutical Supply Chain
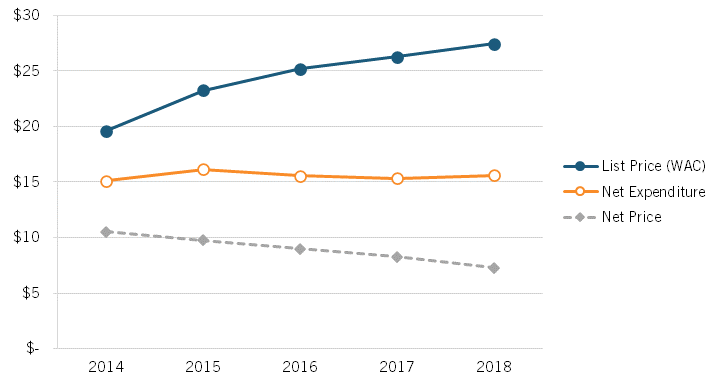
Sood’s presentation noted that the insulin market provides an instructive case study into how list and net prices are evolving for medicines and how the share of expenditures for medicines is increasingly being captured by different actors. For instance, from 2014 to 2018, the mean list price (or WAC, wholesale acquisition cost) on insulin (per 100 ml) for 32 insulin products increased from $19.60 to $27.45, even as the net price fell from $10.53 to $7.29 (a decline of nearly 30 percent), while net expenditures rose almost imperceptibly from $15.11 to $15.59. (See figure 7.) In other words, overall, insulin list prices are rising, net prices are falling, but expenditures are roughly stable.
Figure 7: Mean list price, net price, and net expenditures on 32 insulin products, 2014–2018[36]
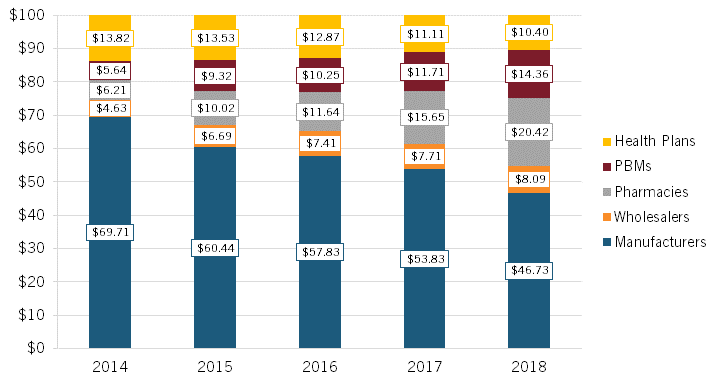
With manufacturers often selling insulin, an essential medicine, to insurers and PBMs at deep discounts (i.e., the difference between the list and net prices), Sood noted that “someone else should be making more, and the someone else is all the middlemen in the supply chain.”[37] To wit, examining the average distribution of $100 in insulin expenditures, Sood found that, from 2014 to 2018, the share going to manufacturers declined by roughly 33 percent, from $69.71 to $46.73, while the share going to middlemen increased significantly, with pharmacies experiencing a 229 percent increase, PBMs enjoying a 157 percent increase, and wholesalers a 76 percent increase (while health plans experienced a 25 percent decrease). (See figure 8.)
Figure 8: Average distribution of $100 in insulin expenditures for 32 insulin products across distribution system participants, 2014–2018[38]
Similar to the insulin case, and indicative of PBMs overcharging for generics, the consultancy 3 Axis Advisors recently examined pharmacy reimbursement trends in Oregon, focusing specifically on Medicaid reimbursements for dimethyl fumarate 240 mg, a treatment for psoriasis. Their research found that:
In 2021, there were a total of 31 states from which 15,930 Medicaid managed care prescriptions for dimethyl fumarate 240 mg were reported. The total reported payment reported for those claims was $52.5 million, of which estimated [cost of goods sold] was $5.6 million. This results in an estimated payment over the manufacturer list price (WAC) of nearly $47 million, or roughly $3,000 per prescription nationally.[39]
Sood explained this phenomenon of growing excess returns captured by the insurer/PBM/retailer constellation as due particularly to decreased levels of competition in the PBM market. According to Sood, there are three types of PBMs whose services an insurer or health plan provider can use: in-house (owned by the insurer), rival (owned by a competing insurer), and stand-alone (not owned by an insurer). As Sood documented, the market share of stand-alone PBMs rose between 2010 and 2015—from less than 5 percent to 20 percent—but fell all the way down to 0 percent in 2016. (See figure 9.)
Figure 9: Market share of PBMs by type, 2010–2018[40]
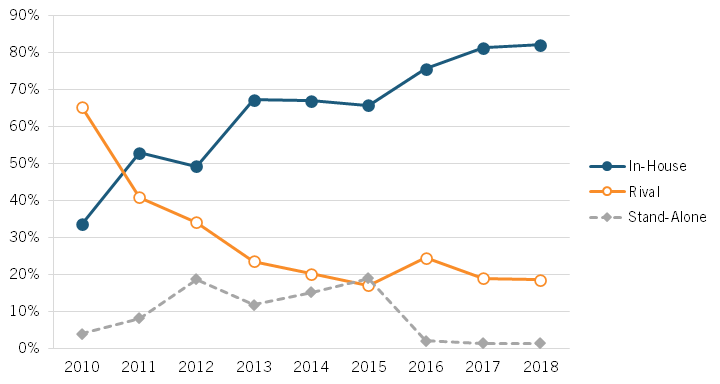
In an increasingly concentrated PBM market, PBMs owned by insurers have less of an incentive to provide quality service to competing insurers. This diminished quality of service is referred to as “input foreclosure.” Through input foreclosure, insurers relying on in-house PBMs receive a clear advantage over those relying on rival PBMs. Sood argued that this is reflected in the higher premiums charged by insurers serviced by rival PBMs. Thus, insurers relying on rival PBMs are more likely to be forced to exit the market, which in turn increases market concentration for in-house PBMs in a self-perpetuating cycle. This dynamic has contributed to two companies operating PBMs—CVS Health and United Health Group—becoming among America’s five-largest Fortune 500 companies (which ranks companies by total revenues for their respective fiscal years) in 2022 and a third, Cigna (which recently purchased Express Scripts) ranking twelfth.[41]
Ultimately, Sood observed that the nuances between list and net prices show a decreasing revenue trend for manufacturers and an increasing revenue trend for nonmanufacturer stakeholders. Sood also spoke to a future with a highly concentrated market of nonmanufacturer stakeholders that become both vertically and horizontally integrated, harming consumers in the form of higher prices.
Key Takeaways
▪ Economic calculations of returns for the biopharmaceutical industry should treat R&D as an investment rather than an expenditure.
▪ Adjusting for that consideration, the average excess rate of return for biotech manufacturers falls from 13.1 percent to 9.6 percent, while that figure declines from 4.7 to 1.7 percent for pharmaceuticals manufacturers.
▪ The average adjusted excess rate of return for pharmaceutical manufacturers studied from 2013 to 2018 was less than half that of that of the S&P 500.
▪ Among the average distribution of $100 in insulin expenditures between 2014 to 2018, the share going to manufacturers declined by roughly 33 percent, from $69.71 to $46.73, while the share going to middlemen increased significantly, with pharmacies experiencing a 229 percent increase, PBMs a 157 percent increase, and wholesalers a 76 percent increase.
Who Should Benefit? The Relationship Between Revenue and R&D
The increasing share of revenues being captured by middlemen is concerning because, as Sood and Brownlee both observed, a decrease in the share of revenues accruing to drug innovators means less resources going toward investing in future cures.
Indeed, as Joe Kennedy wrote in “The Link Between Drug Prices and Research on the Next Generation of Cures,” virtually all academic assessments find strong links between industry returns and R&D investments.[42] For instance, academic research shows a statistically significant relationship between a biopharma enterprise’s profits from the previous year and its R&D expenditures in the current year.[43] Likewise, Gambardella found that sales revenue from previous periods has a significant, positive impact on current-period biopharma R&D.[44] Henderson and Cockburn have found that the pharmaceutical firms with the greatest sales are also the ones with the largest R&D investments.[45] Dubois et al. made this dynamic quite evident, finding that every $2.5 billion of additional biopharmaceutical revenue leads to one new drug approval.[46]
Figure 10: R&D expenditures and sales in the pharmaceutical industry, 2006[47]
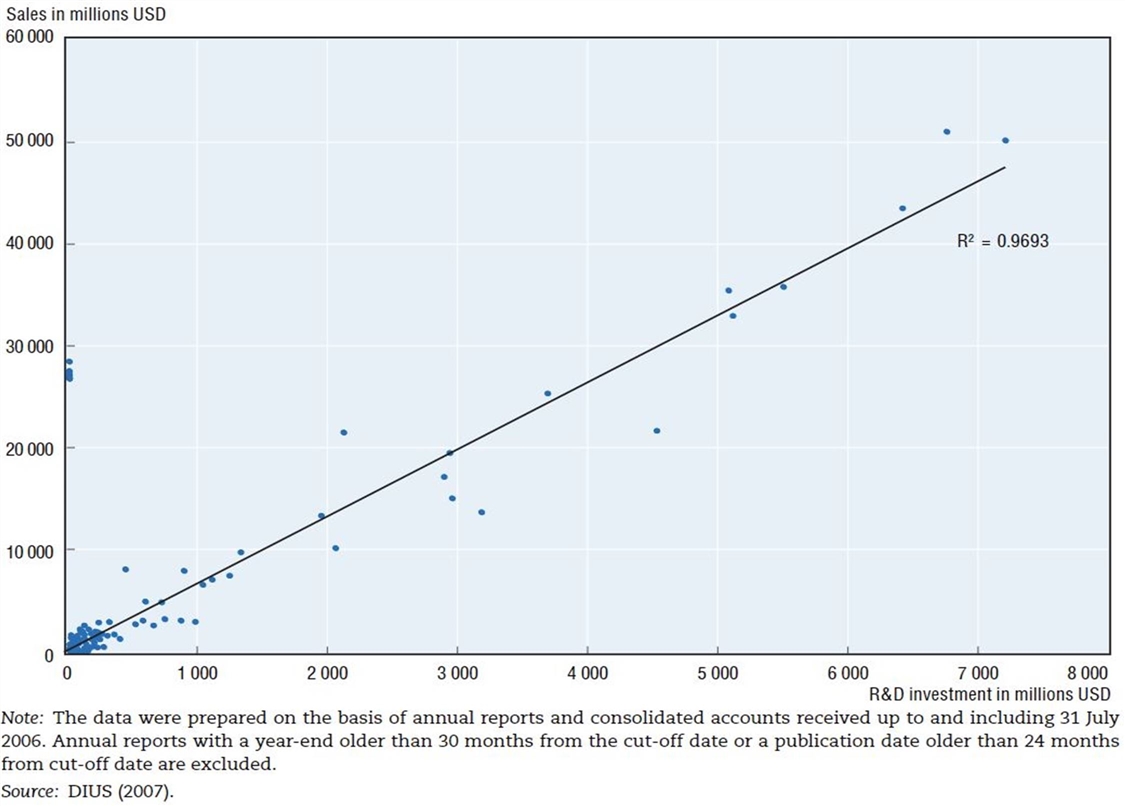
The Organization for Economic Cooperation and Development (OECD) has also identified this dynamic, finding that “there exists a high degree of correlation between pharmaceutical sales revenues and R&D expenditures.”[48] The OECD study finds that there exists an almost 1:1 correlation (0.97) between R&D expenditures and sales in the pharmaceutical industry. (See figure 10.)
Elsewhere, a recent study that reviews the literature on the relationship between revenue and R&D expenditures for pharmaceutical manufacturers by Tomas Philipson and Troy Durie estimates that the elasticity between revenue and R&D expenditures is approximately 1.5—that is, if biopharmaceutical company revenues increase by 1 percent, R&D expenditures are expected to increase by 1.5 percent.[49] In total, the link between biopharmaceutical revenues and research expenditures is apparent throughout the literature.
The reality is the value society receives from each dollar earned by a biopharmaceutical company is substantially greater than the value generated when dollars are consumed by other actors in the pharmaceutical supply chain.
At the same time, the U.S. biopharmaceutical industry is both America’s and the world’s most R&D-intensive industry, of any kind. As the U.S. CBO explained, “Over the decade from 2005 to 2014, the industry’s R&D intensity averaged 18 to 20 percent per year. That ratio has been trending upward since 2012, and it exceeded 25 percent in 2018 and 2019.”[50] This level of R&D investment is substantially more than that of any other U.S. industry. As the CBO observed, “By comparison, average R&D intensity across all [U.S.] industries typically ranges between 2 and 3 percent,” and even “R&D intensity in the software and semiconductor industries, which are generally comparable to the drug industry in their reliance on R&D, has remained below 18 percent.”[51] America’s biopharmaceutical sector accounts for 18 percent of total U.S. business R&D investment. Importantly, the CBO noted,while “Consumer spending on brand-name prescription drugs has risen, [while the industry’s] R&D has risen more quickly.”[52] Moreover, the industry’s share of employment dedicated to R&D is three times higher than the national average; and the sector alone employs over one-quarter of America’s total R&D workforce.
The essential point is this: Sood and Brownlee’s work shows that U.S. wholesalers and insurers/PBM/retailers are at least as—and quite likely much more—profitable than the companies actually innovating and manufacturing drugs. However, the former set of companies aren’t nearly close to reinvesting almost one-quarter of their profits back into R&D, employing nearly one-quarter of America’s R&D workforce, or innovating drugs that have a tremendous impact on enhancing Americans’ quality and length of life. While certainly other stakeholders in the pharmaceutical value chain perform important and needed functions, the reality is the value society receives from each dollar earned by a biopharmaceutical company is substantially greater than the value generated when dollars are consumed by other actors in the pharmaceutical supply chain.
Thus, more so than for any other industry in the United States, less revenue accruing to manufacturers and more accruing to middlemen in the pharmaceutical supply chain means fewer innovations and fewer benefits for society as a whole.
Enhancing the Incentives to Innovate
The previous section documents how weakened revenue growth for biopharmaceutical innovators due to the rising prominence of PBMs, insurers, and wholesalers can ultimately harm R&D expenditures and in turn innovation output. The next section summarizes presentations made by Margaret Kyle and Kristina Acri, which detail the various incentives policymakers can deploy to ensure biopharmaceutical innovation can be maximally promoted.
Margaret Kyle: The Alignment of Innovation Policy and Social Welfare
In her report, “The Alignment of Innovation Policy and Social Welfare: Evidence from Pharmaceuticals,” Kyle identified what is needed to ensure that pharmaceutical innovations are optimal for society and how incentives can be designed to help achieve this.[53] Kyle first contextualized the current effectiveness of innovation policies in promoting biopharmaceutical innovation and found that there is a positive intended effect: appropriate responses from innovators toward various incentives. Innovation policy has contributed to substantial progress in treating infectious diseases, including HIV/AIDS and Hepatitis C, both in the United States as well as the global south. Similarly, new drugs also contributed to significant improvements in cancer life expectancy from 1992 to 2008 in the United States.[54]
While innovation policies have resulted in their intended effect—greater levels of innovation and improved population health outcomes—Kyle found that there are still areas that can be improved upon. For instance, Kyle noted that policy could better incentivize neglected and orphan disease areas and observed that some have contended that too much effort is directed by biopharmaceutical companies toward the development of me-too drugs as opposed to true breakthrough drugs. However, Kyle’s paper engages with these arguments from a different perspective, providing an extensive overview of all possible considerations of successes and failures within biopharmaceutical innovation policies.
Kyle argues that biopharma policies should be evaluated according to the following three criteria:
1. Are innovative efforts being directed at the right targets? (Directing innovation efforts toward the right targets means innovation efforts should proportionately reflect the true burden of disease within a population.)
2. Are innovative efforts being undertaken by the right institutions/people? (The right institutions or people are the most productive or innovative, with R&D dollars being optimally deployed and not wasted.)
3. Have biopharmaceutical innovations/technologies been widely adopted in society? What are the costs associated with adopting new biopharmaceutical innovations?
In particular, the third criteria evaluates pharmaceutical treatments in the era of globalization and advanced manufacturing wherein widespread adoption is relatively low in cost compared with other forms of health care innovation. In other words, Kyle noted that while innovative biopharmaceutical drugs are costly to develop, most can be manufactured at low marginal cost and delivered at low cost, although their adoption by consumers varies greatly and tends to be dependent on a nation’s health system and individual coverage practices. On the other hand, some innovations, such as new surgical procedures, may be both costly to create and deliver, and therefore adoption of these types of technologies may be lower.
The next section of Kyle’s paper discusses two approaches to innovation policies: “pull” innovation policies (e.g., patents, exclusivity rights, and other market incentives) and “push” innovation policies (e.g., direct funding through government grants or tax credits). Pull policies seek to address an inventor’s expected revenue in the form of providing rewards for innovating; that is, the greater the reward, the greater the pull. Kyle has documented that many researchers have found ample evidence that pharmaceutical firms do indeed respond to changes in expected profits by adjusting their investment in innovation.[55] In particular, Kyle has highlighted that for pull policies to be effective, strong linkages between private and social value must be in place so that researchers’ incentives are aligned with those of society more broadly.
The second type of incentive Kyle described is a push policy. While pull policies use greater rewards to incentivize innovation, push policies instead intervene to lower the costs of innovation.[56] Kyle explained that such push policies include “the direct provision of research through government laboratories such as the National Institutes of Health (NIH), in the hopes of generating spillovers that benefit the private sector; directed grants and subsidies to academic researchers; and more generally, tax credits for R&D spending by the private sector.”[57] Notably, push policies play a large role in the United States’ biopharmaceutical landscape through public-private partnerships. For example, early-stage clinical research in recent years has primarily been dominated by early innovators in universities and research institutions, whereas end-stage clinical trial research is often conducted by private sector manufacturers. Therefore, push policies play an important role in helping to initially jump-start the biopharmaceutical innovation process and drug development pipeline. Lastly, push policies play an important role when the private value or gain of developing a novel treatment is well below its social value, whereby government-funded research can help fill innovation funding gaps.
However, as Kyle noted, there are several underlying assumptions that must hold true for pull and push incentives to achieve their intended effect in promoting biopharmaceutical innovation. For pull policies to achieve their intended effect of amplifying innovation, they require the existence of well-functioning product as well as capital markets, meaning that researchers have access to funding sources and are able to commercialize their discoveries. Furthermore, there needs to be sufficient insurance coverage, drug prices properly reflecting their quality, and limited agency problems between physician, patient, and payer. Capital market conditions require that internal and external sources of funding be appropriately allocated. But, more importantly, the effectiveness of patent incentives is severely limited when conditions of efficient product and capital markets do not hold. For instance, too much or too little insurance may distort the true price of care for consumers. Similarly, the prescribing behavior of physicians and the drugs covered by private insurers are subject to factors beyond therapeutic value, such as profitability and marketing. A key characteristic of pull policies is they may favor large and generally more-established firms over small start-ups. This is because large firms can rely on internal finance to fund innovation efforts, whereas start-ups without any revenues and cash flow have no choice but to seek external sources of finance. Furthermore, pull incentives generally promote quantity of innovation but do not necessarily promote value for money. For these reasons, Kyle contended that, while necessary, pull policies cannot be relied upon alone to maximally incent biopharmaceutical innovation without addressing other inefficiencies in health care markets.
For instance, Kyle has noted that pull incentives such as patents have some limitations, “As described earlier, several characteristics of pharmaceuticals—large sunk costs of development and low imitation costs in particular—imply an important role for patents, and a large body of empirical work has confirmed that innovative efforts in pharma are tied to intellectual property rights.”[58] And she has noted that “most studies find that increased exclusivity, whether through patents or other exclusivity terms granted by regulators, is associated with increased innovative efforts.”[59] However, Kyle also noted that patent protections are generally “one size fits all” and are independent of the therapeutic value of the discovery. What makes this difficult to account for is there is imperfect information about the true therapeutic value of a discovery at the time the patent application is filed. Kyle argues that two factors may also affect the effectiveness of patents:
1. The extent to which prices reflect all information.
2. The level of insurance among consumers.
Regarding the second factor, a lack of insurance among consumers means an inability to pay for the drug, which therefore reduces researchers’ profit incentives. Too much insurance, on the other hand, can lead to overconsumption, since consumers do not face the true cost of the drug, which also distorts firms’ research incentives. Lastly, Kyle noted that agency problems exist for both physicians and payers such that their incentives do not always align with those of researchers/manufacturers and consumers. This, too, distorts market incentives and diminishes the effectiveness of pull policies. Yet, even with these limitations and areas to be improved upon, there nevertheless exists a large body of work that confirms that innovation efforts in pharmaceuticals are closely linked to intellectual property rights.
As Kyle elaborated, push policies depend on the assumption of low information costs for government agencies to make informed decisions and require a well-functioning government whose decisions are not politically driven and do not free ride on other countries’ research. When considering risk, the main difference between push and pull policies is pull policies entail private researchers taking on the risks associated with R&D in response to market incentives, whereas push policies lead to the funding government institutions or the public taking on that risk based on their internal decisions. For example, Kyle noted that government institutions such as the NIH tend to be conservative in their funding and may therefore be reluctant to fund riskier ventures or lesser-known researchers. While pull policies have been documented extensively in the literature, push policies have not been as much.
So how are push policies implemented in practice? In the United States, the NIH director chooses funding levels according to scientific needs and opportunities, the burden of disease, and public health need. However, the literature finds that government funding may not necessarily be consistent with maximizing social welfare. For example, Lichtenberg found (in an admittedly older paper from the late 1990s) that NIH funding was more likely to be allocated to benefit those who are white and male.[60] Similarly, Hegde demonstrated that congressional representatives earmark funds for research fields that are most likely to benefit their constituents, and these benefits are largest for state universities and small businesses.[61] Furthermore, Azoulay et al. cited the tendency of the NIH to favor older scientists in its funding allocations.[62] Despite such distortions in push policies, studies still find that NIH funding generates high yields and returns in medical research.[63]
Indeed, those quibbles aside, evidence suggests that NIH funding in general has yielded substantial spillover benefits toward the private sector and spurs private patenting. For instance, Dr. Everett Ehrlich found that one dollar of NIH support for research leads to an increase of private medical research of roughly 32 cents.[64] After reviewing more than 60 academic articles on the relationship between public- and private -sector R&D, Cockburn and Henderson concluded:
There are a number of econometric studies that, while imperfect and undoubtedly subject to improvement and revision, between them make a quite convincing case for a high rate of return to public science in this [life-sciences] industry. It is worth noting that there are, so far as we are aware, no systematic quantitative studies that have found a negative impact of public science.[65]
Kyle’s broader point here is that public biomedical research funding can have a positive impact, but investments must be made judiciously and on a scientific basis. Kyle also has noted that “push funding for pharmaceutical innovation largely serves to boost the efforts of the private sector, rather than to fill the disease gaps overlooked by industry.”[66] Moreover, “because governments rarely finance development through Phase III clinical trials and manufacturing, for example, most drug development efforts initiated by public funding still depend on the transfer of technology to the private sector to reach the market.”[67]
There is little doubt that innovation policy, both pull (especially patents) and push (especially NIH funding), has contributed to the development of pharmaceutical treatments with enormous social benefits.
Ultimately, while push and pull policies deliver a host of advantages, there exist areas of potential improvement in the deployment of both. For example, for push policies that are largely government funded, there is the risk of free riding on biomedical research from other countries in the absence of pull policies such as patent protection. Kyle also recognizes other incentives that are not neatly defined as either push or pull policies but can still influence biopharmaceutical innovation—referring to them as “indirect” innovation policies. The first type of indirect innovation policy pertains to influencing the entry or marketing authorization regulation. For example, the FDA’s Breakthrough Therapy designation expedites the review of treatments for serious conditions that also provide preliminary evidence of significant clinical benefits. Influencing the effective patent life ultimately influences the pull side of promoting biopharmaceutical innovation. Kyle ultimately argues that there’s a need for both push and pull policies to co-exist alongside one another.
Kyle proposes several recommendations to enhance the incentives pharmaceutical firms confront when seeking to innovate:
▪ Tweak existing innovation policies by aligning incentives for firms to pursue riskier breakthroughs with potentially high therapeutic value.
▪ Improve the allocation of government grants.
▪ Improve the quality of and access to health information so government institutions can make more-informed funding decisions.
▪ Increase the use of pay-for-performance contracts.
▪ Increase multilateral coordination of funding and research between countries.
Overall, Kyle presents a balanced assessment of the relative strengths, weaknesses, and opportunities to improve the implementation of push and pull policies alike. Ultimately, however, Kyle concludes, “There is little doubt that innovation policy, both pull (especially patents) and push (especially NIH funding), has contributed to the development of pharmaceutical treatments with enormous social benefits.”[68]
Key Takeaways
▪ Pull incentives use greater rewards to pull and thereby increase biopharmaceutical innovation as well as shape where innovators should prioritize their efforts (e.g., greater rewards in the form of longer patent protection and market exclusivity for orphan diseases).
▪ Push incentives intervene to reduce the cost of innovation and in turn also shape biopharmaceutical innovation priorities.
▪ Some policies exist outside traditionally defined pull and push incentives but still have an indirect influence on the level and type of biopharmaceutical innovation (e.g., regulations on market entry and competition policy).
Kristina Acri: Patent Term Restoration and the Drug Innovation Paradox
Kristina Acri presented research from a recent paper coauthored with Erica Lietzan focusing on a specific incentive mentioned in Margaret Kyle’s presentation: patents.[69] Acri drew attention to what the authors refer to as the “innovation paradox”: Drugs that require longer and more-challenging premarket testing tend to receive fewer patent and exclusivity protections. In fact, innovators are only able to recoup a portion of the time spent on R&D through the patent system, which becomes increasingly smaller the longer premarketing authorization trials are conducted.
To better understand this innovation paradox, Acri contextualized the patent system in the United States and highlighted some of the complicating factors that influence the methodology of the paper. For instance, various parent and child patents (child patents expiring later than parent patents) as well as patent restorations are applied for each drug, complicating the calculation of effective patent term life. Patent restoration was introduced in 1984, when Congress attempted to mitigate lost patent life due to premarket testing by allowing the Patent and Trademark Office (PTO) to restore a portion of the patent limited to one patent per drug for up to 5 years extending no longer than a total of 14 years. Furthermore, the calculation is complicated when a restoration of patent term is applied to different methods of administration of the same drug or if they are applied only to the new chemical entity (NCE) itself. More importantly, 10 years later in 1994, Acri and Lietzan argued that Congress “effectively undid” what was intended in 1984 by changing the patent life to 20 years from filing of application date, without considering the effects on patent restoration. In Acri and Lietzan’s words, “biopharmaceutical companies had to choose later issued original patents to achieve the same result as they would have in 1984 by choosing later issued child patents with restoration.”[70]Choosing a later-issued original patent that often does not include the active ingredient of the drug—known as “secondary patents” (which have been criticized by a growing body of literature)—is one of the very few ways manufacturers can retain the patent life they were receiving in 1984.
The Innovation Paradox refers to how drugs that have a longer premarketing authorization period, which is a proxy indicator for innovation quality, are rewarded instead with a shorter patent life and less marketing exclusivity time.
Acri and Lietzan comprehensively captured these complicating factors to answer the following question: Is society systematically underinvesting in particular areas of medical research? The authors used multivariate regression analysis to measure the effective patent lives of each drug as well as those with or without patent restoration. Crucially, Acri and Lietzan used the patent length intended by Congress in the Hatch-Waxman Act of 1984, which then stipulated that patents should have an effective life of 14 years. They then measured the percentage of drugs in their analysis that achieved 14 years of effective exclusivity, as well as the actual market exclusivity achieved. Using data from 645 approved marketing applications for which a patent was restored between September 1984 and April 2018, they found that drugs that had a longer clinical testing period were more likely to have a shorter effective patent life and shorter marketing exclusivity, and be less likely to achieve the 14-year effective patent life. Essentially, they found that the patent system has not been properly using pull incentives to achieve its fullest potential of promoting the right kind of innovation.
Acri and Lietzan contended that if clinical trials are taking longer than ever before, patent systems instead are incentivizing manufacturers to divest away from diseases that have longer premarket testing, which tend to be more R&D-intensive than they were previously. More importantly, the rigid structures of the patent system fail to consider how premarket testing time is often beyond the control of the manufacturer and instead is more likely to be influenced by the molecule and chemical class, disease and disease stage targeted, and the type of treatments currently on the market. What is concerning about this observation is the effective patent length may skew biopharmaceutical innovation priorities in perverse ways. Symposium participants overall highlighted the importance for future research to understand other policies such as expedited approval programs and their relationship with effective patent life and marketing exclusivity.
The same authors further studied patents in a September 2022 paper focused on evergreening.[71] Evergreening supposedly describes circumstances in which a manufacturer artificially extends market exclusivity using later-issued drug patents. The authors observed that there exist many databases that claim the existence of evergreening, such as one hosted by the University of California Hastings College of Law. In their paper, Acri and Lietzan looked to rebuild the same database with a legal lens to evaluate its accuracy and how patent distortions were actually taking place. Their research finds that for every NCE examined, a generic version was commercially available before the expiration date of the brand drug. Furthermore, 79 generics launched on average seven years before that implied expiration date in the database. Ultimately, Lietzan and Acri assessed whether claims of abusing the patent system in the literature are accurately reported and found very limited evidence for such claims.
Finally, Acri posed the following questions for policy discussion:
▪ Does the innovation paradox discourage research into drugs with longer clinical programs?
▪ Are the type of drugs with longer clinical programs and shorter post-hoc reward (in terms of patent life) those that have high value to society?
▪ How much exclusivity is needed for the optimal amount of medical innovation?
▪ How can the current patent regime be amended to ensure that there is no innovation paradox?
Overall, Acri and Lietzan offer a critical empirical observation: the innovation paradox. Their research ultimately serves to spark a policy debate on how the patent system can better reward those who are investing more into biopharmaceutical innovation.
Key Takeaways
▪ The authors identify an “innovation paradox”: Drugs that require longer and more-challenging premarket testing tend to receive fewer patent and exclusivity protections.
▪ Longer clinical trial periods prior to marketing authorization are associated with a shorter final effective patent life. A longer period between patent filing and the start of clinical trials is also associated with a shorter final effective patent life. As Acri summarized, “Although the magnitude of the impact is small, the results are strongly statistically significant, confirming the hypothesis that longer premarket research and development programs lead to shorter effective patent life, even with patent term restoration.”[72]
Conclusion
ITIF’s 2022 symposium hosted leading researchers in the field of health economics who presented recent research concerning innovation in the biopharmaceutical industry. ITIF summarizes the key conclusions from the presentations as follows:
▪ Biopharmaceutical innovations result in immense benefits for the broader society.
▪ The share of revenues captured by biopharmaceutical manufacturers is decreasing, and the share captured by middlemen in the supply chain is increasing.
▪ After accounting for asset utilization and risks of drug development, economists have found that pharmaceutical companies deliver below-average profitability returns compared with other sectors, despite producing immense value for society.
▪ The incentive structure for biopharmaceutical research exhibits clear room for improvement, particularly with respect to the pursuit of major breakthroughs that tend to carry more risk.
▪ Policy interventions should be driven by empirical research and grounded in the understanding that the biopharmaceutical innovation ecosystem is highly sensitive and may respond to incentives in potentially unexpected ways.
Acknowledgments
ITIF would like to thank Janssen/Johnson & Johnson for its support of this research. ITIF invited its life-sciences supporters to participate in the May 2022 symposium to learn from scholars’ research and have a dialogue with them regarding the economics of biopharmaceutical innovation. The authors would like to thank Robert Atkinson and Ian Clay for their assistance in composing this report.
About the Authors
Stephen Ezell is vice president for global innovation policy at the Information Technology and Innovation Foundation (ITIF) and director of ITIF’s Center for Life Sciences Innovation. He also leads the Global Trade and Innovation Policy Alliance. His areas of expertise include science and technology policy, international competitiveness, trade, and manufacturing.
Kelli Zhao is a policy analyst focusing on the economics of biopharmaceutical innovation. She holds an M.Sc. in international health policy (health economics) from the London School of Economics and Political Sciences and a B.A. in economics from the University of Sydney. Previously, she worked as a research assistant at The George Institute for Global Health in Australia.
About ITIF
The Information Technology and Innovation Foundation (ITIF) is an independent 501(c)(3) nonprofit, nonpartisan research and educational institute that has been recognized repeatedly as the world’s leading think tank for science and technology policy. Its mission is to formulate, evaluate, and promote policy solutions that accelerate innovation and boost productivity to spur growth, opportunity, and progress. For more information, visit itif.org/about.
Endnotes
[1]. Jason Buxbaum et al., “Contributions Of Public Health, Pharmaceuticals And Other Medical Care to US Life Expectancy Changes, 1990-2015,” Health Affairs Vol. 39, No. 9 (2020): 1546–1556, https://www.healthaffairs.org/doi/10.1377/hlthaff.2020.00284.
[2]. Ibid., 1546.
[3]. Ibid., 1551.
[4]. Remark of David Cutler, “Economics of Biopharmaceutical Innovation Symposium,” May 13, 2022.
[5]. Buxbaum et al., “Contributions Of Public Health, Pharmaceuticals And Other Medical Care to US Life Expectancy Changes, 1990-2015,” 1553. The authors also noted that the most-significant effects of the opioid crisis in the United States have been experienced after 2015 and any such post-2015 impacts of the opioid crisis are not reflected in their study.
[6]. Ibid., 1550. The -7 percent is a residual attributable to other/unexplained factors; Ibid., 1553.
[7]. Seth A. Seabury et al., “Quantifying Gains in the War on Cancer Due to Improved Treatment and Earlier Detection,” Forum for Health Economics & Policy, Vol. 19, Issue 1 (November 2015), https://www.degruyter.com/view/journals/fhep/19/1/article-p141.xml.
[8]. David H. Howard et al., “New Anticancer Drugs Associated With Large Increases In Costs And Life Expectancy,” Health Affairs, Vol. 35, Issue 9 (September 2016): 1581–87. https://pubmed.ncbi.nlm.nih.gov/27605636/.
[9]. Frank R. Lichtenberg, “Pharmaceutical Innovation and Longevity Growth in 30 Developing and High-income Countries, 2000–2009,” Health Policy and Technology Vol. 3, Issue 1 (March 2014): 36–58, https://www.sciencedirect.com/science/article/abs/pii/S2211883713000646.
[10]. Frank R. Lichtenberg, “How Many Life-Years Have New Drugs Saved? A 3-Way Fixed-Effects Analysis of 66 Diseases in 27 Countries, 2000-2013” (Working Paper 25483, National Bureau of Economic Research, 2019), https://academic.oup.com/inthealth/article/11/5/403/5420236.
[11]. Frank R. Lichtenberg, “The Impact of Pharmaceutical Innovation on Disability Days and the Use of Medical Services in the United States, 1997–2010,” Journal of Human Capital Vol. 8, No. 4 (Winter 2014): 432–480, https://www.jstor.org/stable/10.1086/679110.
[12]. Ibid.
[13]. Frank R. Lichtenberg, “The Impact of Biopharmaceutical Innovation on Disability, Social Security Recipiency, and Use of Medical Care of U.S. Community Residents, 1998-2015” (National Bureau of Economic Research, Paper NB21-02, June 2021), https://www.nber.org/programs-projects/projects-and-centers/retirement-and-disability-research-center/center-papers/nb21-02.
[14]. Andrew Brownlee and Joran Watson, “The Pharmaceutical Supply Chain, 2013-2020” (Berkeley Research Group, 2022), 3, https://www.thinkbrg.com/insights/publications/pharmaceutical-supply-chain-2013-2020/.
[15]. Ibid., 3.
[16]. Ibid., 5.
[17]. Ibid.
[18]. Adam Fein, “Brand-Name Drug Prices Fell for the Fifth Consecutive Year—And Plummeted After Adjusting for Inflation,” Drug Channels, January 4, 2023, https://www.drugchannels.net/2023/01/brand-name-drug-prices-fell-for-fifth.html.
[19]. Ibid.
[20]. Anna Wilde Mathews et al., “Many Hospitals Get Big Drug Discounts. That Doesn’t Mean Markdowns for Patients.” The Wall Street Journal, December 20, 2022, https://www.wsj.com/articles/340b-drug-discounts-hospitals-low-income-federal-program-11671553899.
[21]. Ibid.
[22]. Neeraj Sood, Karen Mulligan, and Kimberly Zhong, “Do companies in the pharmaceutical supply chain earn excess returns?” International Journal of Health Economics and Management Vol. 21, No. 1 (2021), https://doi.org/10.1007/s10754-020-09291-1.
[23]. Graphic courtesy Neeraj Sood. Sood et al., “Flow of Money Through the Pharmaceutical Distribution System” (USC Leonard D. Schaeffer Center for Health Policy & Economics, June 2017), https://healthpolicy.usc.edu/research/flow-of-money-through-the-pharmaceutical-distribution-system/.
[24]. Sood, Mulligan, and Zhong, “Do companies in the pharmaceutical supply chain earn excess returns?”
[25]. Geoffrey Joyce et al., “Letter to Lina Kahn about the practices of pharmacy benefit managers” (USC Leonard D. Schaeffer Center for Health Policy & Economics, May 25, 2022), https://healthpolicy.usc.edu/wp-content/uploads/2022/06/Van-Nuys-et-al.-Public-Comments-to-FTC-on-PBMs.pdf.
[26]. Sood, Mulligan, and Zhong, “Do companies in the pharmaceutical supply chain earn excess returns?”
[27]. Ibid.
[28]. Ge Bai et al., “Profitability and risk-return comparison across health care industries, evidence from publicly traded companies 2010–2019,” PLoS ONE Vol. 17, Issue 11 (November 16, 2022), 1, https://journals.plos.org/plosone/article?id=10.1371/journal.pone.0275245.
[29]. Anup Srivastava, Rong Zhao, and Ge Bai, “The conundrum of biopharma investing: low rewards and high risks—but a big social benefit,” STAT, November 16, 2022, https://www.statnews.com/2022/11/16/conundrum-biopharma-investing-low-rewards-high-risks-but-big-social-benefit/.
[30]. Ibid.
[31]. Bai et al., “Profitability and risk-return comparison across health care industries.”
[32]. Srivastava, Zhao, and Bai, “The conundrum of biopharma investing: low rewards and high risks—but a big social benefit.”
[33]. Peter Kolchinsky, “Johns Hopkins Study Defies Common Sense and Simple Math,” Inside Sources, December 9, 2019, https://insidesources.com/johns-hopkins-study-defies-common-sense-and-simple-math/.
[34]. Henry Grabowski, John Vernon, Joseph A DiMasi, “Returns on research and development for 1990s new drug introductions” Pharmacoeconomics Vol. 20 (2020), https://pubmed.ncbi.nlm.nih.gov/12457422/.
[35]. Congressional Budget Office (CBO), “How Taxes Affect the Incentives to Invest in New Intangible Assets” (CBO, November 2018), 22-23, https://www.cbo.gov/system/files?file=2018-11/54648-Intangible_Assets.pdf.
[36]. Karen Van Nuys et al., “Estimation of the Share of Net Expenditures on Insulin Captured by US Manufacturers, Wholesalers, Pharmacy Benefit Managers, Pharmacies, and Health Plans From 2014 to 2018,” Journal of the American Medical Association Vol. 2, Issue 11 (2021), https://jamanetwork.com/journals/jama-health-forum/fullarticle/2785932.
[37]. Remark of Neeraj Sood, “Economics of Biopharmaceutical Innovation Symposium,” May 13, 2022.
[38]. Van Nuys et al., “Estimation of the Share of Net Expenditures on Insulin Captured,” 6.
[39]. 3 Axis Advisors LLC., “Understanding Pharmacy Reimbursement Trends in Oregon,” (3 Axis Advisors, October 2022), 83, https://oregonpharmacy.org/wp-content/uploads/2022/10/Oregon_Pharmacy_Pricing_Report_3AA_1022-FINAL.pdf.
[40]. Graphic courtesy Neeraj Sood, presented at “Economics of Biopharmaceutical Innovation Symposium,” May 13, 2022.
[41]. Fortune, “Fortune 500: 2022), https://fortune.com/ranking/fortune500/2022/.
[42]. Joe Kennedy, “The Link Between Drug Prices and Research on the Next Generation of Cures” (Information Technology and Innovation Foundation, September 2019), https://itif.org/publications/2019/09/09/link-between-drug-prices-and-research-next-generation-cures/.
[43]. Destrina Grace Simanjuntak and Raymond R. Tjandrawinata, “Impact of Profitability, R&D Intensity, and Cash Flow on R&D Expenditure in Pharmaceutical Companies” (Social Science Research Network, April 29, 2011), http://papers.ssrn.com/sol3/papers.cfm?abstract_id=1824267.
[44]. Alfonso Gambardella, Science and Innovation: The US Pharmaceutical Industry During the 1980s (Cambridge University Press, 1995).
[45]. Rebecca Henderson and Lain Cockburn, “Measuring Competence? Exploring Firm Effects in Pharmaceutical Research,” Strategic Management Journal Vol. 15, Issue S1 (1994): 63–84, https://doi.org/10.1002/smj.4250150906.
[46]. Pierre Dubois, “Market size and pharmaceutical innovation,” The Rand Journal of Economics Vol. 46, Issue 4 (October 2015): 844–871, https://onlinelibrary.wiley.com/doi/full/10.1111/1756-2171.12113.
[47]. OECD, “Pharmaceutical Pricing Policies in a Global Market,” 190.
[48]. Organization for Economic Cooperation and Development (OECD), “Pharmaceutical Pricing Policies in a Global Market” (OECD, 2008), 190, https://www.oecd.org/els/pharmaceutical-pricing-policies-in-a-global-market.htm.
[49]. Tomas J. Philipson and Troy Durie, “The Evidence Base on the Impact of Price Controls on Medical Innovation” (Working Paper Becker Friedman Institute at The University of Chicago, September 2021), https://bfi.uchicago.edu/working-paper/the-evidence-base-on-the-impact-of-price-controls-on-medical-innovation/.
[50]. Congressional Budget Office (CBO), “Research and Development in the Pharmaceutical Industry” (CBO, April 2021), 4-5, https://www.cbo.gov/publication/57025.
[51]. Ibid., 7.
[52]. Ibid., 3.
[53]. Margaret K. Kyle, “The Alignment of Innovation Policy and Social Welfare: Evidence from Pharmaceuticals,” Innovation Policy and the Economy Vol. 20, Issue (2019), https://doi.org/10.1086/705640.
[54]. Howard et al., “New Anticancer Drugs Associated With Large Increases In Costs And Life Expectancy.”
[55]. Kyle, “The Alignment of Innovation Policy and Social Welfare,” 105. Daron Acemoglu and Joshua Linn, “Market Size in Innovation: Theory and Evidence from the Pharmaceutical Industry,” The Quarterly Journal of Economics Vol. 119, Issue 3 (August 2004): 1049–1090, https://academic.oup.com/qje/article-abstract/119/3/1049/1938820.
[56]. Kyle, “The Alignment of Innovation Policy and Social Welfare,” 109.
[57]. Ibid.
[58]. Kyle, “The Alignment of Innovation Policy and Social Welfare: Evidence from Pharmaceuticals,” 107.
[59]. Ibid.
[60]. Frank R. Lichtenberg, “The Allocation of Publicly-Funded Biomedical Research” (National Bureau of Economic Research Working Paper 6601, June 1998), https://www.nber.org/papers/w6601.
[61]. Deepak Hegde, “Political Influence behind the Veil of Peer Review: An Analysis of Public Biomedical Research Funding in the United States,” The Journal of Law and Economics Vol. 52, No. 4 (November 2009), https://www.journals.uchicago.edu/doi/10.1086/605565.
[62]. Pierre Azoulay, “National Institutes of Health Peer Review: Challenges and Avenues for Reform,” Innovation Policy and the Economy Vol. 13 (2013) https://www.journals.uchicago.edu/doi/10.1086/668237.
[63]. Iain M. Cockburn and Rebecca Henderson, “Publicly Funded Science and the Productivity of the Pharmaceutical Industry,” National Bureau of Economic Research Work Paper, No. 10775 (2001), http://www.nber.org/chapters/c10775.pdf.
[64]. Dr. Everett Ehrlich, “An Economic Engine: NIH Research, Employment, and the Future of the Medical Innovation Sector” (United for Medical Research, 2011), 3, http://www.eyeresearch.org/pdf/UMR_Economic%20Engine_042711a.pdf.
[65]. Iain M. Cockburn and Rebecca Henderson, “Publicly Funded Science and the Productivity of the Pharmaceutical Industry,” National Bureau of Economic Research Work Paper, No. 10775 (2001), 4, http://www.nber.org/chapters/c10775.pdf.
[66]. Kyle, “The Alignment of Innovation Policy and Social Welfare: Evidence from Pharmaceuticals,” 113.
[67]. Ibid.
[68]. Ibid., 116.
[69]. Erika Lietzan and Kristina M. L. Acri née Lybecker, “The Innovation Paradox: Pharmaceutical Marketing Exclusivity and Incentives for Drug Development,” Journal of Pharmaceutical Health Services Research Vol. 10, No. 2 (February 2019): 169–75, https://doi.org/https://doi.org/10.1111/jphs.12288.
[70]. Erika Lietzan and Kristina M.L. Acri née Lybecker, “Distorted Drug Patents,” Washington Law Review Vol. 95, No. 3 (October 2020): 1325, https://digitalcommons.law.uw.edu/cgi/viewcontent.cgi?article=5134&context=wlr.
[71]. Erika Lietzan and Kristina M.L. Acri née Lybecker, “Solutions Still Searching for a Problem: A Call for Relevant Data to Support "Evergreening" Allegations,” Fordham Intellectual Property, Media & Entertainment Law Journal, Vol. 33 (September 26, 2022), https://ssrn.com/abstract=4230310.
[72]. Kurst R. Kast, “Distorted Drug Patents: Does the U.S. Legal System Steer Researchers Away From Drugs that Take a Long Time to Develop?” The FDA Law Blog, October 3, 2019, https://www.thefdalawblog.com/2019/10/distorted-drug-patents-does-the-u-s-legal-system-steer-researchers-away-from-drugs-that-take-a-long-time-to-develop/.
